Abstract
Adhering to the maintenance schedules recommended by the original equipment manufacturer (OEM) is crucial for maximizing gas turbine units’ operational efficiency. Adherence to OEM recommendations helps prevent unexpected breakdowns and downtime, promoting a more reliable operation. Timely maintenance also contributes to extending the turbines' lifespan by identifying and rectifying wear and tear before it escalates, it also enhances safety, reduces operational costs, and maintains warranty and support from the OEM. The consequences of ignoring OEM-recommended maintenance schedules for gas turbine power facilities are investigated in this study. Through gap analysis and MATLAB evaluations, the research determined that gas turbine units with low compliance to the OEM’s maintenance plans demonstrated reduced reliability, compared to units with higher compliance, which showed better reliability. Additionally, the study revealed a clear relationship between critical reliability metrics and the failure to adhere to OEM planned maintenance schedules, underscoring the importance of adhering to inspection schedules for optimal performance in power stations. By highlighting the serious consequences of neglecting these recommendations, the study improves our understanding of how adherence to OEM maintenance standards affects operational efficiency and reliability. It also provides valuable insights and guidance for stakeholders in gas turbine energy generation.
1. Introduction
A gas turbine is a combustion engine in a power plant that can transform liquid fuels such as natural gas into mechanical energy, this energy powers a generator which creates the electrical energy transmitted to residences and commercial buildings via power lines [1]. Gas turbine power plants are vital for meeting the growing energy demands of industries worldwide, they ensure a steady and reliable electricity supply, essential for industrial operations and residences. To maintain their efficiency and longevity, it is crucial to follow the meticulous maintenance practices recommended by the OEMs, these guidelines are derived from extensive operational data testing and analysis, as well as from industry bodies, professional associations, and experts who have provided guidelines and benchmarks that are specific to various operational conditions, they are designed to optimize performance and prevent unplanned downtime. Unfortunately, there have been instances of deviation from these maintenance recommendations in the industry [2]. Thorough investigation and analysis of the impact of non-adherence to OEM guidelines on key performance metrics of gas turbine power plants is essential.
This study examines the effects of ignoring OEM maintenance guidelines on five GE MS 5001 gas turbine power plants located at an oil and gas facility in Nigeria. The goal is to assess the impact on key operational metrics, such as availability, reliability, and critical maintenance indicators. The objectives of this study are to understand the OEM recommendations, quantify deviations from maintenance schedules, the behaviour of the employed metrics as a result of these deviations and to assess the impact of non-compliance with OEM guidelines on reliability metrics. The study's implications encompass enhanced operational efficiency, more informed strategic decision-making, and the establishment of optimal procedures for gas turbine maintenance to maximize asset performance and prolong its operational lifespan within the energy industry.
According to [3], integrating effective maintenance strategies is crucial for the success of maintenance improvement programs, without them, these programs are unlikely to achieve their desired outcomes. Adhering to the maintenance schedules recommended by the OEM is essential for ensuring the reliability and availability of gas turbine units. Effective maintenance planning for gas turbines involves following OEM recommendations for inspections and overhauls to minimize downtime and enhance safety [4]. While some businesses prioritize OEM standards for reliability, others look for cost-saving alternatives, balancing the benefits and risks [5]. [6] emphasizes the importance of training and technical knowledge in executing maintenance plans that align with OEM specifications, however, relying solely on OEM recommendations may not be sufficient for medium-to-high criticality assets, as mentioned by [7]. [8] suggests that deviations from OEM guidelines may be necessary in harsh environments or with modified equipment, but careful cost-benefit analysis and performance testing are required. [9] argues that equipment failures are often caused by a disconnect between OEM design and operational conditions, as a solution, the study advocates for adopting a risk-based maintenance approach. Similarly, [10] identifies the challenge of striking the right balance between maintenance intervals to maximize component life and minimize repair costs. While [11] stressed the importance of accurately determining maintenance intervals to prevent operational losses, [12] opines that vendors’ recommendations may not always suit the specific application of the equipment, underscoring the need for a customized maintenance approach.
2. Materials and methods
The methodology for this study involved a detailed examination of the GE MS5001 gas turbine, focusing on their thermodynamic characteristics and the planned maintenance recommendations outlined by the OEM. Key maintenance metrics and data analysis models, such as mean time to repair (MTTR), mean time before failure (MTBF), availability (A), reliability (R), failure rate (), and downtime hours (DT), were comprehensively reviewed.
The assessment process began with meticulous data collection and cleaning to ensure the reliability and accuracy of results. The OEM-recommended maintenance schedule for the gas turbine units (GTUs), as obtained from the OEM’s operation and maintenance manual, is presented in Table 1. Using data from the company’s ERP system, a compliance table was developed to illustrate adherence to the OEM-recommended maintenance schedule. This table, shown in Table 2, details the scheduled inspections and actual adherence rates for the GTUs.
Evaluation data spanning twelve years (2011–2022) for run hours (Rh), number of failures (F), MTTR, and MTBF were extracted from the company’s HMI historical database and ERP system. These metrics are displayed in Tables 3-8. Calculations for DT, , A, and R, based on the collected data (Rh, F, MTBF, and MTTR), were performed using Eqs. (3, 7, 8, and 9). The results for each unit during the evaluation period are presented in Tables 9-14.
To synthesize the findings, the average values for all metrics across the evaluation period were calculated and summarized in Table 15, which serves as the study's summary table. To further analyze the relationship between inspection adherence and reliability, visual tools such as charts were created. These charts, shown in Figs. 4-7, illustrate trends in reliability metrics and highlight variations in inspection adherence rates.
The use of these charts and tabulated data provided valuable insights into the effects of maintenance adherence on reliability, enabling a comprehensive assessment of the GTUs' operational performance and maintenance practices.
2.1. GE MS 5001 gas turbine overview
The GE MS5001 gas turbine is a versatile and highly regarded industrial gas turbine known for its sturdy construction and reliable performance as shown in Fig. 1(b). Developed by General Electric (GE) as part of the Frame 5 gas turbine family, it is widely utilized in various industries for both power generation and mechanical drive applications due to its reliability and efficiency. With its five main components, as illustrated in Fig. 1(a) – air inlet, compressor, combustor-hot gas path, turbine, and exhaust – the MS5001 is designed to offer high efficiency, durability, and adaptability across different operating conditions, making it a preferred choice for utilities, oil and gas sectors, and industrial power plants [14]. This single-shaft gas turbine features a simple and compact design where the compressor and turbine are integrated on the same shaft, allowing for efficient operation as the turbine directly drives the generator or mechanical load. Its design caters to both simple cycle and combined cycle operations, offering versatility based on specific energy requirements. Capable of delivering a power output ranging from 20-25 MW, the GE MS5001 is suitable for mid-range power generation or as a mechanical drive for compressors or pumps in the oil and gas industry.
Fig. 1GE MS 5001 gas turbine
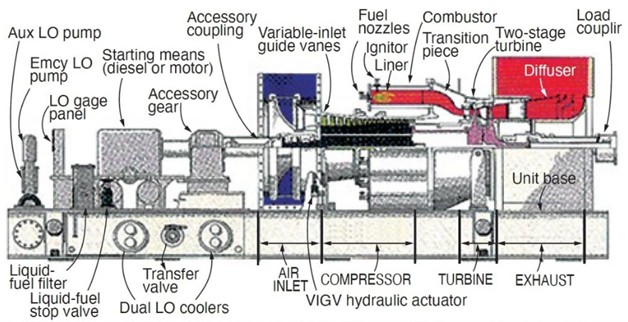
a) Right side view, identifying auxiliaries and their locations on the accessory and turbine base [13]
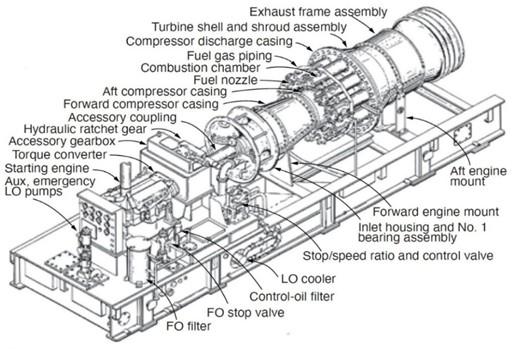
b) Isometric view, showing on base auxiliaries [13]
A key strength of the GE MS5001 lies in its efficiency, achieved through a 13-stage axial compressor for high compression ratios leading to increased thermal efficiency. With an advanced combustion system ensuring low NOx emissions, the turbine is environmentally friendly compared to older models. Its multi-fuel capabilities enable operation on natural gas, distillate oils, or other liquid fuels, adding to its versatility. In combined cycle setups utilizing waste heat to generate additional power through a steam turbine, the MS5001 can achieve efficiencies exceeding 50%. Designed for easy maintenance, the GE MS5001's modular construction facilitates quick inspections and repairs essential for monitoring the turbine’s health and preventing unscheduled downtimes.
Through boroscope inspection (BI), combustion inspection (CI), hot gas path inspection (HGPI), and major inspection (MI), the turbine undergoes regular assessments to maximize lifespan and operational reliability [15]. Widely utilized in industrial and utility applications, the GE MS5001 finds favour in driving compressors or pumps in the oil and gas sector and powering base-load and peaking power plants in the electricity generation industry, particularly excelling in combined-cycle setups. Known for its durability and long service life, the MS5001 operates reliably in challenging environments with minimal performance deterioration when properly maintained, ensuring industries with continuous operation requirements benefit from its consistently high availability rates over decades.
2.1.1. Thermodynamic characteristics
Fig. 2(a) illustrates the thermodynamics diagram of a GE MS 5001 gas turbine, which is designed based on the Brayton cycle. This diagram showcases the relationship between pressure and volume throughout the four phases of the gas turbine cycle. The compression phase (1-2) involves compressing air in the compressor, which increases its pressure and decreases its volume. Following this, the combustion phase (2-3) takes place. In this phase, the compressed air is mixed with fuel and undergoes combustion at constant pressure, releasing significant energy. The expansion phase (3-4) occurs in the turbine, where the high-pressure, high-temperature gases expand and perform mechanical work. This work reduces both the pressure and temperature of the gases, ultimately generating electrical power. Finally, the exhaust phase (4-1) involves discharging the exhaust gases, completing the cycle. The Temperature-Entropy (TS) diagram provides a more detailed view of the thermodynamic changes that occur within the gas turbine cycle. It shows the isentropic compression (1-2 s) and expansion (3-4 s) phases as vertical segments, indicating no change in entropy. However, the real compression (1-2) and expansion (3-4) stages deviate from these ideal lines due to friction and heat transfer. The combustion phase (2-3) occurs at constant entropy, meaning there is no change in entropy during this period. Together, these diagrams illustrate the key processes and thermodynamic changes that take place in the gas turbine cycle.
Fig. 2Gas turbine cycles example
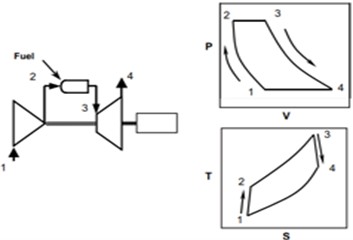
a) Brayton cycle [16]
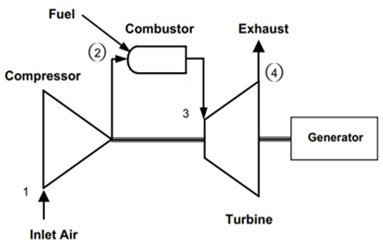
b) Single cycle, single shaft gas turbine [16]
Fig. 2(b) shows a single-shaft, simple-cycle gas turbine schematic. The diagram shows the steps involved in the process. Under standard ISO conditions (59°F/15°C, 14.7 psi/1.013 bar, 60 % relative humidity), air enters the axial flow compressor at point 1. At this stage, the air is compressed, increasing pressure and temperature. The compressed air then exits the compressor at point 2 and enters the combustion system. In this system, fuel is injected and combusted at a constant pressure. The purpose of the combustion system is to ensure thorough mixing, burning, dilution, and cooling. As a result, the gases exiting at point 3 have an average temperature. These hot gases then proceed to the turbine section. In the turbine section, the energy of the gases is converted into work through two stages: the nozzle section, which expands the gases into kinetic energy, and the bucket section, which converts this kinetic energy into mechanical work. The turbine powers the generator and provides energy at the gas turbine's output flange. Typically, more than half of the turbine's work is used to drive the generator.
2.1.2. Types of inspections
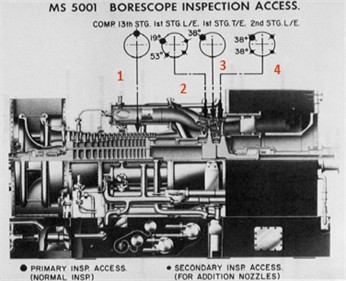
The GE MS5001 gas turbine necessitates various critical inspections crucial for ensuring reliable operation and prolonging its service life. Each inspection type plays a specific role in the comprehensive maintenance schedule of the GE MS5001 gas turbine. BI offers routine, non-invasive assessments to detect early signs of wear. These inspections form part of a proactive maintenance strategy aimed at evaluating diverse turbine components and identifying any potential issues at an early stage. Key inspection types encompass BI, CI, HGPI, and MI.
Fig. 3Types of inspections
a) BI pots [17]
b) CI area [17]
c) HGPI area [17]
d) MI area [17]
Boroscope Inspection, depicted in Fig. 3(a), is a non-invasive visual inspection method that involves using a boroscope, a fiber-optic instrument, to examine the internal components of a gas turbine without the need for disassembly. This type of inspection allows maintenance teams to visually assess the condition of critical parts such as blades, vanes, and combustion chambers. It is typically carried out during short operational outages or planned maintenance intervals to detect issues like erosion, cracks, or foreign object damage early on, thereby reducing downtime and preventing major failures.
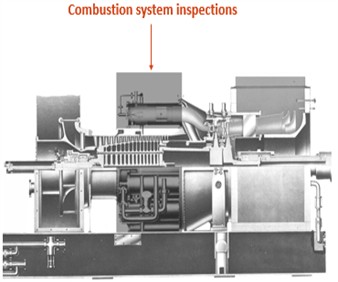
Combustion inspection, as illustrated in Fig. 3(c), focuses specifically on the combustion section of the gas turbine, including components like combustion liners, transition pieces, and fuel nozzles. This inspection is usually conducted after a certain number of operating hours or starts to evaluate the wear and tear on components exposed to high temperatures and thermal cycling. Regular combustion inspections help prevent combustion-related failures that could lead to unplanned outages or decreased efficiency by replacing or repairing worn parts.
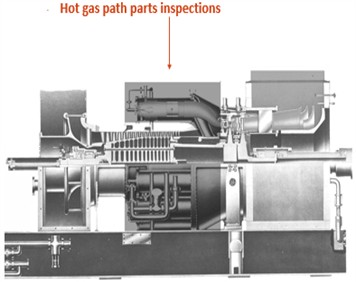
Hot gas path inspection, as shown in Fig. 3(b), is a more detailed examination that concentrates on the high-temperature sections of the gas turbine, such as turbine nozzles, blades, and shrouds. This inspection involves partial disassembly of the turbine to thoroughly examine parts most susceptible to heat-related degradation. It is performed after longer periods of operation or according to OEM recommendations to identify issues like thermal fatigue, cracking, or deformation, ensuring damaged parts are replaced promptly to prevent significant damage or performance loss.
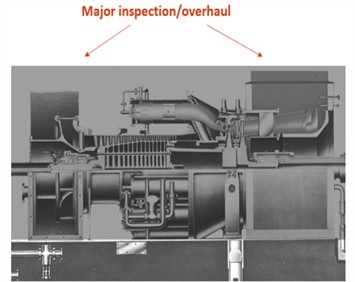
MI, as depicted in Fig. 3(d), is the most comprehensive type of inspection conducted on a gas turbine, involving a complete teardown of the turbine to thoroughly examine all major components, including the compressor, combustor, and turbine sections. MI are typically scheduled after a significant number of operating hours (or years) to restore the turbine to like-new condition. During this inspection, critical parts are carefully inspected, and any worn or damaged components are replaced or refurbished [18]. A Major Inspection helps extend the overall life of the turbine, ensuring long-term reliability and efficiency. Though it is time-consuming and costly, it is essential for maintaining the operational integrity of the gas turbine.
2.2. Maintenance metrics and associated equations
Equipment such as the gas turbine requires proper maintenance as it is crucial for its smooth operation and as it ensures the stability of production processes [19]). Maintenance metrics, both basic and advanced, play a key role in evaluating an organization’s maintenance strategy and needs, as well as in understanding and improving its performance criteria [20]. These metrics serve as performance indicators to measure maintenance activities' effectiveness, efficiency, and overall performance. Some common metrics include MTBF, which measures reliability, MTTR, which measures efficiency, and overall equipment effectiveness (OEE), which measures productivity. Other metrics such as scheduled maintenance compliance, unplanned downtime, and maintenance cost as a percentage of replacement asset value (RAV), help assess adherence to schedules, the impact of failures, and cost-effectiveness. Additional metrics like work order backlog, equipment failure rate, mean maintenance time (MMT), and inventory turnover ratio for spare parts aid in workload management, trend identification, labour efficiency, and inventory optimization.
According to [21], manufacturing organizations need to create metrics for accurately tracking performance, these metrics are crucial for monitoring performance, identifying improvement opportunities, and making data-driven decisions to enhance maintenance strategies and operational efficiency. Availability, failure rate, MTTR, MTBF, reliability, and number of equipment failures were among the metrics used in the study, during the assessment phase. The secondary data collection method was applied and its examination was done using MATLAB and a gap analytical approach, an approach predicated on basic reliability principles that heavily rely on the presence of a maintenance and operation database.
2.2.1. Mean time to repair (MTTR)
The MTTR is the average amount of time required to fix or restore a gas turbine to normal operation after a malfunction or failure. This accounts for the time required to locate the problem, replace the problematic parts, make the necessary repairs, and conduct the necessary testing and inspections before resuming operation [22]. The MTTR is a crucial metric that operators and maintenance personnel should monitor to ensure the overall reliability and availability of gas turbine units, it is expressed thus:
Where is the downtime hours and is the number of failures. The objective is to minimize the MTTR while simultaneously increasing the power plant's output and profitability. A lower MTTR indicates that the plant has a quick rate of recovery and is well-maintained. Depending on the type and condition of the equipment, world-class MTTR varies. Accurately quantifying MTTR requires the use of CMMS or ERP with suitable processes and timestamps that collect data from multiple sources.
2.2.2. Mean time between failures (MTBF)
The MTBF of a gas turbine is the average time interval between two consecutive turbine failures or the expected operating time you can expect from the turbine before it breaks down [23]. A higher MTBF suggests that the plant is well-maintained and reliable. A gas turbine's MTBF can be influenced by a variety of factors, including the turbine's design, component quality, operating conditions, maintenance procedures, and other external factors. GTs have MTBF ratings that normally range from 20,000 to 50,000 hours or more, meaning that they are built to last for many thousands of hours before failing. However, with different turbines and their operating circumstances, the actual MTBF value can differ significantly. It's crucial to remember that MTBF is only a statistical estimate and cannot ensure that a gas turbine will function without failure for a predetermined period. It is only an estimate derived from past performance and additional variables. For this reason, it’s crucial to conduct routine maintenance and inspections on gas turbines to guarantee their reliability and safe functioning. MTBF is expressed as:
where TH is total hours, UT is uptime hours. When calculating a GT's MTBF, historical data on the failures of similar gas turbines can be used. Specifically, as shown in Eq. (2), the MTBF of a power station is determined by dividing the total operating time of all the gas turbines in the dataset by the number of failures that occurred during that time (in this study, 8760 yearly hours are considered). World-class MTBF varies and depends on equipment type, age, and duty cycle.
2.2.3. Availability (A)
The percentage of time that the GT is usable is indicated by this. An operational and well-maintained plant has a high availability rate; on the other hand, a low availability rate indicates problems that need to be fixed. The percentage of a certain period, usually a year that a GT is available and operational is referred to as its availability. Availability is a key performance indicator for evaluating the efficacy of operating and maintenance strategy, it is a measure of a GT's reliability and performance. Availability and reliability are two distinct metrics used to assess the performance of a system or piece of equipment, one could think of reliability as a subset of availability. The ratio of the GT's entire operating time to the total amount of time it was planned to be available for operation is commonly used to determine GT availability. The following equations, Eqs. (3-5), is usually used to determine a GT’s availability: where TH is total hours, which is equal to 8760 hours, Rh is run hours:
The formula for availability in terms of MTBF and MTTR is given by:
Relatively, for average Availability () of several years, , , , , , ,…, :
A highly available machine may not necessarily be reliable if it frequently experiences downtime or failures. Reliability assesses the impact of lost time on operations, focusing on the likelihood of failure and the consequences of those failures. In contrast, availability measures the quantity of time an equipment is operational and accessible for use. An equipment can have high availability by being operational for long periods but may still lack reliability if it is prone to frequent breakdowns. Businesses need to consider both reliability and availability metrics to ensure optimal performance and minimize disruptions in operations. Balancing these factors can lead to a more robust and efficient equipment management strategy.
2.2.4. Reliability (R)
The ability of a GT to perform as intended under particular conditions without malfunctioning is known as its reliability. Gas turbine power plants' output, efficiency, long-term sustainability, safety, and environmental performance are all significantly impacted by reliability [24]. It is typically expressed as an approximate probability of success over a specified period. Well-maintained GTs are thought to be reliable and able to run continuously for extended periods. The amount of time that equipment functions without breaking down is usually used to measure its reliability. For equipment that has inbuilt redundancy, it is necessary to account for all possible outcomes or modes of redundancy when estimating the probability of failure. If a piece of equipment is meant to function for 5,000 hours without experiencing any problems, for example, and it does so, then it can be said to be 100 % reliable; if not, then it is not. The probability that the equipment will stay operational beyond a given time t is represented by the reliability function, symbolized as (𝑡). The reliability function can be written mathematically as follows:
The equipment failure probability is calculated using the natural logarithm in Eq. (6), where is the time, is the failure rate per unit time, and is the reliability function at time . This formula indicates that the probability of failure is independent of the equipment's lifespan because it assumes that the failure rate will remain constant over time. Reliability function in reliability engineering is the chance that a system will function without failure for a given amount of time. The formula demonstrates how a system's reliability decreases exponentially over time as failures occur. In contrast, a lower failure rate denotes high reliability, whereas a high failure rate suggests a low gas turbine power plant reliability over time. In real-world situations, this formula could not always hold because it presupposes that the failure rate, , remains constant throughout time. The relationship between reliability and failure rate is reflected in the exponential decay function , which indicates that reliability declines with time as failures happen.
Availability, however, can have an impact on reliability. A system that is available 70 % of the time, for example, is most likely reliable 70 % of the time (a 100 % probability is assumed in this case) or at 100 % gas turbine power plant utilization. Reliability, however, can also consider additional factors like the possibility of a malfunction while the system is in operation, maintenance downtime, etc. Therefore, reliability emphasizes the likelihood of a system operating successfully over time, whereas availability tells you how frequently a system is operational. Based on this supposition, the relationship between availability and reliability is expressed as:
Boosting reliability can be achieved in many ways, including lowering a system’s complexity, increasing the reliability of its parts, using high-durability (design for reliability) components, utilizing standby and parallel redundancies, testing, and validation [27]. Establishing stringent quality control measures during the production or manufacturing process can help identify defects and deviations from specifications before they impact the finished product. Similarly, a well-defined maintenance plan that includes inspections, repairs, and preventive maintenance can help identify and address issues before they become failures.
2.2.5. Failure rate ()
The failure rate of an asset is the frequency with which it performs below expected levels or is not used to its full potential. It is frequently expressed as the number of failures per unit of time or use and is a helpful metric for assessing the reliability and effectiveness of a Gas Turbine Plant. A low failure rate indicates improved quality and reliability, whereas a high failure rate suggests subpar quality, flaws in the design, or insufficient maintenance. The failure rate is expressed as:
Equipment failures can be inadvertently caused by errors made by operators, maintenance personnel, or other staff members. A high failure rate is indicative of low system reliability. Premature equipment failures can also be brought on by poor maintenance practices, and insufficient or inconsistent maintenance deployment, such as neglecting routine maintenance or failing to follow advised maintenance practices. Equipment components may eventually deteriorate and become worn out as a result of age or repeated stress; if the primary equipment fails, vital components lacking backup or redundant systems may fail the entire system.
Analysing failure rates is essential for various aspects such as reliability prediction, maintenance planning, risk management, and cost management [26]. It serves multiple purposes, including predicting the reliability and lifespan of systems and components, informing maintenance schedules and preventive maintenance strategies, identifying critical components with high failure rates, and reducing maintenance and operational costs. This analysis allows for the prevention of unexpected failures and the optimization of spare parts inventory.
2.2.6. Downtime hours (DT)
Equipment downtime is the period that a machine or piece of equipment is not operating as intended or is not usable for a variety of reasons, including maintenance, repairs, malfunctions, or other problems. Equipment outages can be classified into three categories: scheduled, unscheduled, and unanticipated. Unplanned downtime happens suddenly and unexpectedly, whereas planned downtime is scheduled and planned. Unplanned downtime is not unexpected, and it is also not prearranged. Many variables can be blamed for equipment downtime, including maintenance and repair, human factors, equipment failure, supply chain problems, environmental conditions, age, and obsolescence. Equipment downtime can result in lower output, higher expenses, and problems with quality control, inventory accumulation, and reputational damage. Strategies including routine maintenance, predictive maintenance, equipment upgrades, operator training, inventory and spares management, quality control procedures, and emergency response planning can all be used to minimize equipment downtime. Manufacturing organizations can boost performance, optimize cost, and increase production by comprehending the reasons behind equipment downtime and putting efficient plans in place to cut down on downtime hours [27]. Equipment yearly downtime hours are mathematically expressed as:
Tracking total downtime hours, MTBF, MTTR, and percentage downtime are critical aspects of measuring equipment downtime. Total downtime hours provide a straightforward measure of the cumulative time an equipment is out of operation.
3. Results and discussion
3.1. Results of OEM maintenance recommendations
The OEM recommended CI and BI to be carried out after every 8,000 run hours or 400 GT starts, HGPI, every 24,000 run hours or 1,200 GT starts, and MI every 48,000 run hours or 2,400 GT starts ([18], Table 1). While the BI is a condition-based maintenance inspection that is done using a boroscope, the CI, HGPI, and MI are scheduled maintenance inspections. The OEM also recommended routine inspection, which is carried out frequently and aims to determine the condition of GTPs by measuring, testing, or visually inspecting them, to look out for wear, damage, or potential problems, to keep them reliable and available for extended periods. Standard equipment start-up and steady-state parameters must be determined to evaluate turbine performance and maintenance requirements. This can only be done through regular data collection, and recording, guaranteeing a timely and accurate evaluation of the turbine's performance. Interviews with the plant manager, O&M engineers and technicians, control room operators, and other members of the power plant operation and maintenance team revealed consensually that the OEM’s routine inspection guidelines were followed.
Table 1Scheduled BI=CI, HGPI, and MI interval
Type of inspections | Interval (hours/starts) | Interval (days) | Interval (months) | Interval (years) | Recommended No. of inspections (12 years period) |
BI | 8,000 hours | 333 | 11 | 0.9 | 13 |
CI | 8,000 hours or 400 starts | 333 | 11 | 0.9 | 13 |
HGPI | 24,000 hours. or 1,200 starts | 1000 | 33 | 2.7 | 4 |
MI | 48,000 hours. or 2,400 starts | 2000 | 66 | 5.5 | 2 |
Source: [18] | |||||
Having an in-depth understanding of the features, specifications, design, and operation of OEM gas turbines makes it easy to develop maintenance schedules that adhere to safety regulations. Through proper operation within their design parameters and replacement or overhaul at the recommended intervals, maintenance suggestions maximize the life of components. Owner warranties are often offered with gas turbines; if these guidelines are not followed, warranty coverage may be nullified. Due to vast data trending advised by OEMs, customers gain from planned maintenance which is typically more economical than reactive maintenance. It is therefore essential to abide by these recommendations to maximize the equipment's lifespan and efficiency.
3.2. Results of the degree of noncompliance with OEM recommended plans
According to ([19], Table 2), for the twelve years evaluation period, the OEM recommended thirteen CIs, of those, two were performed on 2540A, resulting in a deficit of eleven CIs; six were performed on 2540B, leaving a deficit of seven; four were performed on 2540C, resulting in a deficit of nine; seven were performed on 2540D, resulting in a deficit of six; and seven performed on 2540E, resulting in a deficit of six. Secondly, the OEM recommends four HGPI inspections for the period, but only one HGPI was performed on 2540A, meaning, there was a shortfall of three; 2540B had three HGPIs carried out on it, leaving a deficit of one; 2540C had two HGPIs carried out on it, leaving a deficit of two; 2540D had three HGPIs carried out on it, leaving a deficit of one; 2540E had three HGPIs carried out on it, leaving a deficit of one. Lastly, two MIs were recommended by the OEM for the period, 2540A, 2540B, and 2540C, conducted none, resulting in a deficit of two, one MI each was conducted by 2540D and 2540E, resulting in a deficit of one for each of the two units.
Table 2Recommended BI, CI, HGPI, MI, and the Actual
Recommended (Rec.) BI, CI, HGPI, MI and the Actual (Act.) inspections done between 2011-2022 | ||||||||
Units | BI | CI | HGPI | MI | ||||
Rec. | Act. | Rec. | Act. | Rec. | Act. | Rec. | Act. | |
2540A | 13 | 2 | 13 | 2 | 4 | 1 | 2 | 0 |
2540B | 13 | 6 | 13 | 6 | 4 | 3 | 2 | 0 |
2540C | 13 | 4 | 13 | 4 | 4 | 2 | 2 | 0 |
2540D | 13 | 7 | 13 | 7 | 4 | 3 | 2 | 1 |
2540E | 13 | 7 | 13 | 7 | 4 | 3 | 2 | 1 |
Source: [19] | ||||||||
A comparison between the recommended and actual inspection results is required to assess the efficacy of maintenance deployment. Deficits in recommended inspections (CIs, HGPIs, and MIs) in multiple units raise concerns about the station’s reliability, maintenance department, and management system. It implies a possible disregard for OEM recommendations. Fostering a culture of continuous improvement in the maintenance department involves several steps which include: evaluating corrective actions, implementing a monitoring system, improving planning and scheduling processes, and educating staff members about the importance of following OEM maintenance recommendations. This strategy can increase equipment reliability, compliance with OEM maintenance recommendations, and downtime reduction.
3.3. Obtained data from the company’s ERP system
Tables 3-8 provided data encompassing operational metrics – Rh, F, MTBF, and MTTR – for five GTUs (2540A to 2540E) from 2011 to 2022.
Run hours, which indicates the total annual run hours of the GTUs, has remained relatively stable, fluctuating between 5,000 and 8,500 hours. This stability suggests consistent operations, with variations potentially arising from changes in demand, maintenance schedules, or downtime due to failures. For instance, GTU 2540B experienced a slight decline in operational hours in 2015 but recovered in the following years. In contrast, 2540D and 2540E consistently achieved high operational levels, with run hours typically exceeding 8,000 hours. In contrast, the number of failures exhibited significant variation over the years. 2540A consistently recorded the highest failure rates, ranging from 122 to 139 per year, indicating possible reliability issues, possibly due to inadequate maintenance or aging components. 2540C also experienced an increase in failures, particularly after 2018, when failures surged to 126. Conversely, 2540D and 2540E maintained relatively low failure rates, often below 50 per year, demonstrating better reliability, likely attributable to effective maintenance practices. The MTBF statistics, which measure the average time between failures, reflect the reliability trends observed in the failure data. 2540D and 2540E consistently exhibit higher MTBF values, signalling fewer failures and longer operational periods between breakdowns. In contrast, 2540A and 2540C show significantly lower MTBF levels, reflecting their frequent failures. Specifically, 2540A’s MTBF remains around 60 to 70 hours, while 2540D’s MTBF consistently exceeds 200 hours, peaking at 337 hours in 2019.The time required to repair the machines (MTTR), has shown improvement over the years for most units. 2540D and 2540E report particularly low MTTR values, with repair times dropping to as low as 5 to 15 hours in recent years, contributing to their higher reliability and reduced downtime. In contrast, Units like 2540A and 2540C often have longer repair times, with MTTR values exceeding 30 hours at times. Although repair times for these Units have stabilized in recent years, the combination of frequent failures and lengthy repair times results in higher operational costs and reduced availability ([29], Tables 3-8).
Table 3Metrics values obtained from the company’s ERP system, between 2011 and 2012
Year | 2011 | 2012 | ||||||||
Metrics | 2540A | 2540B | 2540C | 2540D | 2540E | 2540A | 2540B | 2540C | 2540D | 2540E |
Run hours-Rh, h | 5606 | 7306 | 5755 | 8059 | 8208 | 5361 | 7192 | 6211 | 8480 | 8436 |
Number of failures-F, f | 122 | 51 | 86 | 32 | 27 | 127 | 54 | 89 | 37 | 28 |
MTBF, h | 72 | 172 | 102 | 274 | 324 | 69 | 162 | 98 | 237 | 313 |
MTTR, h | 23 | 26 | 35 | 22 | 20 | 27 | 29 | 29 | 5 | 16 |
Table 4Metrics values obtained from the company’s ERP system, between 2013 and 2014
Year | 2013 | 2014 | ||||||||
Metrics | 2540A | 2540B | 2540C | 2540D | 2540E | 2540A | 2540B | 2540C | 2540D | 2540E |
Run hours-Rh, h | 5773 | 7665 | 5983 | 8410 | 8156 | 5370 | 7569 | 5860 | 8331 | 8296 |
Number of failures-F, f | 119 | 50 | 87 | 33 | 41 | 132 | 49 | 117 | 40 | 45 |
MTBF, h | 74 | 175 | 101 | 265 | 214 | 66 | 179 | 75 | 219 | 195 |
MTTR, h | 25 | 22 | 34 | 11 | 15 | 26 | 24 | 25 | 11 | 12 |
Table 5Metrics values obtained from the company’s ERP system, between 2015 and 2016
Year | 2015 | 2016 | ||||||||
Metrics | 2540A | 2540B | 2540C | 2540D | 2540E | 2540A | 2540B | 2540C | 2540D | 2540E |
Run hours-Rh, h | 5738 | 6903 | 5887 | 8208 | 8392 | 5536 | 7788 | 5764 | 8559 | 8348 |
Number of failures-F, f | 130 | 53 | 79 | 39 | 29 | 132 | 52 | 121 | 43 | 30 |
MTBF, h | 67 | 165 | 111 | 225 | 302 | 66 | 168 | 72 | 204 | 292 |
MTTR, h | 32 | 35 | 36 | 14 | 13 | 24 | 19 | 25 | 5 | 14 |
Table 6Metrics values obtained from the company’s ERP system, between 2017 and 2018
Year | 2017 | 2018 | ||||||||
Metrics | 2540A | 2540B | 2540C | 2540D | 2540E | 2540A | 2540B | 2540C | 2540D | 2540E |
Run hours-Rh, h | 6132 | 7761 | 5992 | 8261 | 8296 | 5641 | 7481 | 5913 | 8147 | 8157 |
Number of failures-F, f | 137 | 57 | 94 | 27 | 41 | 139 | 59 | 126 | 36 | 42 |
MTBF, h | 64 | 153 | 93 | 324 | 214 | 63 | 148 | 70 | 243 | 208 |
MTTR, h | 19 | 18 | 29 | 18 | 11 | 22 | 22 | 23 | 17 | 10 |
Table 7Metrics values obtained from the company’s ERP system, between 2019 and 2020
Year | 2019 | 2020 | ||||||||
Metrics | 2540A | 2540B | 2540C | 2540D | 2540E | 2540A | 2540B | 2540C | 2540D | 2540E |
Run hours-Rh, h | 5755 | 7393 | 6053 | 8366 | 8103 | 5466 | 7761 | 6158 | 8357 | 8453 |
Number of failures-F, f | 134 | 50 | 118 | 26 | 31 | 133 | 61 | 90 | 38 | 32 |
MTBF, h | 65 | 175 | 74 | 337 | 282 | 66 | 144 | 97 | 231 | 274 |
MTTR, h | 22 | 27 | 23 | 15 | 21 | 25 | 16 | 29 | 11 | 10 |
Table 8Metrics values obtained from the company’s ERP system, between 2021 and 2022
Year | 2021 | 2022 | ||||||||
Metrics | 2540A | 2540B | 2540C | 2540D | 2540E | 2540A | 2540B | 2540C | 2540D | 2540E |
Run hours-Rh, h | 6342 | 7849 | 5948 | 8252 | 8156 | 5098 | 7753 | 5782 | 8059 | 8155 |
Number of failures-F, f | 135 | 60 | 99 | 34 | 41 | 139 | 63 | 103 | 35 | 43 |
MTBF, h | 65 | 146 | 88 | 258 | 214 | 63 | 139 | 85 | 250 | 204 |
MTTR, h | 18 | 15 | 28 | 15 | 15 | 26 | 16 | 29 | 20 | 14 |
Source: [29] | ||||||||||
To enhance the reliability of Units such as 2540A and 2540C, a comprehensive preventive maintenance schedule is essential. These machines require regular inspections, potential component upgrades, and adjusted maintenance timelines to prevent further degradation. Additionally, implementing predictive maintenance using machine data could help forecast failures for 2540C, mitigating the spikes in failures observed after 2018. For machines 2540D and 2540E, the current maintenance strategies are proving effective and should be continued. Conducting root cause analyses on machines with high failure rates, particularly 2540A, could help identify underlying issues contributing to frequent breakdowns. Finally, ensuring that spare parts are readily available for 2540A and 2540C could reduce MTTR and operational costs by expediting repairs. Addressing these key areas will enhance overall equipment reliability, minimize downtime, and improve operational efficiency.
3.4. Calculated DT, λ, A, and R data from obtained data (Rh, F, MTBF, and MTTR) between 2011 and 2022
Tables 9-14 shows calculated data of DT, , A, and R metrics for the GTUs from 2011 to 2022. It provides valuable insights into their operational performance and maintenance effectiveness. The data reveals significant variations in the performance of the GTUs over time, pinpointing areas requiring attention and opportunities for enhancement.
Table 9Calculated DT, λ, A, and R, between 2011 and 2022 for the GTUs
Year | 2011 | 2012 | ||||||||
Metrics | 2540A | 2540B | 2540C | 2540D | 2540E | 2540A | 2540B | 2540C | 2540D | 2540E |
Run hours-Rh, h | 5606 | 7306 | 5755 | 8059 | 8208 | 5361 | 7192 | 6211 | 8480 | 8436 |
Number of failures-F, f | 122 | 51 | 86 | 32 | 27 | 127 | 54 | 89 | 37 | 28 |
MTBF, h | 72 | 172 | 102 | 274 | 324 | 69 | 162 | 98 | 237 | 313 |
MTTR, h | 23 | 26 | 35 | 22 | 20 | 27 | 29 | 29 | 5 | 16 |
Downtime hours-DT, (8760–Rh)h | 3154 | 1454 | 3005 | 701 | 552 | 3399 | 1568 | 2,549 | 280 | 324 |
Failure rate-, (1÷MTBF)f/h | 0.0139 | 0.0058 | 0.0098 | 0.0036 | 0.0030 | 0.0145 | 0.0062 | 0.0102 | 0.0042 | 0.0032 |
Availability-A, (Rh÷8760)% | 64.0 | 83.4 | 65.7 | 92.0 | 93.7 | 61.2 | 82.1 | 70.9 | 96.8 | 96.3 |
Reliability-R, [1–(1–A)]% = A | 64.0 | 83.4 | 65.7 | 92.0 | 93.7 | 61.2 | 82.1 | 70.9 | 96.8 | 96.3 |
Table 10Calculated DT, λ, A, and R, between 2013 and 2014 for the GTUs
Year | 2013 | 2014 | ||||||||
Metrics | 2540A | 2540B | 2540C | 2540D | 2540E | 2540A | 2540B | 2540C | 2540D | 2540E |
Run hours-Rh, h | 5773 | 7665 | 5983 | 8410 | 8156 | 5370 | 7569 | 5860 | 8331 | 8296 |
Number of failures-F, f | 119 | 50 | 87 | 33 | 41 | 132 | 49 | 117 | 40 | 45 |
MTBF, h | 74 | 175 | 101 | 265 | 214 | 66 | 179 | 75 | 219 | 195 |
MTTR, h | 25 | 22 | 34 | 11 | 15 | 26 | 24 | 25 | 11 | 12 |
Downtime-DT, (8760–Rh)h | 2987 | 1095 | 2777 | 350 | 604 | 3390 | 1191 | 2900 | 429 | 464 |
Failure rate-, (1÷MTBF)f/h | 0.0135 | 0.0057 | 0,0099 | 0.0038 | 0.0047 | 0.0152 | 0.0056 | 0.0133 | 0.0046 | 0.0051 |
Availability-A, (Rh÷8760)% | 65.9 | 87.5 | 68.3 | 96.0 | 93.1 | 61.3 | 86.4 | 66.9 | 95.1 | 94.7 |
Reliability-R, [1–(1–A)]% = A | 65.9 | 87.5 | 68.3 | 96.0 | 93.1 | 61.3 | 86.4 | 66.9 | 95.1 | 94.7 |
Table 11Calculated DT, λ, A, and R, between 2015 and 2016 for the GTUs
Year | 2015 | 2016 | ||||||||
Metrics | 2540A | 2540B | 2540C | 2540D | 2540E | 2540A | 2540B | 2540C | 2540D | 2540E |
Run hours-Rh, h | 5738 | 6903 | 5887 | 8208 | 8392 | 5536 | 7788 | 5764 | 8559 | 8348 |
Number of failures-F, f | 130 | 53 | 79 | 39 | 29 | 132 | 52 | 121 | 43 | 30 |
Downtime hours-DT, (8760–Rh)h | 3022 | 1857 | 2873 | 552 | 368 | 3224 | 972 | 2996 | 201 | 412 |
MTBF, h | 67 | 165 | 111 | 225 | 302 | 66 | 168 | 72 | 204 | 292 |
MTTR, h | 32 | 35 | 36 | 14 | 13 | 24 | 19 | 25 | 5 | 14 |
Failure rate-, (1÷MTBF)f/h | 0.0149 | 0.0061 | 0.0090 | 0.0044 | 0.0033 | 0.0152 | 0.0060 | 0.0139 | 0.0049 | 0.0034 |
Availability-A, (Rh÷8760)% | 65.5 | 78.8 | 67.2 | 93.7 | 95.8 | 63.2 | 88.9 | 65.8 | 97.7 | 95.3 |
Reliability-R, [1- (1-A)]% = A | 65.5 | 78.8 | 67.2 | 93.7 | 95.8 | 63.2 | 88.9 | 65.8 | 97.7 | 95.3 |
Table 12Calculated DT, λ, A, and R, between 2017 and 2018 for the GTUs
Year | 2017 | 2018 | ||||||||
Metrics | 2540A | 2540B | 2540C | 2540D | 2540E | 2540A | 2540B | 2540C | 2540D | 2540E |
Run hours-Rh, h | 6132 | 7761 | 5992 | 8261 | 8296 | 5641 | 7481 | 5913 | 8147 | 8157 |
Number of failures-F, f | 137 | 57 | 94 | 27 | 41 | 139 | 59 | 126 | 36 | 42 |
MTBF, h | 64 | 153 | 93 | 324 | 214 | 63 | 148 | 70 | 243 | 208 |
MTTR, h | 19 | 18 | 29 | 18 | 11 | 22 | 22 | 23 | 17 | 10 |
Downtime hours-DT, (8760-Rh)h | 2628 | 999 | 2768 | 499 | 464 | 3119 | 1279 | 2847 | 613 | 603 |
Failure rate-, (1÷MTBF)f/h | 0.0156 | 0.0065 | 0.0108 | 0.0031 | 0.0047 | 0.0159 | 0.0068 | 0.0143 | 0.0041 | 0.0048 |
Availability-A, (Rh÷8760)% | 70.0 | 88.6 | 68.4 | 94.3 | 94.7 | 64.4 | 85.4 | 67.5 | 93.6 | 93.1 |
Reliability-R, [1–(1–A)]% = A | 70.0 | 88.6 | 68.4 | 94.3 | 94.7 | 64.4 | 85.4 | 67.5 | 93.6 | 93.1 |
Table 13Calculated DT, λ, A, and R, between 2019 and 2020 for the GTUs
Year | 2019 | 2020 | ||||||||
Metrics | 2540A | 2540B | 2540C | 2540D | 2540E | 2540A | 2540B | 2540C | 2540D | 2540E |
Run hours-Rh, h | 5755 | 7393 | 6053 | 8366 | 8103 | 5466 | 7761 | 6158 | 8357 | 8453 |
Number of failures-F, f | 134 | 50 | 118 | 26 | 31 | 133 | 61 | 90 | 38 | 32 |
MTBF, h | 65 | 175 | 74 | 337 | 282 | 66 | 144 | 97 | 231 | 274 |
MTTR, h | 22 | 27 | 23 | 15 | 21 | 25 | 16 | 29 | 11 | 10 |
Downtime-DT, (8760–Rh)h | 3005 | 1367 | 2705 | 394 | 657 | 3294 | 999 | 2602 | 403 | 307 |
Failure rate-, (1÷MTBF)f/h | 0.0154 | 0.0057 | 0.0135 | 0.0030 | 0.0035 | 0.0152 | 0.0069 | 0.0103 | 0.0043 | 0.0036 |
Availability-A, (Rh÷8760)% | 65.7 | 84.4 | 69.1 | 95.5 | 92.5 | 62.4 | 88.6 | 70.3 | 95.4 | 96.5 |
Reliability-R, [1–(1–A)]% = A | 65.7 | 84.4 | 69.1 | 95.5 | 92.5 | 62.4 | 88.6 | 70.3 | 95.4 | 96.5 |
Table 14Calculated DT, λ, A, and R, between 2021 and 2022 for the GTUs
Year | 2021 | 2022 | ||||||||
Metrics | 2540A | 2540B | 2540C | 2540D | 2540E | 2540A | 2540B | 2540C | 2540D | 2540E |
Run hours-Rh, h | 6342 | 7849 | 5948 | 8252 | 8156 | 5098 | 7753 | 5782 | 8059 | 8155 |
Number of failures-F, f | 135 | 60 | 99 | 34 | 41 | 139 | 63 | 103 | 35 | 43 |
MTBF, h | 65 | 146 | 88 | 258 | 214 | 63 | 139 | 85 | 250 | 204 |
MTTR, h | 18 | 15 | 28 | 15 | 15 | 26 | 16 | 29 | 20 | 14 |
Downtime hours-DT, (8760-Rh)h | 2418 | 911 | 2812 | 508 | 604 | 3662 | 1007 | 2980 | 701 | 605 |
Failure rate-, (1÷MTBF)f/h | 0.0154 | 0.0068 | 0.0114 | 0.0038 | 0.0047 | 0.0159 | 0.0072 | 0.0118 | 0.0040 | 0.0049 |
Availability-A, (Rh÷8760)% | 72.4 | 89.6 | 67.9 | 94.2 | 93.1 | 58.2 | 88.5 | 66.0 | 92.0 | 93.1 |
Reliability-R, [1–(1–A)]% = A | 72.4 | 89.6 | 67.9 | 94.2 | 93.1 | 58.2 | 88.5 | 66.0 | 92.0 | 93.1 |
Downtime hours, representing hours when the GTUs were non-operational, highlights that units 2540A and 2540C consistently experienced high downtime, particularly in recent years. For example, in 2022, unit 2540A recorded 3662 hours of downtime, indicating potential issues with maintenance strategies or component reliability. Conversely, units like 2540D and 2540E demonstrated lower downtime, indicative of better operational continuity and potentially more effective maintenance approaches. Addressing the high downtime for units with elevated DT values should be prioritized to enhance overall plant efficiency and reliability. The reveals how frequently failures occurred relative to operational hours. GTUs such as 2540A exhibited higher failure rates over the years, peaking at 0.0159 failures per hour in 2022. This heightened frequency of failures indicates current maintenance practices may not adequately address underlying issues, possibly due to insufficient preventive maintenance or component deterioration. In contrast, units like 2540D and 2540E demonstrated lower failure rates, suggesting it adheres to more maintenance recommendations or possesses more robust components less susceptible to failure. Availability indicates the percentage of time the GTUs were operational and ready for power production. Units 2540D and 2540E consistently achieved high availability levels, often surpassing 90 %, signaling minimal downtime and high reliability.
Conversely, unit 2540A experienced a notable decrease in availability, dropping to as low as 58.2 % in 2022. This decline underscores the necessity for enhanced maintenance planning and execution to ensure optimal operational performance for such units. Reliability, essentially synonymous with availability in this context, demonstrates a comparable pattern. Units 2540D and 2540E sustained high-reliability ratings, indicating consistent performance and low failure rates. Nevertheless, units like 2540A, with a reliability decrease to 58.2 % in 2022, emphasize the impact of frequent failures and extended downtimes. Enhancing the reliability of these units will necessitate a concentrated focus on preventive and corrective maintenance strategies.
To enhance the performance and reliability of the GTUs, Firstly, the adoption of advanced predictive maintenance techniques can aid in predicting failures in advance, thereby minimizing unexpected downtimes. For units like 2540A and 2540C with notable high failure rates, developing predictive models to monitor critical components’ health and schedule maintenance proactively could be beneficial. Secondly, targeted replacement of components should be considered for units exhibiting persistently high failure rates. Upgrading or replacing critical components prone to frequent breakdowns can significantly reduce failure rates, enhancing availability and reliability. Moreover, optimizing maintenance schedules to minimize the impact on operational hours, particularly focusing on reducing MTTR to shorten downtime, is crucial. Conducting a thorough root cause analysis for units facing frequent failures and low reliability, such as 2540A and 2540C, is essential. Understanding the underlying causes will enable the implementation of effective solutions addressing core issues rather than surface-level symptoms. Lastly, ensuring well-trained and adequately equipped maintenance personnel is vital for efficient task performance. Providing access to the necessary tools and resources for timely maintenance execution, along with regular training and appropriate resource allocation, can contribute to reduced repair times and enhanced overall maintenance efficiency.
3.5. Summary table (units, recommended inspection, adherence history, and metrics averages)
Table 15 shows how the GTUs 2540D and 2540E consistently stand out in their average reliability percentages, each achieving an impressive 94 %, which indicates a commendable readiness for operation. The MTTR metric sheds light on maintenance effectiveness, revealing that 2540D and 2540E exhibit exceptional performance with remarkably low average values of 175 and 171 hours, respectively. These low values suggest quick recovery times and efficient maintenance procedures. In terms of robustness, the MTBF metric shows significant values of 3067 and 3034 hours for 2540D and 2540E, respectively, indicating extended periods of fault-free operation.
Conversely, 2540A and 2540C record the highest MTTR values, at 290 and 345 hours, respectively. High MTTR values are associated with low reliability, as well as increased downtime. This data suggests that these units experience longer downtimes and reduced reliability. Furthermore, 2540A and 2540C also have the lowest MTBF values of 800 and 1077 hours, respectively. Low MTBF is linked to a higher failure rate and more frequent breakdowns; thus, a relationship is evident between these two metrics. Both 2540A and 2540C, which have the lowest MTBFs, also exhibit the highest MTTR values. The low MTBF figures correlate with high failure rates, extended downtime, and reduced reliability, as indicated by their reliability percentages of 65 % and 68 %, respectively. The units’ lack of adherence to OEM maintenance recommendations aligns with their lower reliability percentages; notably, 2540C and 2540A, with the lowest MTBFs, also show the least compliance with these recommendations. This suggests that neglecting proper maintenance procedures and best practices, despite OEM advice, contributes to higher failure rates and diminished reliability.
Table 15Units, recommended inspection, adherence history, and metrics averages (summary table)
GT Units | BI | CI | HGPI | MI | (%) | (h) | (h) | (h) | (f) | (h) | (f/h) | ||||
Rec. | Act | Rec. | Act. | Rec. | Act. | Rec. | Act. | ||||||||
2540A | 13 | 2 | 13 | 2 | 4 | 1 | 2 | 0 | 65 | 67818 | 290 | 800 | 1579 | 37302 | 0.1822 |
2540B | 13 | 6 | 13 | 6 | 4 | 3 | 2 | 0 | 86 | 88739 | 197 | 1923 | 656 | 14699 | 0.0745 |
2540C | 13 | 4 | 13 | 4 | 4 | 2 | 2 | 0 | 68 | 71289 | 345 | 1077 | 1215 | 33814 | 0.1396 |
2540D | 13 | 7 | 13 | 7 | 4 | 3 | 2 | 1 | 94 | 99469 | 175 | 3067 | 420 | 5,631 | 0.0488 |
2540E | 13 | 7 | 13 | 7 | 4 | 3 | 2 | 1 | 94 | 99156 | 171 | 3034 | 412 | 5,964 | 0.0480 |
3.6. Examination of variations in inspection adherence and its effect on reliability
3.6.1. Reliability versus CI = BI
Fig. 4 shows a chart comparing reliability values and CIs. It demonstrates the impact of the number of combustion inspections conducted on five gas turbine units (2540A to 2540E) and their respective reliability percentages. While it is advised that all units undergo 13 inspections, the actual inspection counts vary, influencing overall reliability outcomes. The bars and line projections illustrate the variances.
Fig. 4Combustion inspection adherence
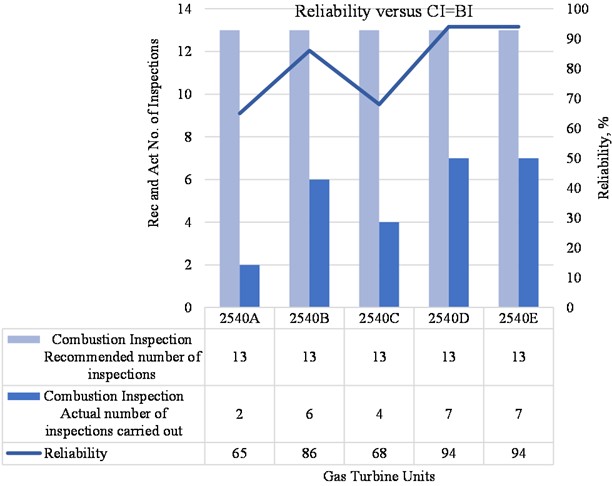
Only 2 CI inspections were conducted in Unit 2540A, well below the recommended amount, resulting in a low reliability of 65 %. This substantial deviation from the recommended inspections had a negative effect on the unit's performance. Unit 2540B completed 6 inspections, leading to a higher reliability of 86 %, showcasing that even partial compliance can maintain relatively good reliability. Unit 2540C, with 4 inspections, displayed a reliability of 68 %, indicating that fewer inspections can result in decreased reliability. Units 2540D and 2540E, both with 7 inspections, achieved the highest reliability of 94 %, emphasizing that exceeding half of the recommended inspections significantly boosts performance.
Considering these findings, several recommendations can be proposed. Units with lower reliability, such as 2540A and 2540C, should increase their inspection frequency to at least 7 or more, to enhance their reliability. The current inadequate inspection numbers likely contribute to operational inefficiencies and increased failure rates. Encouraging full compliance with the recommended 13 inspections is advisable, as units closer to this target, like 2540D and 2540E, demonstrated notably higher reliability. Furthermore, implementing predictive maintenance could optimize inspection schedules by prioritizing units needing attention, ensuring greater reliability without strictly adhering to OEM guidelines. In summary, elevating inspection frequency, especially for underperforming units, and striving for closer adherence to the recommended schedule will elevate reliability levels and decrease the likelihood of failures.
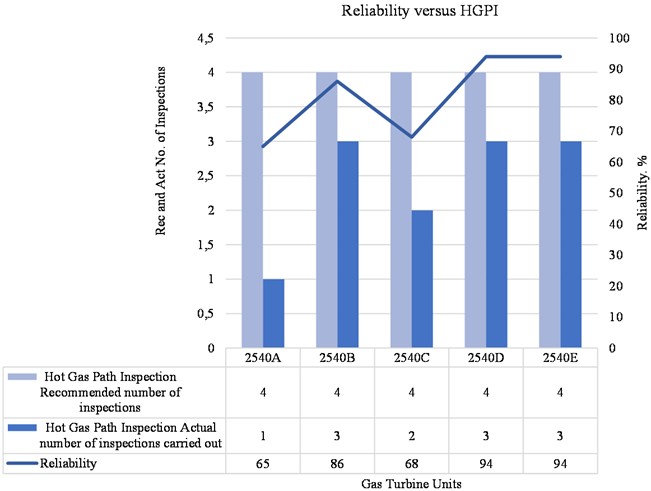
3.6.2. Reliability versus HGPI
Fig. 5 displays a chart that illustrates the relationship between the number of hot HGPI recommended and the number conducted for the five gas turbine units (2540A to 2540E), and how this adherence to inspection schedules influences the reliability of each unit. Across all units, as shown in the bar heights, the recommended number of hot gas path inspections remains constant at 4, represented by the gray bars in the chart. Discrepancies arise in the actual number of inspections performed, depicted by the light blue bars, leading to varying levels of reliability among the units. Unit 2540A only completed 1 out of the prescribed 4 inspections, resulting in a reliability percentage of 65 %. Similarly, two inspections were conducted in unit 2540C out of the recommended 4, yielding a reliability rating of 68 %. In contrast, units 2540B, 2540D, and 2540E adhered more closely to the recommended inspection frequency, completing 3 out of 4 inspections. This higher compliance correlates with improved reliability scores, with 2540B achieving 86 % and both 2540D and 2540E reaching 94 % reliability.
Fig. 5Hot gas path inspection adherence
The data underscores a clear association: a higher frequency of HGPI corresponds with heightened reliability. Units that closely follow the recommended inspection schedule demonstrate improved operational reliability. To enhance the reliability of the gas turbine units, it is essential to ensure alignment between the actual number of inspections and the recommended frequency. Units such as 2540A and 2540C, which exhibit lower reliability due to fewer inspections, would likely benefit from completing the recommended 4 inspections to enhance performance and prolong operational lifespan.
Addressing the disparity between recommended and actual inspections calls for implementing a robust inspection scheduling system to ensure compliance with the required number of inspections within specified intervals. Monitoring and evaluating maintenance practices can help identify and rectify any inefficiencies in inspection processes, ultimately improving compliance rates. Adopting predictive maintenance strategies that leverage real-time monitoring and data analysis can aid in anticipating when inspections are due based on equipment conditions. This approach reduces the risk of missed inspections and contributes to enhancing equipment reliability, thereby minimizing downtime and boosting operational efficiency. In conclusion, prioritizing compliance with recommended inspection frequencies is vital for maintaining high reliability across gas turbine units. By implementing improved scheduling, monitoring practices, and predictive maintenance measures, operational performance can be optimized to mitigate downtime risks and enhance overall efficiency.
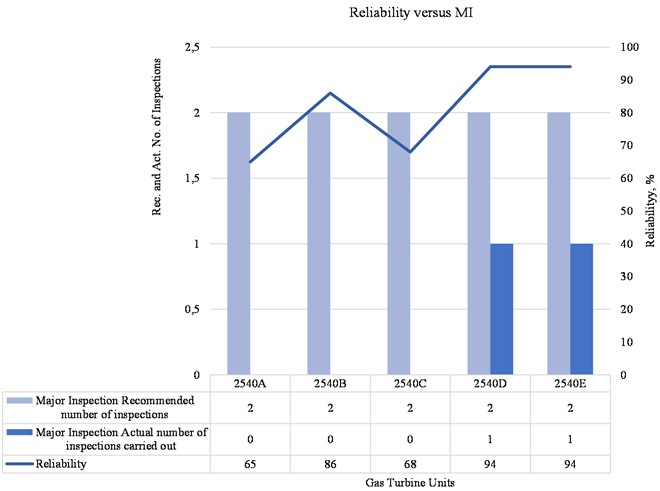
3.6.3. Reliability versus MI
Fig. 6 displays the data and chart on MI carried out within the study evaluation period, it reveals a significant discrepancy between the recommended and actual number of inspections carried out for GTUs 2540A to 2540E. For units 2540A, 2540B, and 2540C, no MI was performed despite the recommendation for two inspections. Meanwhile, units 2540D and 2540E had only one inspection completed out of the recommended two. These scenarios are illustrated with the grey and blue bars as well as the line projections in the chart. This underperformance in inspection activities raises concerns about equipment reliability and the effectiveness of maintenance management processes.
Fig. 6Major inspection adherence
The failure to conduct the necessary inspections poses potential risks to equipment reliability and operational safety. Inspections play a critical role in identifying early signs of wear, damage, or possible failures. Without timely inspections, there is a higher probability of unexpected breakdowns, which could lead to costly downtime and safety hazards. The gap between recommended and actual inspections increases the likelihood of equipment failures, directly impacting operational reliability. Moreover, this discrepancy points to potential inefficiencies in the maintenance scheduling or resource allocation processes. It suggests possible challenges such as insufficient manpower, conflicting maintenance priorities, or a lack of emphasis on proactive maintenance strategies. Addressing these issues is essential to improving maintenance effectiveness and ensuring that equipment operates reliably. To mitigate these risks, it is recommended that the maintenance scheduling and resource allocation strategy be revisited. First, the inspection frequency should be re-evaluated to ensure it aligns with the criticality of the equipment and operational needs. This would help mitigate potential risks associated with under-maintained equipment. Next, measures should be implemented to improve monitoring and compliance with inspection schedules. This may include the use of enhanced tracking systems or introducing incentives to encourage adherence to the schedule. Lastly, optimizing maintenance planning processes will be crucial in prioritizing critical inspections and ensuring resources are allocated more effectively.
3.7. Results of MatLab reliability evaluation
Fig. 7 shows that high reliability can be attained with appropriate maintenance and application of manufacturer guidelines, the GTUs 2540A, 2540B, 2540C, 2549D, and 2540E reliability data from 2011 to 2022 offer important insights into these units’ performance trends during this study’s evaluation period. Reliability for Unit 2540A varied over time, peaking at 72.4 % in 2021 after beginning at 64 % in 2011 and then falling to 58.2 % in 2022, this points to some variation in the performance of the unit, more research may be necessary to determine the causes of these variations, the observed changes may have been caused by elements like components failure that may have been orchestrated by ineffective maintenance practices.
Fig. 7Reliability of gas turbine units
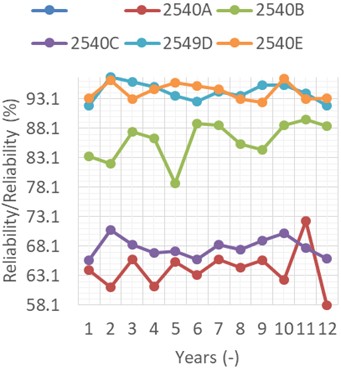
Conversely, during that time, Unit 2540B showed a generally high degree of reliability, it began with a reliability of 83.4 % in 2011 and has continuously performed well, peaking at 88.6 % in 2021 and only marginally declining to 88.5 % in 2022, the reliable operation of this unit may be ascribed to efficient maintenance techniques and good GT operation. Unit 2540C began at 65.7 % in 2011 and fluctuated throughout the following years, reaching 66 % in 2022, in comparison to Unit 2540A, the comparatively little variance indicates a more stable performance, nonetheless, it is worthwhile to look into the causes of the reliability variations as comprehending these trends may point to possible places for enhancement or optimization. High reliability was continuously demonstrated by Unit 2540D, which maintained a 92 % reliability rate through 2022, this unit has consistently performed well, which may be related to appreciable adherence to maintenance suggestions that gave rise to reduced downtime. The reliability of Unit 2540E was remarkably consistent, sustaining a level of 93.2 % in 2011 and 2022, the unit has demonstrated high adherence to maintenance guidelines, as evidenced by the slight fluctuations recorded, and high adherence to OEM maintenance recommendation, which suggest that it has proven resistive to external variables that may impact reliability.
Based on the reliability data analysis, Units 2540B were found to have exhibited fair to good reliability during the period under study, although Units 2540A and 2540C showed slight fluctuations and low-reliability values. With very slight fluctuations, Units 2540D and 2540E stayed high, it may be possible to improve the performance of these GTUs by probing into the precise variables impacting reliability variations, therefore, it stands to reason that differential GTUs will operate more reliably if they receive regular and appropriate maintenance.
3.8. Reliability improvement strategies
On a general note, to enhance the reliability of Units 2540A and 2540C, which exhibit low reliability levels, a comprehensive and strategic approach is essential. The following detailed strategies can be implemented to effectively improve the reliability of these units:
Enhance compliance with OEM maintenance schedules: To address deviations from OEM-prescribed maintenance schedules, all recommended inspections – such as CIs, HGPIs, and MIs – must be conducted at specified intervals. Establishing a robust tracking system and assigning dedicated personnel to monitor and document adherence will be crucial for ensuring compliance.
Implement predictive maintenance strategies: Anticipating breakdowns through real-time monitoring of critical parameters like vibration and temperature can significantly reduce unexpected failures. Implementing predictive maintenance strategies, powered by machine learning models, can enable proactive interventions based on equipment condition rather than fixed intervals, thus minimizing disruptions and enhancing reliability.
Increase inspection frequency and quality: Elevating the frequency of inspections, particularly focusing on high-priority areas like HGPIs is essential for addressing wear and tear issues.
Replace or upgrade worn components: A thorough assessment of component wear is necessary to identify and replace degraded components with upgraded versions for improved reliability. Maintaining a stock of critical spare parts can also expedite repairs and reduce downtime.
Optimize maintenance planning: Streamlining maintenance processes, such as component-based repairs and adopting shift-based maintenance teams can reduce repair times and ensure round-the-clock repair availability, thus minimizing downtime and enhancing reliability.
Conduct root cause analysis (RCA): Identifying and addressing root causes of frequent failures through a comprehensive RCA will help uncover underlying systemic issues that contribute to reliability challenges. Targeted improvements can then be made to prevent recurring failures.
Enhance workforce training and resource allocation: Providing specialized training on OEM guidelines, predictive maintenance tools, and advanced diagnostics to maintenance staff will enhance their capabilities. Access to necessary tools, resources, and spare parts will further optimize maintenance execution.
Introduce performance metrics and feedback loops: Tracking reliability metrics like MTBF and MTTR can help assess the effectiveness of improvement efforts. Setting improvement targets and refining maintenance practices based on metric analysis will drive continuous improvement.
Leverage data analytics for insights: Analyzing historical data on failures and repairs can provide valuable insights into failure patterns. These insights can inform customized maintenance schedules and prioritize critical components for inspection, ultimately contributing to enhanced reliability.
Enhance inspection adherence through incentives: By implementing incentives for maintenance teams that reward them for following inspection schedules and making reliability improvements, and by conducting regular audits to ensure accountability, can encourage greater compliance and diligence in adhering to maintenance recommendations.
By proactively implementing these strategies, Units 2540A and 2540C can significantly reduce failure rates, improve uptime, and raise their overall reliability performance to align with more reliable units like 2540D and 2540E.
4. Conclusions
To ensure the reliability of gas turbine units, it is essential to adhere to the maintenance schedules recommended by the OEM. This study investigated the consequences of neglecting these recommendations. The research focused on five GE MS 5001 GTUs (2540 A-E), located at an oil and gas production facility in Nigeria, utilizing twelve years of operational data. The study had the following objectives: to review the OEM maintenance recommendations specific to the power plants, to identify deviations from these plans, and to assess the impact of non-compliance with OEM guidelines on reliability metrics.
The research successfully met its objectives as it identified the four OEM-recommended scheduled inspections (BI, CI, HGPI and MI), it further assessed how the five GTUs adhered to these maintenance plans. The analysis revealed a correlation between maintenance adherence and reliability. Units 2540D and 2540E, which closely followed OEM recommendations demonstrated high reliability and performance with extended MTBF. In contrast, Units 2540A and 2540C, which deviated significantly from the recommended maintenance schedules experienced lower reliability and shorter MTBF, highlighting the need for improved maintenance practices. Unit 2540B showed fair to good reliability.
The high reliability observed in Units 2540D and 2540E, due to strict adherence to OEM maintenance schedules aligns with findings from [3] and [4], which emphasize the importance of OEM-recommended procedures like inspections and overhauls in minimizing downtime and optimizing performance. Conversely, the lower reliability and MTBFs in Units 2540A and 2540C highlight the negative impact of non-adherence, as supported by [5], which discusses the trade-offs businesses face when prioritizing cost savings over OEM standards. However, [7] and [8] note that OEM recommendations may not suffice in challenging environments or for modified equipment, necessitating tailored strategies. Additionally, findings resonate with [9] and [10], emphasizing the importance of balancing maintenance intervals to maximize component life and reduce repair costs. While adhering to OEM guidelines is crucial, as [12] suggests, a customized, risk-based approach can address specific operational challenges, enhancing reliability and efficiency in gas turbine maintenance.
The study highlights the critical importance of adhering to OEM maintenance schedules and conducting regular inspections to ensure consistent performance of gas turbines and optimize energy generation efficiency. It underscores the need to monitor adherence rates and implement corrective measures to enhance maintenance, reliability, and operational efficiency. The findings reveal a strong correlation between reliability metrics and deviations from OEM guidelines, demonstrating the adverse effects of neglecting these recommendations. The study advocates reassessing maintenance scheduling, improving resource allocation, and optimizing inspection frequencies based on equipment criticality to mitigate risks. By offering key insights and actionable recommendations, this research underscores the pivotal role of OEM compliance in achieving reliable and efficient operations in gas turbine power plants.
References
-
“What is a gas turbine, and how does it work?” Ge Vernova, 2023, https://www.ge.com/gas-power/resources/education/what-is-a-gas-turbine
-
A. Rastegari and A. Salonen, “Strategic maintenance management: Formulating maintenance strategy,” International Journal of COMADEM, Vol. 18, No. 1, pp. 5–14, 2015.
-
B. Zafar. “Effective maintenance strategy is key to success for maintenance optimization programs.” EMERSON, 2018, https://www.emerson.com/documents/automation/effective-maintenance-strategy-key-to-success-for-maintenance-optimization-programs-en-5259588.pdf
-
P. Gackowiec, “General overview of maintenance strategies – concepts and approaches,” Multidisciplinary Aspects of Production Engineering, Vol. 2, No. 1, pp. 126–139, Sep. 2019, https://doi.org/10.2478/mape-2019-0013
-
“OEM maintenance vs. third-party maintenance: Pros and cons of both.” GES, 2023, https://gesrepair.com/oem-maintenance-vs-third-party-maintenance-pros-and-cons-of-both/
-
T. G. Barbaccia. “Recognizing the importance of OEM guidelines, resources, and education,” 2018, https://www.fenderbender.com/running-a-shop/operations/article/33029156/understanding-the-importance-of-oem-procedures-resources-and-training
-
“When are OEM recommendations not enough?.” ReliablePlant, 2023, https://www.reliableplant.com/read/28611/oem-recommendations-enough
-
“Should I use OEM maintenance tasks? A guide to OEM recommendations.” Modla, 2023, https://www.modla.co/blog/oem-task-recommendations
-
N. Armstrong. “Why don’t OEM recommendations work for maintenance?,” 2020, https://cagents.com/why-dont-oem-recommendations-work-for-maintenance
-
A. D. Williams, “Gas turbine maintenance, refurbishment and repair,” in Power Plant Life Management and Performance Improvement, Elsevier, 2011, pp. 420–449, https://doi.org/10.1533/9780857093806.3.420
-
F. Rahman, S. Sugiono, S. As’Ad, and O. Novareza, “Optimization maintenance performance level through collaboration of overall equipment effectiveness and machine reliability,” Journal of Applied Engineering Science, Vol. 20, No. 3, pp. 917–936, Jan. 2022, https://doi.org/10.5937/jaes0-35189
-
R. Gulati, Maintenance and Reliability Best Practice. New York, NY, USA: Industrial Press, 2013.
-
Emerson. “Turbine tips for all models of legacy GE gas turbines.” Emerson, 2024, https://www.ccj-online.com/turbine-tips-for-all-models-of-legacy-ge-gas-turbines
-
D. E. Brandt and R. R. Wesorick, “GE gas turbine design philosophy,” GER-3434, General Electric, 1994.
-
P. C. Daiber, “Performance and reliability improvements for the MS5001 gas turbines,” GE Power Systems, Atlanta, 1996.
-
F. J. Brooks, “GE gas turbine performance characteristics,” GE Power Systems, Schenectady, NY, 2000.
-
P. Bonfante, “Maintenance,” Nuovo Pignone, 2004.
-
Ge Energy. “Gas turbines.” GE Energy, 2005, https://www.flexenergy.com/turbine-innovations
-
M. Molęda, B. Małysiak-Mrozek, W. Ding, V. Sunderam, and D. Mrozek, “From corrective to predictive maintenance-a review of maintenance approaches for the power industry,” Sensors, Vol. 23, No. 13, p. 5970, Jun. 2023, https://doi.org/10.3390/s23135970
-
F. Zohra Berrabah, C. Belkacemic, and L. Zemmouchi-Ghomari, “Essential and new maintenance KPIs explained,” International Journal of Education and Management Engineering, Vol. 12, No. 6, pp. 11–20, Dec. 2022, https://doi.org/10.5815/ijeme.2022.06.02
-
L. Sukarma and H. Azmi, “The measures of performance for world class manufacturing practices: a critical review,” Applied Mechanics and Materials, Vol. 761, pp. 545–549, May 2015, https://doi.org/10.4028/www.scientific.net/amm.761.545
-
J. T. Selvik and E. P. Ford, “Down time terms and information used for assessment of equipment reliability and maintenance performance,” in System Reliability, InTech, 2017, pp. 43–66, https://doi.org/10.5772/intechopen.71503.
-
M. Bevilacqua, F. Ciarapica, G. Giacchetta, and B. Marchetti, “Evaluation of MTBF and MTTR trends for a selected equipment in an oil refinery,” in 18th ISSAT International Conference on Reliability and Quality in Design, pp. 253–257, 2012.
-
Ahiamadu Jonathan Okirie, “Impact of reliability variations on overall power station performance,” International Journal of Scientific Research and Engineering Development, Vol. 7, No. 2, pp. 1024–1030, Aug. 2024, https://doi.org/10.5281/zenodo.13164105
-
Y. Ren, “Optimizing predictive maintenance with machine learning for reliability improvement,” ASCE-ASME Journal of Risk and Uncertainty in Engineering Systems, Part B: Mechanical Engineering, Vol. 7, No. 3, p. 03080, Sep. 2021, https://doi.org/10.1115/1.4049525
-
D. Olwell, “Reliability modeling, prediction, and optimization,” Technometrics, Vol. 43, No. 4, pp. 486–487, Nov. 2011, https://doi.org/10.1198/tech.2001.s42
-
M. Shahin, F. F. Chen, A. Hosseinzadeh, and N. Zand, “Using machine learning and deep learning algorithms for downtime minimization in manufacturing systems: an early failure detection diagnostic service,” The International Journal of Advanced Manufacturing Technology, Vol. 128, No. 9-10, pp. 3857–3883, Aug. 2023, https://doi.org/10.1007/s00170-023-12020-w
-
“Inspection and maintenance instructions for MS-5001 gas turbines models N, P, and R.” GE Industrial and Power Systems, 1993, https://www.manualslib.com/manual/57984/ge-gas-turbine.html
-
A. J. Okirie, E. G. Saturday, M. I. Gift., and D. Ewe, Acquisition of Reliability and Availability Metrics Data, 2024.
About this article

The authors have not disclosed any funding.
The datasets generated during and/or analyzed during the current study are available from the corresponding author on reasonable request.
Ahiamadu Jonathan Okirie: conceptualization, methodology, writing original draft, data curation, and formal data analysis. Ebigenibo Genuine Saturday: supervision, review, validation. Mathew Izuchukwu Gift: software, formal data analysis. Dickens Ewe: visualization, investigation, review.
The authors declare that they have no conflict of interest.
