Abstract
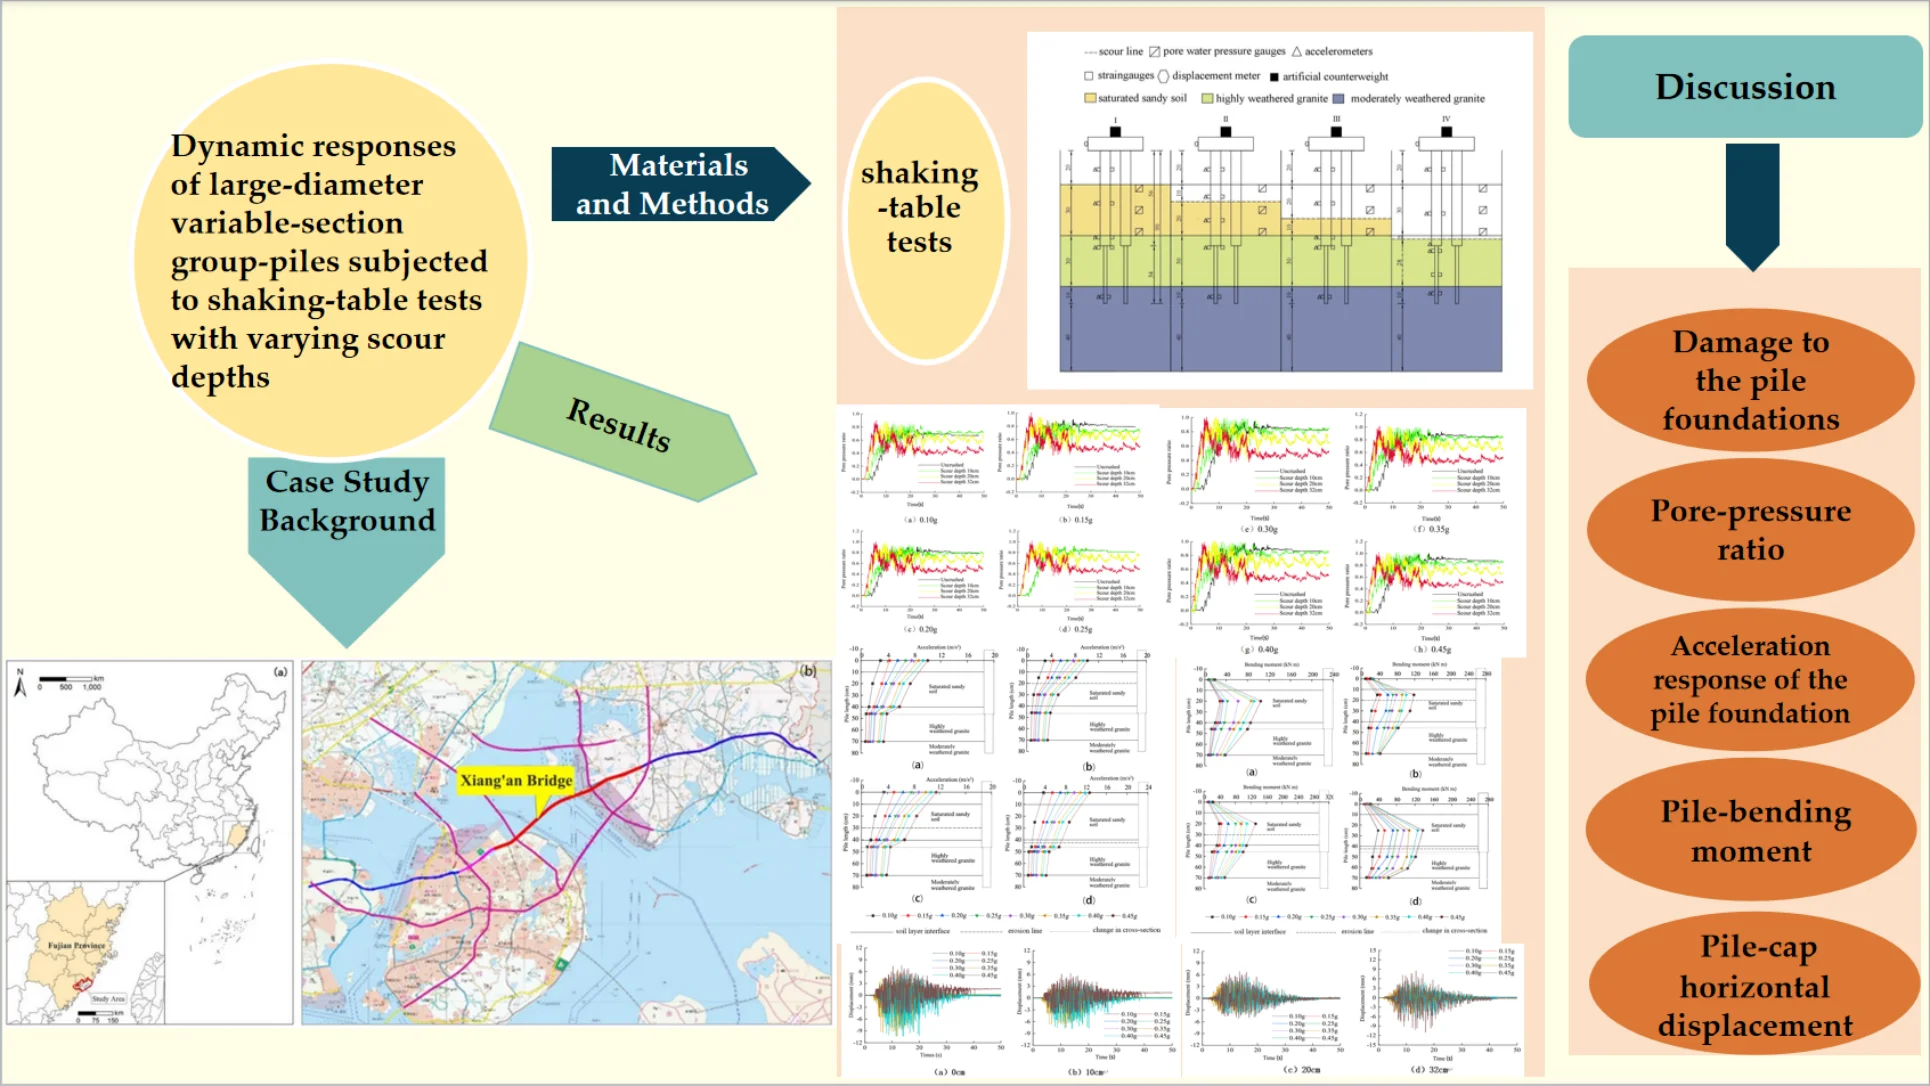
Scouring leads to soil loss around piles, which, in turn, changes the ground-vibration characteristics and influences the seismic performance of bridges. In this study, the Xiang’an Bridge was used as a reference for constructing a large shaking-table test model to investigate the dynamic characteristics of the pore-pressure ratio of saturated sandy soils, accelerations, and bending moments of the piles, as well as the horizontal displacements of the pile-top at scouring depths of 10, 20, and 32 cm, with ground-vibration intensities ranging from 0.10-0.45 g. The results indicated that as the scour depth increased, the pile acceleration of the group piles increased and changed abruptly at the variable cross-section and soil-stratum interface. The peak values of the horizontal displacement of the pile-top and bending moment of the pile exhibited an increasing trend. As the ground-shaking intensity increased, the pore-pressure ratio of the saturated sandy soil, pile acceleration of the group piles, horizontal displacement of the pile-top, and bending moment of the pile body gradually increased, whereas the base frequency of the pile foundation gradually decreased. This study can serve as a reference for the seismic design and reinforcement of scour bridges in areas prone to seismic activity.
Highlights
- Shake table tests conducted to analyze dynamic responses to seismic waves.
- Scaled models of Xiang'an Bridge pile foundations used for tests.
- Scour depths and ground motions varied across 1,004 seismic events.
- Insights guide seismic design of scour-prone bridge foundations to improve resilience.
- Scour sensitivity at section changes & soil-granite interface identified.
1. Introduction
Large-diameter variable-section long piles are advantageous for the construction of bridges in marine environments because of their large bearing capacity in the vertical direction and impact resistance in the horizontal direction. As such piles require fewer engineering materials, the associated engineering costs are relatively low [1-3]. Group-pile foundations generally extend from the sea level to submarine soil and are therefore, the closest bridge elements to the ocean [4]. Large-diameter variable-section pile foundations constructed at sea change the original seawater-flow characteristics around the pile and influence the water currents, sediments, and topography of the ocean environment [5]. Additionally, they cause local scouring of the seabed around the pile foundation [6], [7], thereby reducing its bearing capacity and making it susceptible to earthquake damage [8-10]. Therefore, studying the seismic performance of bridge pier piles subjected to scour-depth changes is critical [11], [12].
Most researchers have focused on the dynamic responses of pile foundations with equal cross-sections and single piles through theory, model tests, and numerical simulations. In monopile foundation research, Lin et al. [13], Xu et al. [14], Zhang et al. [15], and Liang et al. [16] used the p-y method to investigate the effects of stress history, scour depth, scour width, and scour hole size on the transversely loaded monopiles within soil layers. Zhao et al. [17], Song et al. [18], and Sui et al. [19] used Biot’s consolidation theory to establish a comprehensive 3D numerical model of the wave-seabed response around a monopile foundation and investigated the damage induced in the foundation by the cumulative liquefaction of pore-water pressure under cyclic shear. Negru et al. [20] and Xiao [21], [22] proposed vibration-based nondestructive evaluation methods for bridge piers. Zhou et al. [23], Wang et al. [24], and Guo et al. [25] considered the pile–soil interactions, as well as the structural and geotechnical parameter uncertainties, and simulated seismic ground shaking using the OpenSees software to establish a coupled soil-structure finite-element model of a concrete bridge with a monopile structure. They concluded that scouring significantly increases the basic period of the structure, decreases the curvature of the pile body, and increases the functionality during seismic action under three different scour conditions. Chenxi et al. [26] and Basha [27] conducted flow-powder base-monopile interaction flume tests under different soil and water-flow conditions to investigate the effects of the consolidation strength and water content of monopiles in a pulverized seabed on the scour depth and the shape and size of the scour crater. Prendergast et al. [28], Wu et al. [29], and Gong et al. [30] conducted full-scale field tests to investigate the effects of scouring on the vibration characteristics of monopiles. They demonstrated that the intrinsic frequency of the pile decreased significantly as the scour severity increased, which enabled accurate predictions of the intrinsic frequency of the pile at a given scour depth.
For studying equal-section pile foundations, Zhang et al. [31], Zhou and Wang [32], Wu et al. [33], and Deng et al. [34] applied the Euler-Bernoulli beam theory to establish the equation of pile-soil control under arbitrary harmonic action and determined the dynamic responses of equal-section pile groups using the dynamic pile-soil interaction factor. Sun et al. [17] established a theoretical formula for predicting the maximum scour depth of equal-section piles based on energy balance. Their calculation results were in good agreement with the laboratory and field-measured data. Janalizadeh and Zahmatkesh [35], Rahmani and Pak [36], Prasad and Banerjee [37], Zhou et al. [38], and Wang et al. [39] developed a probabilistic seismic-demand model for equal-section sandy-soil group-pile bridges by combining scour-depth variations. Moreover, they investigated a probabilistic seismic-demand model for soil stratification, motion, and soil-layer movement at different scour depths, seismic-wave frequencies, and densities. Furthermore, the soil-stratification degree, kinematic and inertial forces affecting seismic demand, and potential pile-damage distribution of group-pile bridges were verified through shaking table tests. Wang et al. [40], Wang et al. [41], Liang et al. [42], and Bao et al. [43] conducted several shaking table tests against white noise and harmonic and historical seismic excitations on an isotropic reinforced-concrete mono-pier structure embedded in cohesionless soil with 2×2 pile groups. They found that the resonance period of the soil–pile structural system generally increased as the scour depth and excitation intensity increased.
Subsequently, based on the results of the aforementioned studies, several experts and scholars have further investigated the dynamic responses of pile foundations comprising long piles with large diameters and variable cross-sections through finite-element methods such as the equivalent embedment model of pile foundation [14], site-structure model based on the p-y curve [44], and 2D site-foundation-structure integration model [45]. However, it is difficult to accurately simulate the effects of various factors through these methods. Liang et al. [46] used centrifugal shaking table tests to study the seismic responses of structural bridges with monopile and group-pile foundations. However, these studies only investigated the pile-column foundations or employed specimens made of aluminum alloys. However, reinforced-concrete structures and group-pile foundations differ significantly.
In summary, shaking table tests for pile-soil dynamic interactions were established, and 1004 waves with ground-vibration intensities of 0.10, 0.15, 0.20, 0.25, 0.30, 0.35, 0.40, and 0.45 g were selected, and four working conditions with scour depths of 0, 10, 20, and 32 cm were designed to study the dynamic mechanical-response characteristics such as saturated sandy soil pore-pressure ratio, pile-body acceleration, pile-body bending moment, and pile-top horizontal displacement. They can also be used to verify the numerical-simulation method in the later stage and provide a basis for the reasonable value of the parameters. Therefore, the remainder of this paper is organized as follows. Section 2 describes the case-study area, proposed methods, and experimental details. Section 3 presents the results and discusses them. Finally, Section 4 concludes the paper and presents directions for future research.
2. Materials and methods
2.1. Case-study background
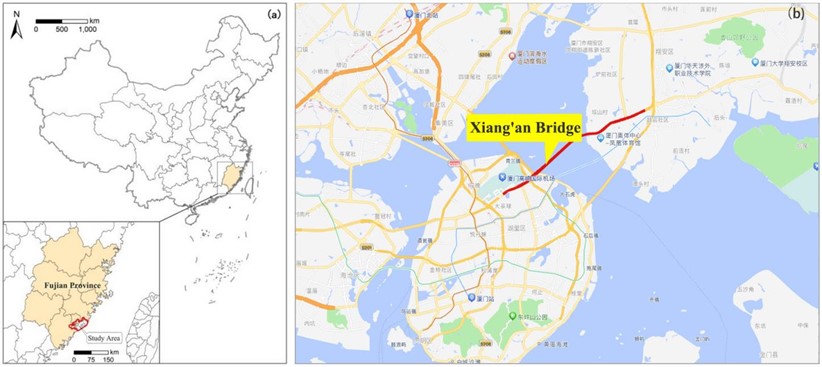
The Xiang’an Bridge is located in the mid-section of the Changle-Zhao’an fault zone, which is characterized by two near-northeast-oriented deep grooves in highly weathered bedrocks. Seismic activity is frequent in this region because of the influence of nearby active faults. From July 1974 to July 2024, 29 earthquakes occurred in this region, with the worst occurring on January 26, 2018, at a depth of 20 km and magnitude of 6.2 [47]. The seismic intensity of the area is VII, seismic response spectrum peak ground acceleration is 0.15 g, and characteristic period is 0.45 s. Bridge pile foundations in this region are significantly influenced by the scouring actions of typhoons and waves in the marine environment, which have resulted in critical seismic design challenges. The Xiang’an Bridge comprises a pile group wherein the four pile foundations have four end-bearing piles with diameters of 2.5/2.15 m and lengths of 44.4 m. The piles are spaced 5.4 m apart and connected to the bridge substructure through a pile cap with dimensions of 17.8 ×13×5.1 m. The diameters of the bridge piles exceed the standard conventional pile diameter of 0.8 m and are therefore categorized as large diameters. The subsurface soil layers adjacent to the piles comprise 15 m of saturated sandy soil, underlaid with a 15 m layer of highly weathered granite, followed by 25 m of moderately weathered granite. A map of the case-study location is shown in Fig. 1 and the workflow is illustrated in Fig. 2.
Fig. 1Geographical location of the Xiang’an Bridge considered for the case study
2.2. Shake-table parameters
The tests were conducted on a three-axis, six-degree-of-freedom seismic-simulation shake table with dimensions of 5×5 m at the Open Laboratory of Earthquake Engineering and Engineering Vibration of the Institute of Engineering Mechanics, China Earthquake Administration (CEA). Its technical parameters are listed in Table 1.
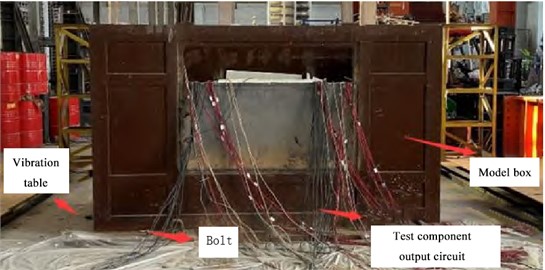
A rigid model box with dimensions of 3.05×1.7×1.8 m (length × width × height), as shown in Fig. 3, was used for the tests. Its inner walls were filled with 2 cm thick foam boards to reduce the boundary effect, thereby preventing soil from overflowing during vibrations and reducing the influence of seismic-wave reflections during the test. The model box was divided into functional areas (I, II, III, and IV) with welded steel plates, where functional area I was used as the control group (scour depth: 0 cm) and II, III, and IV were used as the test groups.
Fig. 2Workflow diagram
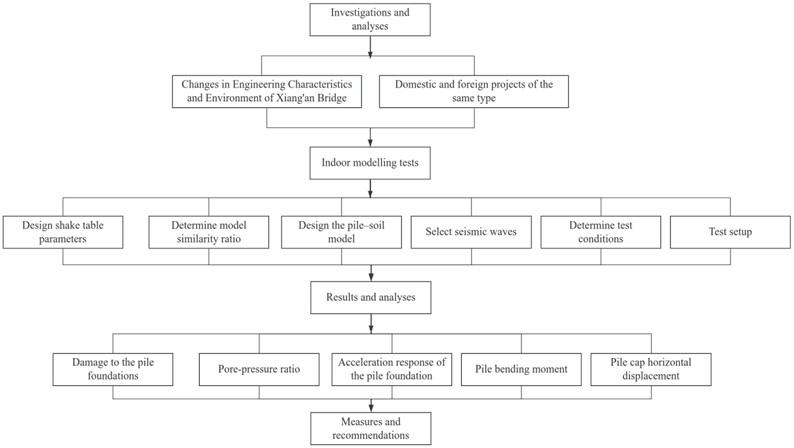
Table 1Technical parameters of the shake table
Parameter | Value |
Vibration mode | Sine, random (seismic motion) |
Frequency range | 0.5-50 Hz |
Maximum model load | 30 t |
Maximum acceleration amplitude | Full load: XY direction 1.0 g, Z direction 0.7 g |
Maximum displacement amplitude | XY direction: ±80 mm, Z direction: ±50 mm |
Fig. 3Image of the model box
2.3. Model-similarity ratio
A similarity ratio of 1/50 was used to construct the models. The Buckinghamπ theory was employed to fully consider the similarity of seismic loading, and dimensionless parameters were constructed to ensure that the scaling relationship between key physical quantities in the artificial mass model was the same as that in the prototype structure [48]. The functional relationship is expressed as follows:
where σ is the structural stress, l is the structural dimension, E is the structural modulus of elasticity, ρ is the structural mass density, t is the time, r is the structural response displacement, v is the structural response velocity, a is the structural response acceleration, g is the gravity acceleration, and ω is the structural self-oscillation circular frequency. Considering l, E and ρ as the basic quantities: [l]=L, [E]=E, and [ρ]=ρ, the remaining physical quantities can be expressed as dimensionless parameters L, E and ρ.
Because the total mass of the model is the sum of the mass mm of the model and the artificial mass ma, a 400 kg artificial mass was configured at the top of the pile without affecting the stiffness of the structure and considering the actual bearing capacity of the shaking table and similar conditions for the artificial mass. The similar constants for each physical quantity are presented in Table 2. The resulting artificial mass was calculated as follows:
where ma is the artificial mass, CE is the elastic modulus similarity ratio, C21 is the geometric similarity ratio, mp is the prototype mass, and mm is the model mass.
Table 2Similarity constants of the physical experimental parameters
Category | Parameter | Dimensiona | Similarity constant |
Load | Acceleration (a) | LT-2 | 1 |
Gravitational acceleration (g) | LT-2 | 1 | |
Velocity (v) | LT-1 | 501/2 | |
Time (t) | T | 1/501/2 | |
Geometry | Length (l) | L | 1/50 |
Linear displacement (δ) | L | 1/50 | |
Frequency (ω) | T-1 | 501/2 | |
Material | Elastic modulus (E) | FL-2 | 1/3.5 |
Stress (σ) | FL-2 | 1/3.5 | |
Strain (ε) | / | 1 | |
Poisson's ratio (μ) | / | 1 | |
Density (ρ) | FL-4 T2 | 1 | |
aL denotes length, T denotes time, and F denotes force | |||
2.4. Design of the pile–soil model
The model piles had lengths and diameters of 90 and 5.0/4.3 cm, respectively, with the variable section located 56 cm below the top of the pile. The model pile was fabricated using particulate concrete with a reinforcement ratio of 2.4 %. The ordinary silicate cement was used, with river sand as the aggregate having a maximum particle size of 4.75. The mix proportion was cement: stone: sand: water: = 1.0:4.19:1.48:0.60, a chieving a compressive strength of 17.0 MPa, and modulus of elasticity of 25.2 GPa. Four galvanized iron wires with a diameter of 4 mm were selected for the main reinforcement, and one with a diameter of 2.8 mm was selected for the hoop reinforcement. The hoop bar was made of galvanized iron wire of type Q235 with a yield strength of 235 MPa and elastic modulus of 200 GPa. The four-pile foundation construction entailed reinforcement placement and tying, formwork erection, concrete pouring, and formwork removal, as shown in Fig. 4.
Based on the geological data of the site, the model soil was simplified into three layers (from top to bottom): saturated sandy-soil layer, strongly weathered granite, and moderately weathered granite. To satisfy the similarity-ratio relationship, a particulate concrete configuration was adopted to simulate the medium-weathered granite. In addition, a soil configuration was employed to simulate the physical and mechanical parameters of sandy soil and strongly weathered granite. The model soil preparation and piles are shown in Fig. 5, and the physical and mechanical indices of sandy soil and strongly weathered granite are listed in Table 3. The sieve method was used to test the grain-size composition of the sandy soil, and the cumulative curves are shown in Fig. 6.
Fig. 4Pile-model construction
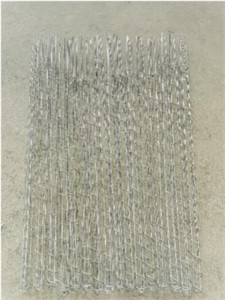
a) Reinforcing steel binding
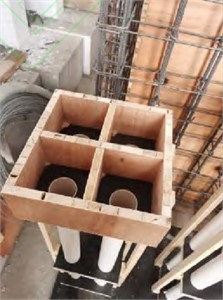
b) Formwork erection
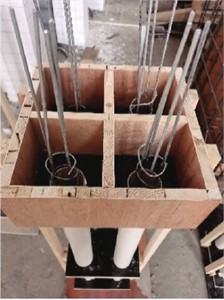
c) Placement of reinforcing steel
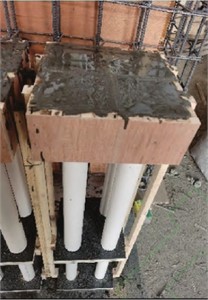
d) Pouring concrete
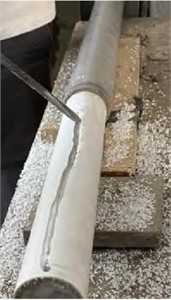
e) Formwork removal
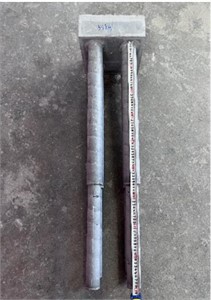
f) Pile up
Fig. 5Model preparation
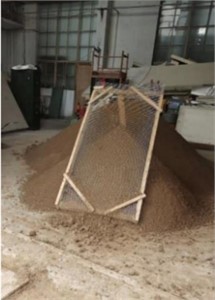
a) Model soil

b) Model piles
2.5. Selection of seismic waves
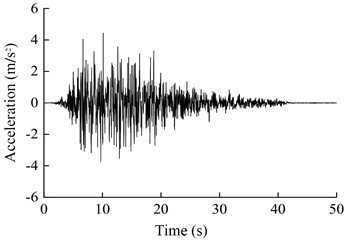
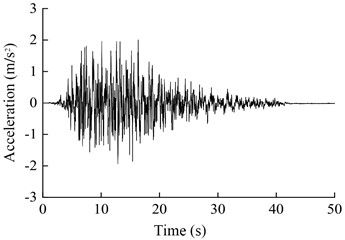
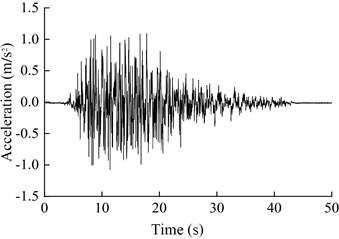
The 1004 wave was selected as the seismic wave and artificially synthesized by the CEA for the Xiang’an Bridge. The seismic acceleration exceeding a probability of 4 % in the design-base period of 100 years was 0.15 g. This reference wave was fed into the seismic-wave processing software SeismoSigna, which was used to perform filtering and baseline corrections to limit the peak acceleration and obtain the seismic-wave intensities of 0.10, 0.15, 0.20, 0.25, 0.30, 0.35, 0.40, 0.45, and 0.45 g. The loading direction was bidirectional in the horizontal X and Y directions, and the acceleration amplitude was adjusted according to a horizontal X-direction: horizontal Y-direction ratio of 1.00:0.85. Additionally, the bidirectional horizontal excitation was employed in the test. The acceleration-time-course curves and response spectra of the 1004 0.15 g seismic wave is shown in Fig. 7.
Table 3Physical and mechanical properties of the soil layers
Soil type | Natural moisture content (w, %) | Density ρ (g·cm-3) | Cohesion c (kPa) | Internal friction angle φ (°) | |
Sandy soil | Prototype | 25.3 | 1.83 | 0 | 34 |
Model | 25.5 | 1.86 | 0 | 35 | |
Highly weathered granite | Prototype | 11.9 | 2.63 | 23.1 | 37 |
Model | 11.2 | 2.56 | 22.5 | 43 | |
Fig. 6Particle gradation curve
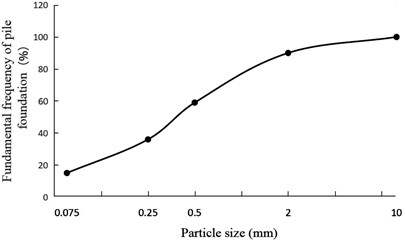
Fig. 7Characteristics of the 1004 seismic wave
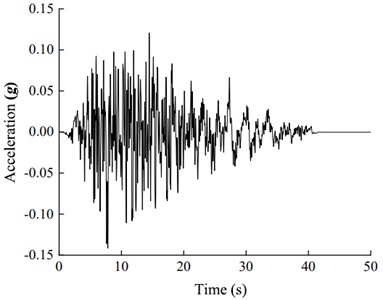
a) Acceleration time-course curves
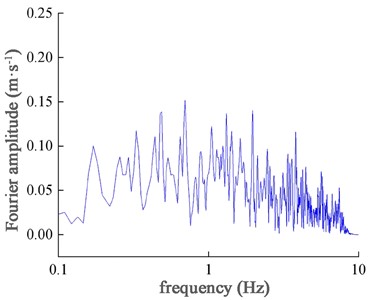
b) Wave-response spectra
2.6. Test conditions
The scour depth of the Xiang’an Bridge abutment is 1.0–6.0 m and the local scour depth is 6.55 m. However, owing to environmental factors such as heavy rainfall and flooding, its scour depth is predicted to reach or exceed 16 m in the upcoming decades based on historical data processed using mathematical models. The test in this study employed four model piles to simulate the seismic response of a structure under a small scour depth (0-4 × pile diameter) and large scour depth (6–8 × pile diameter). Scour depths of 0 and 5 m (2 × pile diameter), 10 m (4 × pile diameter), and a maximum of 16 m corresponded to scour depths of 0, 10, 20, and 32 cm for functional areas I, II, III, and IV in the modeling box, respectively. Functional area I, with a scour depth of 0 cm (no scouring), was the control group, as shown in Figs. 8(a) and 8(b).
Fig. 8Model plans and test elements
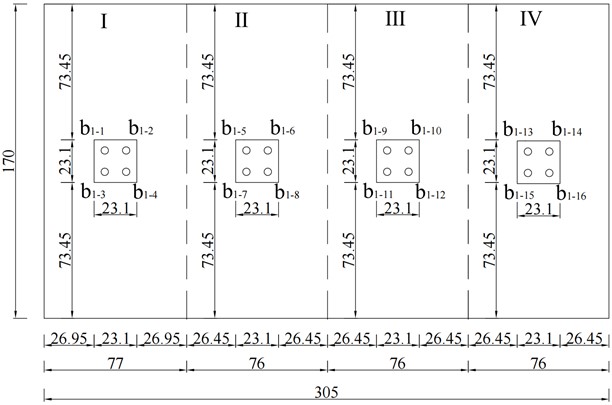
a) Model pile plan
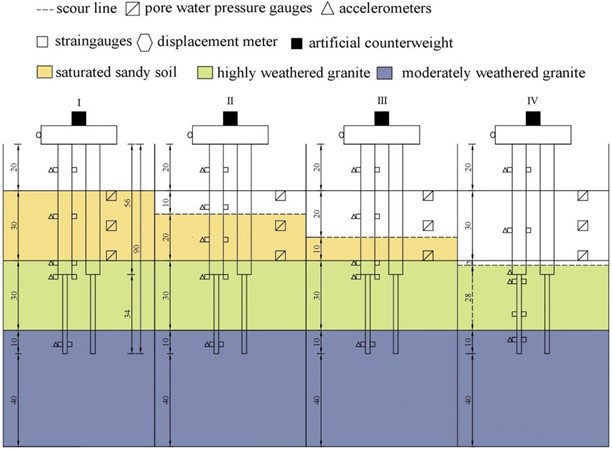
b) Model elevation and section plan showing the layout of the staking points
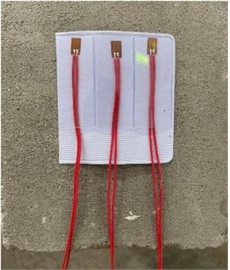
c) Strain gauge
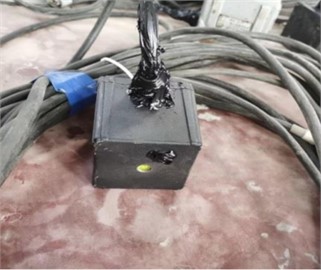
d) Acceleration sensors
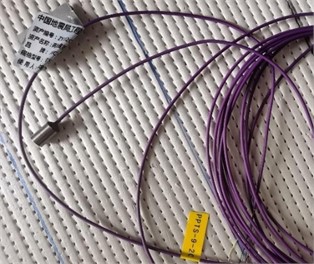
e) Displacement Sensor
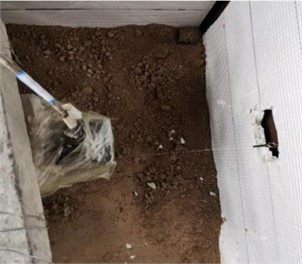
f) Pore-water manometer
2.7. Test setup
To measure the strain on the pile body and determine the bending moment, strain gauges were placed symmetrically at specific intervals near the top of the pile, center of the sandy-soil layer, soil-layer interface, variable cross-section, and bedrock surface of the model pile. Accelerometers were placed at the corresponding locations on the model piles to measure their accelerations, and pore-water manometers were placed at the corresponding locations around the soil body. The pile acceleration and strain were both in the X-direction, and the staking-point layout and test elements employed are shown in Figs. 8(b) and 8(c), respectively.
3. Results and discussion
3.1. Damage to the pile foundations
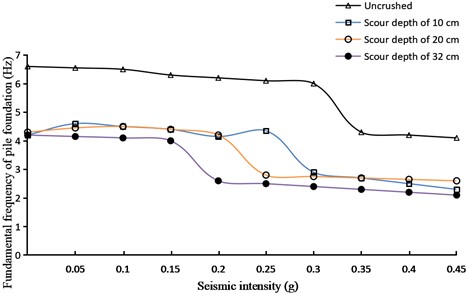
The changes in the base frequency of the pile foundation at different scour depths are shown in Fig. 9. The results indicate that irrespective of the scour depth, the increase in seismic acceleration caused the base frequency of the pile foundation to decrease abruptly from the original relatively stable value and then restabilize. The magnitudes of the abrupt decreases at different scour depths were similar, ranging from 30-40 % (38.2, 33.3, 35.7, and 39.8 % for scour depths of 0, 10, 20, and 32 cm, respectively). By contrast, larger differences were evident in the critical accelerations of the abrupt decreases in the fundamental frequency at different scour depths (critical accelerations of 0.30, 0.25, 0.20, and 0.15 g occurred at scour depths of 0, 10, 20, and 32 cm, respectively). These abrupt decreases in the fundamental frequency generally indicate that the pile foundation was damaged or destroyed [49]. Additionally, as the scour depth increased, the ability of the pile foundation to resist damage or destruction decreased significantly.
Fig. 9Changes in the fundamental frequency of the pile foundation
3.2. Pore-pressure ratio
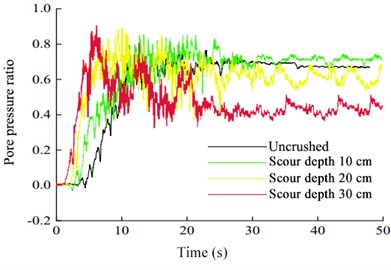
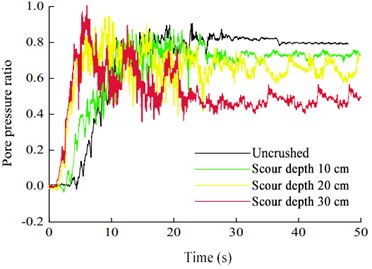
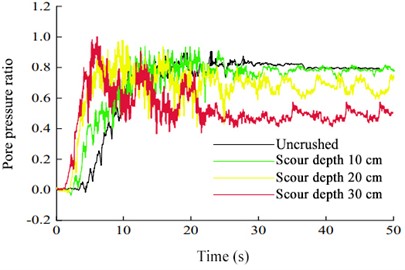
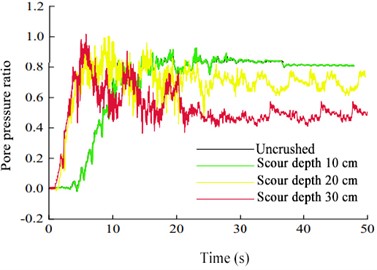
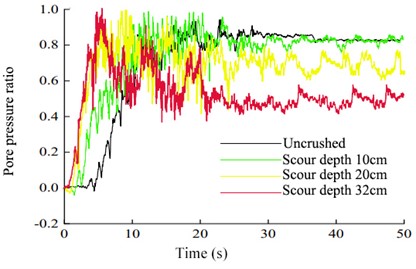
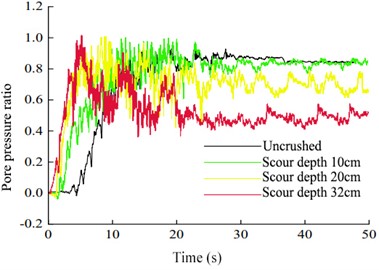
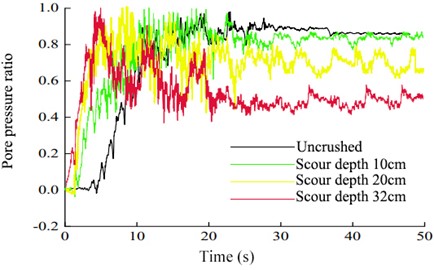
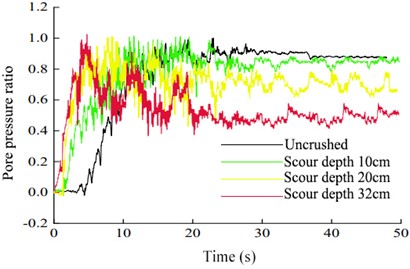
The pore-pressure ratio, which is the ratio of the pore-water pressure to the effective stress, can be used to indicate the degree and impact of scouring on a pile foundation. The pore-pressure ratio is directly related to the bearing capacity of the pile foundation. As shown in Fig. 10, the trend of the pore-pressure ratio was essentially the same for all the scour depths and ground-shaking intensities investigated; it remained approximately 0 when the seismic wave was loaded, and then increased rapidly and eventually stabilized.
For different ground-shaking intensities at the same scour depth, the time required to reach the peak value was shorter than that of the input seismic wave. As the ground-shaking intensity increased, the value for pore-pressure ratio stabilization also increased.
Fig. 10Variations in the pore-pressure ratios of models with different scour depths during excitation under various seismic intensities: a) 0.10 g, b) 0.15 g, c) 0.20 g, d) 0.25 g, e) 0.30 g, f) 0.35 g, g) 0.40 g, and h) 0.45 g
a)
b)
c)
d)
e)
f)
g)
h)
For example, as the ground-shaking intensity was increased from 0.10 to 0.45 g for a scour depth of 10 cm, the pore-pressure ratio increased at 2.43, 2.38, 2.35, 2.32, 2.30, 2.27, 2.24, and 2.21 s to reach peak values of 0.69, 0.72, 0.79, 0.82, 0.84, 0.85, 0.86, and 0.87, respectively, at 12.15, 11.94, 10.52, 10.13, 9.84, 9.25, 8.72, and 8.24 s, respectively, which were all earlier than those of the input seismic wave. This is because as the ground-shaking intensity increased, the pore-water pressure in the soil could not be rapidly discharged, which increased the stable pore-pressure ratio of the saturated sandy-soil layer. When the ground-vibration intensity loading was initiated, the pore-pressure ratio appeared negative owing to the shear expansion of the sandy soil during vibration, which led to a negative increase in the superstatic pore-water pressure.
Under the same seismic intensity, the increase in scour depth resulted in an earlier increase and peak of the pore-pressure ratio, which gradually decreased after it stabilized. For example, for a ground-shaking intensity of 0.15 g, the pore-pressure ratio began increasing rapidly at 3.22, 2.38, 2.06, and 1.28 s for scour depths of 0, 10, 20, and 32 cm, respectively, peaked at 23.65, 21.92, 9.95, and 6.43 s, respectively, before stabilizing at 0.81, 0.77, 0.69, and 0.51 s, respectively. This may have occurred because as the scour depth increased, the missing range of the soil layer around the pile increased and the self-weight of the overlying sandy soil decreased, which influenced the infiltration capacity of the soil around the pile and enhanced the growth rate of its superstatic pore-water pressure. The change in the pore-pressure ratio led to a more violent response from the pile foundation under seismic loading, thus increasing the risk of structural damage. Therefore, real-time monitoring of changes in pore-pressure ratio can enable the swift detection of potential scour problems, which can help implement appropriate preventive and reinforcement measures and avoid structural damage.
4. Acceleration response of the pile foundation
4.1. Peak acceleration response of the pile body
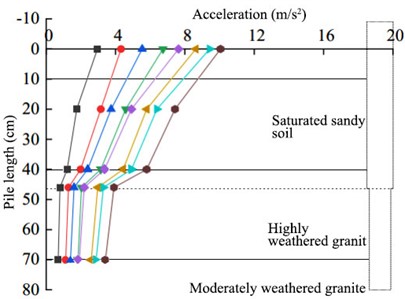
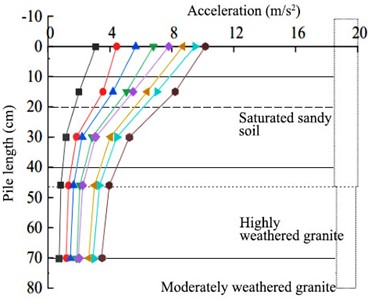
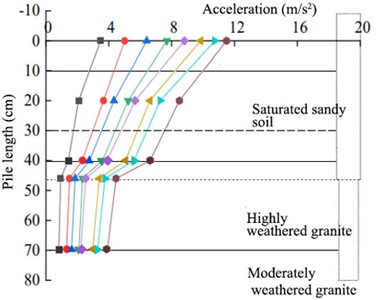
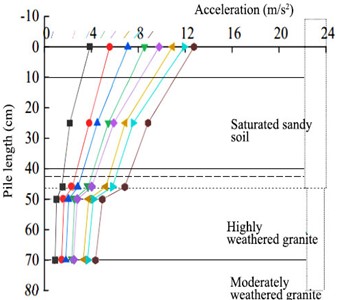
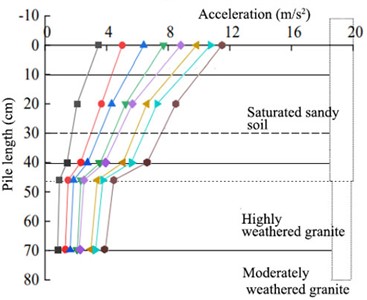
As shown in Fig. 11, considering the fixing conditions and tip mass, under seismic waves of different intensities, the acceleration of a pile body with large-diameter variable cross-section group piles along the direction of the pile length is basically the same: it gradually increases from the bottom of the pile to the top, whereas that at the same location gradually increases as the ground-shaking intensity increases.
The softness and hardness of the transition zone of the rock and soil medium are relatively high, resulting in a larger amplitude of the seismic transmission wave than that of the incident wave. The growth rate of the pile-body acceleration was the lowest in the moderately weathered granite layer, strongest in the highly weathered granite layer, and fastest in the saturated sandy-soil layer. An abrupt change occurred at the soil-layer interface and variable cross-section, and the peak was at the top of the pile. The increase in the acceleration of the pile body differed for the different soil layers and changed abruptly at the interfaces because of the weaker soil body, weaker restraining effect on the pile foundation, and enhanced amplifying effect of the scouring soil layer on seismic waves. The sudden change in pile acceleration at the variable cross-section was due to the reduction in the size of the lower part of the large-diameter variable cross-section pile as the overall pile–soil stiffness weakened and the acceleration law of the pile body changed accordingly; thus, the acceleration at the variable cross-section significantly increased.
Fig. 11Pile accelerations according to seismic intensity at various scour depths: a) 0 cm, b) 10 cm, c) 20 cm, and d) 32 cm
a)
b)
c)
d)

As the scour depth increases, the acceleration at the top of the pile gradually increases. For example, under a ground-vibration intensity of 0.15 g, the peak acceleration of the pile body was at the top of the pile at scour depths of 0, 10, 20, and 32 cm and the accelerations were 4.1, 4.3, 5.1, and 5.6 m/s2, respectively. This may have occurred because as the scour depth increased, the thicknesses of the saturated sandy soil and strongly weathered granite layers decreased, the restraining effect of the soil layer on the side of the pile weakened, and the free length of the pile base increased. Additionally, as the free section of the pile base was sensitive to the vibrations caused by the input seismic wave, the acceleration of the pile body increased further. Therefore, the distribution of the foundation soil layer and the soil characteristics had a greater influence on the acceleration-time response at the top and bottom of the pile-foundation group.
4.2. Acceleration-time-range response of the pile foundation
The acceleration-time responses of the top, variable section, and bottom of the pile for a seismic wave of 0.15 g and scour depth of 10 cm are shown in Fig. 12, wherein it is evident that they varied according to the ground-shaking intensity and scour depth. The acceleration response at the bottom was dense and close to the frequency of the input seismic wave, whereas those at the variable section and top were sparse and had a lower frequency, differing significantly from that of the input seismic wave. Additionally, the acceleration peak at the top lagged behind that at the bottom. The response trends exhibited characteristics similar to those of the other seismic-wave intensities and scour depths.
Fig. 12Acceleration-time-range responses of the pile foundation at a scour depth of 10 cm and ground-vibration intensity of 0.15 g
a) Pile-top
b) Variable section
c) Pile bottom
4.3. Pile-bending moment
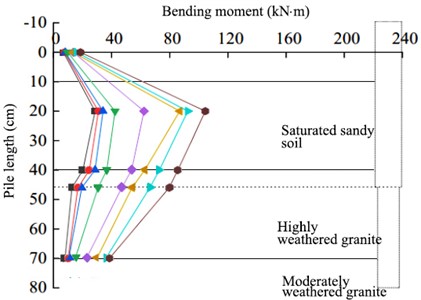
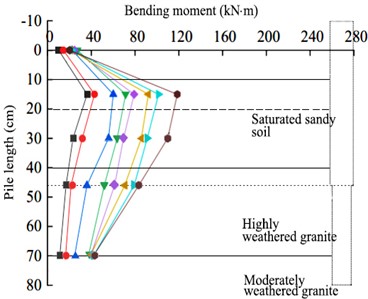
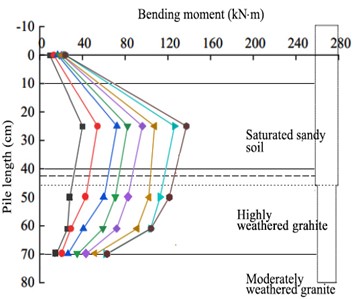
As can be seen from Fig. 13, considering the fixing conditions and tip mass, under seismic waves with different intensities, the change rule of the bending moment of the pile body with large-diameter variable cross-section group piles along the direction of the pile length is basically the same: first, it increases from the bottom to the top of the pile and then decreases, and the whole shows the “single-peak” rule of change. As the ground-shaking intensity increases, the bending moment of the pile body gradually increases. Additionally, as the scour depth increases, the bending moment of the pile body at the same location gradually increases, and the maximum bending moment of the pile body gradually shifts downward. The maximum bending moments of the pile body at scour depths of 10, 20, and 32 cm was 15, 20, and 25 cm. Taking the 0.15 g, 1004 wave action as an example, the maximum bending moments of the pile shaft with scouring depths of 0, 10, 20, and 32cm are 30.89, 42.99, 44.33, and 54.12 kN·m, respectively. This is because as the scour depth increases under seismic action, the effective pile length decreases, free length increases, and restraining effect of the geotechnical body on the pile body decreases, resulting in a poor pile–soil stability. The sudden change in the bending moment of the pile body at the variable section is due to the decrease in the pile diameter in the lower part of the section. This causes the geometric characteristics to change, and the bending stiffnesses of the upper and lower parts of the pile body generate a large difference. Therefore, the hoop reinforcement and the reinforcement of the pile at in the variable section should be increased to ensure that the pile near the variable section has a sufficient bending capacity.
Fig. 13Trends of the pile-bending moment at different scour depths under various seismic intensities: a) 0 cm, b) 10 cm, c) 20 cm, and d) 32 cm
a)
b)
c)
d)

According to the reinforcement of the model pile foundation calculated using the Design Code for Highway Reinforced Concrete and Prestressed Concrete Bridges and Culverts [50], the bending capacity of the pile body was 85.12 kN·m. Fig. 14 indicates that for ground-vibration strengths of 0.10, 0.15, 0.20, 0.25, 0.30 g, the peak bending moments of the pile body were 29.33, 33.75, 46.26, 60.46, and 74.72 kN·m, corresponding to bending capacity surpluses of 65.5, 60.4, 45.7, 29.0, and 12.2 %, respectively. For peak seismic-wave accelerations of > 0.35 g, the peak bending moment of the pile body was in the range of 86.51-101.42 kN·m, which exceeded the bending capacity by 1.6-19.1 %. This indicates that the bending capacity of the pile foundation of the Xiang’an Bridge satisfies the design requirements for seismic intensity VII (0.15 g).
4.4. Pile-cap horizontal displacement
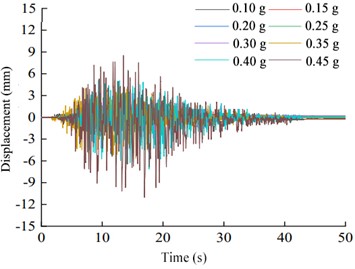
Rezazadeh et al. [51] suggested transforming data into other domains, such as frequency or time–frequency, to make the results more visible. Therefore, we also obtained the time-range responses of the horizontal displacement at the top of the pile, as shown in Fig. 15, as well as the change patterns of the peak horizontal displacement and moments of peak occurrence, as shown in Figs. 16 and 17, respectively.
Fig. 14Trend of the peak bending moment of the pile body
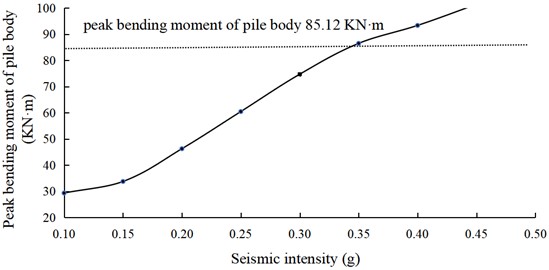
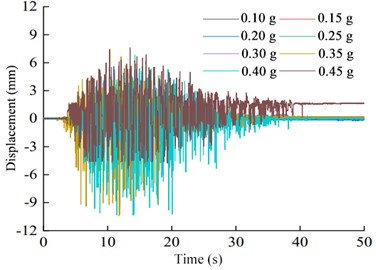
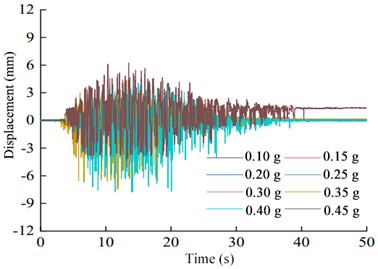
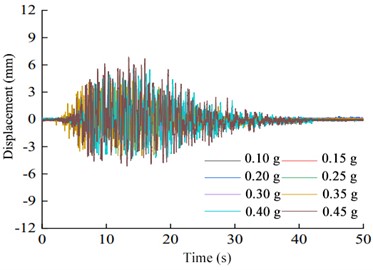
Fig. 15Time responses of the horizontal displacements at the pile top: a) 0 cm, b) 10 cm, c) 20 cm, and d) 32 cm
a)
b)
c)
d)
It is evident from Fig. 15 that the horizontal displacement time-range responses of the pile top are relatively unchanged under various ground-shaking intensities. As the input seismic wave was maintained for 40 s, the horizontal relative displacement of the pile top in the figure ranges from 0–40 s, after which the displacement curve becomes a straight line but does not go drop down to zero. Additionally, its baseline value generates an offset, i.e., the pile top exhibits permanent lateral displacement after the vibration ceases. This is because the soft soil experiences scour under seismic action, which lowers the soil-layer constraint around the pile foundation as well as the lateral force of the pile foundation, leading to higher deformation of the pile top.
Furthermore, Fig. 16 shows that the relative peak horizontal displacement at the pile top varies significantly. As the ground-shaking intensity and scour depth increased, the peak horizontal displacement of the top of the pile group increased gradually. For example, under a seismic acceleration of 0.15 g, the maximum horizontal displacement at the pile-top were 0.74, 0.80, 1.39, and 1.70 mm at scour depths of 0, 10, 20, and 32 cm, respectively, suggesting that it increased approximately linearly. This may have occurred because as the scour depth increased, the effective pile length decreased, free length increased, and the overall pile-soil stability became poor. For example, under seismic-wave intensities of 0.10, 0.15, 0.2, 0.25, 0.3, 0.35, 0.4, and 0.45 g at a scour depth of 10 cm, the maximum horizontal displacements were 0.69, 0.80, 1.34, 2.54, 3.66, 4.75, 5.11, and 6.25 mm, respectively. This is because as the ground-vibration intensity increases, the shear modulus of the soil layer decreases and damping increases, thereby enhancing the interaction force between the pile and soil and the dynamic response of the pile foundation, which further induce relative displacements in the piles and soil, leading to higher horizontal displacements at the top of the piles.
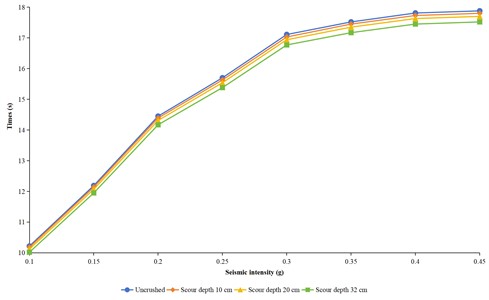
Additionally, Fig. 17 shows that at the same scour depths, the maximum horizontal displacements of the pile-top occur at different moments. For a scour depth of 10 cm, the maximum horizontal displacements under seismic wave intensities of 0.10, 0.15, 0.2, 0.25, 0.3, 0.35, 0.4, and 0.45 g are reached at 10.18, 12.14, 14.39, 15.63, 17.03, 17.45, 17.73, and 17.80 s, respectively. This is because the scour depth affects both the saturated sandy soil and pile foundation, resulting in variations in their response sensitivities to seismic waves of different intensities.
Fig. 16Change pattern of peak horizontal displacement of pile top
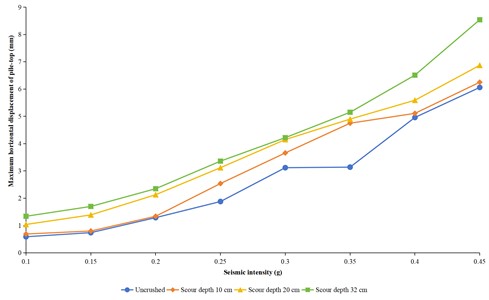
Fig. 17Moment of peak horizontal displacement of pile top
5. Conclusions
This study investigated the dynamic response characteristics of the large-diameter variable section group-pile foundation at scour depths of 10, 20 and 32 cm based on the characteristics of the complex sea scour environment of Xiang’an Bridge through a large shaking-table model test under 1004 waves with ground-vibration intensities of 0.10, 0.15, 0.20, 0.25, 0.30, 0.35, 0.40, 0.45 g. The following conclusions were drawn:
1) As the seismic intensity increased, the pore-pressure ratio gradually increased and then stabilized. The stable pore-pressure ratio increased as the ground-shaking intensity increased. However, it started to increase at different times and reached its maximum value earlier than the input seismic wave. Additionally, as the scour depth increased, the stable pore-pressure ratio, shear strength, and bearing capacity of the soil layer decreased. Therefore, the effects of larger scour depths on the pore-pressure ratio should remain an area of focus.
2) At different scour depths, the acceleration and bending moment of the pile body changed abruptly in the variable section and at the soil-layer interface. As the scour depth increased, the horizontal displacement of the pile-top, acceleration of the pile body, and bending-moment peaks gradually increased.
3) At the same scour depth, the saturated sandy-soil pore-pressure ratio, pile acceleration, pile-top horizontal displacement, and pile-bending moment increased as the ground-shaking intensity increased. A higher ground-shaking intensity amplified the disturbance of the saturated sandy-soil layer around the pile foundation, thus weakening the saturated sandy-soil layer and the soil constraint on the pile side.
4) As the scour depth and dynamic strength increased, the dynamic characteristics of the pile foundation of the Xiang’an Bridge changed; therefore, the changes in the pore-pressure ratio and pile acceleration should remain an area of focus. Additionally, if the bending strength of the piles is selected as the structural control factor, the bending capacity of the pile foundation with a variable cross-section should be addressed to ensure the earthquake-resistant performance of the large-diameter variable-section tetra-pile foundation.
It is worth noting that owing to the limitations of the testing laboratory, the soil and pile material properties were assumed to be constant; therefore, the proposed methodology is only applicable to bridges that are not subjected to significantly varying geological conditions. However, the dynamic response in the real world are more complex and vary with the road sections and environmental conditions, wherein the material properties may vary significantly owing to factors such as water content, soil composition, and weathering. Therefore, future research should apply the proposed methodology to real-world environments by considering these variations.
References
-
Z. Wang, L. Dueñas‐Osorio, and J. E. Padgett, “Seismic response of a bridge-soil-foundation system under the combined effect of vertical and horizontal ground motions,” Earthquake Engineering and Structural Dynamics, Vol. 42, No. 4, pp. 545–564, Apr. 2013, https://doi.org/10.1002/eqe.2226
-
A. Javdani Naeini, A. J. Choobbasti, and M. Saadati, “Seismic behaviour of pile in three-layered soil (case study: Babol City Center Project),” Arabian Journal of Geosciences, Vol. 6, No. 11, pp. 4487–4497, Sep. 2012, https://doi.org/10.1007/s12517-012-0671-x
-
Z. Feng et al., “Research on corrosion damage and bearing characteristics of bridge pile foundation concrete under a dry‐wet‐freeze‐thaw cycle,” Advances in Civil Engineering, Vol. 2021, No. 1, pp. 1–13, Jan. 2021, https://doi.org/10.1155/2021/8884396
-
Z. Wang and W. Qiu, “Characteristics of wave forces on pile group foundations for sea-crossing bridges,” Ocean Engineering, Vol. 235, p. 109299, Sep. 2021, https://doi.org/10.1016/j.oceaneng.2021.109299
-
J. Li, X. Kong, Y. Yang, L. Deng, and W. Xiong, “CFD investigations of tsunami-induced scour around bridge piers,” Ocean Engineering, Vol. 244, p. 110373, Jan. 2022, https://doi.org/10.1016/j.oceaneng.2021.110373
-
X. Huang, S. Hou, M. Liao, and Z. Zhu, “Bearing capacity evaluation and reinforcement analysis of bridge piles under strong earthquake conditions,” KSCE Journal of Civil Engineering, Vol. 22, No. 4, pp. 1295–1303, Apr. 2018, https://doi.org/10.1007/s12205-017-1352-9
-
Y. Lin and C. Lin, “Effects of scour-hole dimensions on lateral behavior of piles in sands,” Computers and Geotechnics, Vol. 111, pp. 30–41, Jul. 2019, https://doi.org/10.1016/j.compgeo.2019.02.028
-
C. Wang, X. Yu, and F. Liang, “A review of bridge scour: mechanism, estimation, monitoring and countermeasures,” Natural Hazards, Vol. 87, No. 3, pp. 1881–1906, Mar. 2017, https://doi.org/10.1007/s11069-017-2842-2
-
S. Foti and D. Sabia, “Influence of foundation scour on the dynamic response of an existing bridge,” Journal of Bridge Engineering, Vol. 16, No. 2, pp. 295–304, Mar. 2011, https://doi.org/10.1061/(asce)be.1943-5592.0000146
-
A. Alipour, B. Shafei, and M. Shinozuka, “Reliability-based calibration of load and resistance factors for design of rc bridges under multiple extreme events: scour and earthquake,” Journal of Bridge Engineering, Vol. 18, No. 5, pp. 362–371, May 2013, https://doi.org/10.1061/(asce)be.1943-5592.0000369
-
Z. Y. Ai and Z. X. Li, “Dynamic analysis of a laterally loaded pile in a transversely isotropic multilayered half-space,” Engineering Analysis with Boundary Elements, Vol. 54, pp. 68–75, May 2015, https://doi.org/10.1016/j.enganabound.2015.01.008
-
L. C. Bolduc, P. Gardoni, and J.-L. Briaud, “Probability of exceedance estimates for scour depth around bridge piers,” Journal of Geotechnical and Geoenvironmental Engineering, Vol. 134, No. 2, pp. 175–184, Feb. 2008, https://doi.org/10.1061/(asce)1090-0241(2008)134:2(175)
-
C. Lin, J. Han, C. Bennett, and R. L. Parsons, “Analysis of laterally loaded piles in sand considering scour hole dimensions,” Journal of Geotechnical and Geoenvironmental Engineering, Vol. 140, No. 6, p. 04014, Jun. 2014, https://doi.org/10.1061/(asce)gt.1943-5606.0001111
-
Y. Xu, Y. Shang, and A. Ye, “Dynamic interaction between bridge pier and its large pile foundation considering earthquake and scour depths,” Advances in Structural Engineering, Vol. 19, No. 9, pp. 1390–1402, Jul. 2016, https://doi.org/10.1177/1369433216642077
-
H. Zhang, S. Chen, and F. Liang, “Effects of scour-hole dimensions and soil stress history on the behavior of laterally loaded piles in soft clay under scour conditions,” Computers and Geotechnics, Vol. 84, pp. 198–209, Apr. 2017, https://doi.org/10.1016/j.compgeo.2016.12.008
-
F. Liang, Y. Jia, L. Sun, W. Xie, and H. Chen, “Seismic response of pile groups supporting long-span cable-stayed bridge subjected to multi-support excitations,” Soil Dynamics and Earthquake Engineering, Vol. 101, pp. 182–203, Oct. 2017, https://doi.org/10.1016/j.soildyn.2017.07.019
-
H. Y. Zhao, D.-S. Jeng, C. C. Liao, and J. F. Zhu, “Three-dimensional modeling of wave-induced residual seabed response around a mono-pile foundation,” Coastal Engineering, Vol. 128, pp. 1–21, Oct. 2017, https://doi.org/10.1016/j.coastaleng.2017.07.002
-
S.-T. Song, C.-Y. Wang, and W.-H. Huang, “Earthquake damage potential and critical scour depth of bridges exposed to flood and seismic hazards under lateral seismic loads,” Earthquake Engineering and Engineering Vibration, Vol. 14, No. 4, pp. 579–594, Dec. 2015, https://doi.org/10.1007/s11803-015-0047-9
-
T. Sui, C. Liu, J. Zhang, C. Zhang, and J. Zheng, “3D numerical modeling of wave-monopile-seabed interaction in the presence of a scour hole,” Ocean Engineering, Vol. 298, p. 117254, Apr. 2024, https://doi.org/10.1016/j.oceaneng.2024.117254
-
I. Negru, G.-R. Gillich, Z.-I. Praisach, M. Tufoi, and E.-V. Gillich, “Nondestructive evaluation of piers,” SPIE Smart Structures and Materials + Nondestructive Evaluation and Health Monitoring, Vol. 9438, No. 17, p. 943817, Mar. 2015, https://doi.org/10.1117/12.2081432
-
B. Xiao and K.-W. Zhu, “Monitoring and evaluation of bridge safety based on trispectrum analysis method,” (in Chinese), Journal of Hulunbuir University, Vol. 31, No. 1, pp. 99–104, 2023.
-
Xiao Bing and Zhu Ke-Wei, “Damage identification of bridge structure based on normalization of modal average curvature difference,” Journal of North China Institute of Science and Technology, Vol. 19, No. 5, pp. 93–101, 2022, https://doi.org/10.19956/j.cnki.ncist.2022.05.013
-
L. Zhou, M. S. Alam, Y. Dong, and R. Feng, “Seismic resilience assessment of extended pile shaft supported coastal bridges considering scour and uniform corrosion effects,” Engineering Structures, Vol. 304, p. 117643, Apr. 2024, https://doi.org/10.1016/j.engstruct.2024.117643
-
Z. Wang, L. Dueñas-Osorio, and J. E. Padgett, “Influence of scour effects on the seismic response of reinforced concrete bridges,” Engineering Structures, Vol. 76, pp. 202–214, Oct. 2014, https://doi.org/10.1016/j.engstruct.2014.06.026
-
X. Guo, Y. Wu, and Y. Guo, “Time-dependent seismic fragility analysis of bridge systems under scour hazard and earthquake loads,” Engineering Structures, Vol. 121, pp. 52–60, Aug. 2016, https://doi.org/10.1016/j.engstruct.2016.04.038
-
Q. Chenxi, D. Lunliang, W. Duoyin, Z. Jianting, D. Bingchuan, and F. Hao, “Experimental study on silty seabed scour around the single pile induced by the current,” Ocean Engineering, Vol. 293, p. 116680, Feb. 2024, https://doi.org/10.1016/j.oceaneng.2024.116680
-
A. Basha, “Behavior of single pile subject to oblique uplift load in sandy soil under global scouring,” Applied Ocean Research, Vol. 137, p. 103600, Aug. 2023, https://doi.org/10.1016/j.apor.2023.103600
-
L. J. Prendergast, D. Hester, K. Gavin, and J. J. O. ’Sullivan, “An investigation of the changes in the natural frequency of a pile affected by scour,” Journal of Sound and Vibration, Vol. 332, No. 25, pp. 6685–6702, Dec. 2013, https://doi.org/10.1016/j.jsv.2013.08.020
-
M. Wu et al., “A study of scale effects in experiments of monopile scour protection stability,” Coastal Engineering, Vol. 178, p. 104217, Dec. 2022, https://doi.org/10.1016/j.coastaleng.2022.104217
-
E. Gong, S. Chen, X. Chen, D. Guan, and J. Zheng, “Large-scale experimental study on scour around offshore monopile under combined wave and current condition,” Ocean Engineering, Vol. 283, p. 115186, Sep. 2023, https://doi.org/10.1016/j.oceaneng.2023.115186
-
M. Zhang, H. Sun, W. Yao, and G. Yu, “Local scour of cohesive sediment bed at the pile subjected to lateral vibration,” Ocean Engineering, Vol. 265, p. 112652, Dec. 2022, https://doi.org/10.1016/j.oceaneng.2022.112652
-
X.-L. Zhou and J.-H. Wang, “Analysis of pile groups in a poroelastic medium subjected to horizontal vibration,” Computers and Geotechnics, Vol. 36, No. 3, pp. 406–418, Apr. 2009, https://doi.org/10.1016/j.compgeo.2008.08.013
-
W. Wu, G. Jiang, S. Huang, and C. J. Leo, “Vertical dynamic response of pile embedded in layered transversely isotropic soil,” Mathematical Problems in Engineering, Vol. 2014, pp. 1–12, Jan. 2014, https://doi.org/10.1155/2014/126916
-
G. Deng, J. Zhang, W. Wu, X. Shi, and F. Meng, “Soil-pile interaction in the pile vertical vibration based on fictitious soil-pile model,” Journal of Applied Mathematics, Vol. 2014, pp. 1–11, Jan. 2014, https://doi.org/10.1155/2014/905194
-
A. Janalizadeh and A. Zahmatkesh, “Lateral response of pile foundations in liquefiable soils,” Journal of Rock Mechanics and Geotechnical Engineering, Vol. 7, No. 5, pp. 532–539, Oct. 2015, https://doi.org/10.1016/j.jrmge.2015.05.001
-
A. Rahmani and A. Pak, “Dynamic behavior of pile foundations under cyclic loading in liquefiable soils,” Computers and Geotechnics, Vol. 40, pp. 114–126, Mar. 2012, https://doi.org/10.1016/j.compgeo.2011.09.002
-
G. Ganesh Prasad and S. Banerjee, “The impact of flood-induced scour on seismic fragility characteristics of bridges,” Journal of Earthquake Engineering, Vol. 17, No. 6, pp. 803–828, Aug. 2013, https://doi.org/10.1080/13632469.2013.771593
-
L. Zhou, M. S. Alam, X. Wang, A. Ye, and P. Zhang, “Optimal intensity measure selection and probabilistic seismic demand model of pile group supported bridges in sandy soil considering variable scour effects,” Ocean Engineering, Vol. 285, p. 115365, Oct. 2023, https://doi.org/10.1016/j.oceaneng.2023.115365
-
Z. Wang, H. Zhou, A. Franza, and H. Liu, “Numerical evaluation of scour effects on lateral behavior of pile groups in clay,” Computers and Geotechnics, Vol. 150, p. 104913, Oct. 2022, https://doi.org/10.1016/j.compgeo.2022.104913
-
X. Wang, A. Alipour, J. Wang, Y. Shang, and A. Ye, “Seismic resonance behavior of soil-pile-structure systems with scour effects: Shake-table tests and numerical analyses,” Ocean Engineering, Vol. 283, p. 115052, Sep. 2023, https://doi.org/10.1016/j.oceaneng.2023.115052
-
S.C. Wang, K.Y. Liu, C.H. Chen, and K.C. Chang, “Experimental investigation on seismic behavior of scoured bridge pier with pile foundation,” Earthquake Engineering and Structural Dynamics, Vol. 44, No. 6, pp. 849–864, Oct. 2014, https://doi.org/10.1002/eqe.2489
-
F. Liang, H. Zhang, and M. Huang, “Influence of flood-induced scour on dynamic impedances of pile groups considering the stress history of undrained soft clay,” Soil Dynamics and Earthquake Engineering, Vol. 96, pp. 76–88, May 2017, https://doi.org/10.1016/j.soildyn.2017.02.009
-
X. Bao, Y. Morikawa, Y. Kondo, K. Nakamura, and F. Zhang, “Shaking table test on reinforcement effect of partial ground improvement for group-pile foundation and its numericalsimulation,” Soils and Foundations, Vol. 52, No. 6, pp. 1043–1061, Dec. 2012, https://doi.org/10.1016/j.sandf.2012.11.020
-
R. W. Boulanger, C. J. Curras, B. L. Kutter, D. W. Wilson, and A. Abghari, “Seismic soil-pile-structure interaction experiments and analyses,” Journal of Geotechnical and Geoenvironmental Engineering, Vol. 125, No. 9, pp. 750–759, Sep. 1999, https://doi.org/10.1061/(asce)1090-0241(1999)125:9(750)
-
W. Xiaowei, L. Chuang, and Y. Aijun, “Seismic demand analysis of a simply supported girder bridge in liquefied or non-liquefied ground,” (in Chinese), China Journal of Highway and Transport, Vol. 29, No. 4, pp. 85–9, 2016.
-
Fayun et al., “Model test on seismic response of superstructure and pile group,” (in Chinese), Journal of Building Structures, Vol. 37, No. 9, pp. 134–141, 2016.
-
“Historical queries.” https://www.ceic.ac.cn/history
-
Q. Li and M. Zhou, “Dynamic response of girder bridges with corrugated steel webs subjected to moving loads,” Thin-Walled Structures, Vol. 203, p. 112180, Oct. 2024, https://doi.org/10.1016/j.tws.2024.112180
-
C. Liu, Z. J. Feng, F. Q. Zhang, J. W. Wu, Y. X. Dong, and H. H. Yin, “Dynamic response of rock-socketed pile foundation for extra-large bridge under earthquake action,” (in Chinese), Journal of Traffic and Transportation Engineering, Vol. 18, No. 4, pp. 53–62, 2018.
-
“Specifications for design of highway reinforced concrete and prestressed concrete bridges and culverts,” (in Chinese), JTG 3362-2018, Ministry of Transport of the People’s Republic of China, 2018.
-
N. Rezazadeh, A. de Luca, and D. Perfetto, “Unbalanced, cracked, and misaligned rotating machines: a comparison between classification procedures throughout the steady-state operation,” Journal of the Brazilian Society of Mechanical Sciences and Engineering, Vol. 44, No. 10, pp. 1–14, Sep. 2022, https://doi.org/10.1007/s40430-022-03750-1
About this article

This work was supported by China Communications Third Highway Engineering Bureau Co., Ltd. (No. 4GS-FZJC-0618-2023-0006), Fujian Province Innovation Strategy Research Plan Project (No. 2024R0082).
The datasets generated during and/or analyzed during the current study are available from the corresponding author on reasonable request.
Conceptualization, Bing Xiao; Data Curation, Jie Cai; Formal Analysis, Jiansong Dong; Funding Acquisition, Jie Cai; Investigation, Jiansong Dong; Methodology, Bing Xiao; Project Administration, Bing Xiao; Resources, Jie Cai; Software, Bing Xiao; Supervision, Jie Cai; Validation, Jiansong Dong; Visualization, Jiansong Dong; Writing – Original Draft Preparation, Bing Xiao; Writing – Review and Editing, Jie Cai. All authors have read and agreed to the published version of the manuscript.
The authors declare that they have no conflict of interest.
