Abstract
It was observed that liquefaction induced by earthquake causes series damages to buildings and threatens the people and their properties. From the past studies, a number of countermeasures were proposed to reduce the build-up of excess pore water pressure and to enhance the stiffness of the soil during earthquake. The vertical drain systems are well known methods and used as remediation against earthquake-induced soil liquefaction for many years. The purpose of the study is to investigate the effect of different vertical drain systems for the liquefiable soil by centrifuge modeling technique. The seismic behavior of liquefiable soil was performed firstly. The free field soil models were then prepared with alternatively arranged drain-belts and gravel-pile drains to investigate the effect of different vertical drain systems on the liquefiable soil. Several arrays of accelerometers, the pore water pressure transducers and displacement transducers were placed to monitor the shear wave propagation, the excitation and dissipation of pore water pressure. Displacement transducers were placed to measure the ground surface settlement. From the test results, it was observed that the vertical drain systems reduce the settlement and excess pore water pressure significantly. In the future, the vertical systems will be applied around the structure and the test results would give engineers suggestions to deal with the arrangements of drain-belts and gravel drains to reduce the damage during and after the earthquake.
1. Introduction
Liquefaction is one of most common and damage phenomena induced by strong earthquake or other rapid loading which normally subject to lose saturated soil. As the results, strength or stiffness of soil would be lost due to building-up of excess pore water pressure. The associated damage with this catastrophe including permanent settlements, large horizontal deformations, and loss of bearing capacity in recent large earthquakes considered as severe issues. As the historical document, this type dangerous catastrophe come along with strong earthquake and bring a lot of damages to those regions such as in the earthquakes of Niigata, Japan 1964 [1], Dagupan City, Philippines 1990, [2], Chi-Chi, Taiwan 1999 [3], Kocaeli, Turkey 1999 [4], and recent Tohoku earthquake, Japan 2011 [5]. On the major concerns for engineers, the prevention of those damage in seismically active regions is essential to research; besides, drainage methods are well known as liquefaction remediation that have been studied for several years and have traditionally included stone columns, gravel drains [6-14] or geosynthetic material drains. Apparently, for large soil areas with liquefiable deposits extending deep below the surface, soil replacement or densification is not an option [6]. Then vertical drain such as stone columns would be well-known as less invasive and the most effective technique in this point and possibly have extraordinary advantages of densification, reinforcement, and increased drainage [15-17] and the gravel drain technique was approached for the Technical Development Award of the Civil Engineering Society of Japan in 1985 [18, 19]. In this study, in order to clarify effect of the countermeasure for liquefaction problem and the associated damages such as reducing the buildup of excess pore water pressures or expedite excess pore water pressure dissipation, three centrifuge shaking table tests were performed those are free field soil samples without and with annularity arranged belt drains with geosynthetic material and sand pile drains in the Centrifuge Modelling Laboratory at National Central University (NCU) and being labelled as Test 1, Test 2, and Test 3, respectively. The purpose of this study is to investigate the effectiveness of different vertical drain systems on the liquefiable soil to deal with the arrangements of drain-belts and sand pile drains for reduction of the settlement during and after the earthquake by installation of several accelerometers, pore water pressure transducers, and displacement transducers into model to detect the shear wave propagation, the excitation of pore water pressure, and the settlement of liquefiable soil ground. The test results of both model Test 2 and Test 3 with vertical drain systems show that the settlement, excess pore water pressure would be diminished rather than model of Test 1 as free field model and the dissipation of excess pore water pressure would be also occurred dramatically faster. However, because of using viscous fluid instead of water to estimate the prototype behavior, permeability of material depends on the temperature of testing environment, so response in treated areas were not always substantially smaller than in the untreated area in term of pore water pressure; therefore, permeability is also one important factor in physical modeling simulation. In addition, reduction of exceed pore water pressure or of liquefaction duration might lead to have 20 % to 50 % improvement in the vertical settlements and that was likely benefit comparing with non-treated areas.
2. Test equipment and materials
The laboratory test is used to attempt stimulating completely behaviors of objects as the best way to explore structure because the full scale modeling tests are probably not effective in term of effective cost, time, condition (loading, areas), etc. Therefore, small scale physical modeling of earth structure has been used to expectedly provide insight into failure mechanisms as the same as soil behavior regarding on both of strength and stiffness. The stress levels in a small scale model under Earth’s gravity (1 g model) are much lower than those in real structure apparently causing different soil behaviors. In order to solve outline problems, the geotechnical centrifuge was proposed in this case in which soil models placed at the platform of a centrifuge that can be accelerated up to designed artificial acceleration as gravitational acceleration thank to increasing inertial radial acceleration field.
In fact, the geotechnical centrifuge principle tries to perform fake full scale modeling with the same stress condition in reality. If the soil material used in the model is the same as that in the actual one, with a careful model preparation procedure is made to ensure the soil structure to be duplicated, then for a centrifuge model subjected to an inertial acceleration field of times Earth’s gravity the vertical stress at depth will be identical to that in the corresponding prototype at depth where ; i.e., that similar stress is achieved at the corresponding points. The modeling centrifuge provides advantages for geotechnical engineering in which a full scale structure can be examined by a scaled-down model while the required stress states describe appropriate soil behaviors or field situation properties of interest. NCU geotechnical centrifuge has a 3 m radius and a hydraulic shaking table is used to recreate seismic motions in one direction. The laminar box is made by 38 rings of aluminum and coefficient of friction of approximately 0.01 between two rings. The dimensions of soil sample are 419 mm in length, 203 mm in width and 300 mm in height, respectively.
A fine quartz sand was used as the material with averaged permeability of 6.4×10⁻⁵ m/sec, mean size () of 0.19 mm and effective size () of 0.15 mm constructed via pluviation process of one by one of sand layer to place transducers at specified elevation. Thereby, relative density () of sand deposit could be easily controlled around 55 % in this case by controlling the volume and the weight of sand. In model Test 3, sand pile drain material was used of quartz sand having permeability coefficient of 7.7×10⁻⁵ m/sec, of 0.5 mm and of 0.2 mm. The methocel cellulose ether fluid was used in order to imitate ground water in model spinning in high g level acceleration field; therefore, the model pore fluid is times more viscous than prototype to match dynamic and consolidation time scaling relations.
3. Model preparation and test procedure
In this study, three saturated sandy soil models were prepared without and with improved areas of drain belt and sand pile drain systems, respectively. The purpose of this study was to investigate the seismic effect of vertical drain systems on liquefiable sandy soil deposit during and after strong shaking. The uniform soil deposit was built by pluviating dry sand from a hopper with a drop height of 600 mm and with a regular path procedure as described in Fig. 1. After preparation of sand backfill model, the air was then continuously vacuumed out from the inside of container and de-air viscous fluid of methylcellulose was carefully dripped into the container at the same time to saturate the sand.
Fig. 1Path of sand pluviation
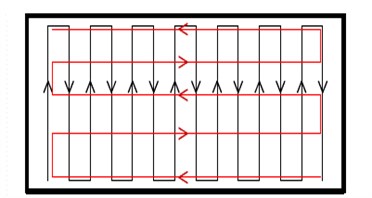
Table 1Shear wave velocities of the sandy ground
Test No. | Relative density (%) | Shear wave velocity (m/sec) | |
A23-A13 | A11-A1 | ||
Test 1 | 55 | 181 | 263 |
Test 2 | 55 | 204 | 195 |
Test 3 | 55 | 230 | 184 |
Fig. 2The arrangement of model Test 1
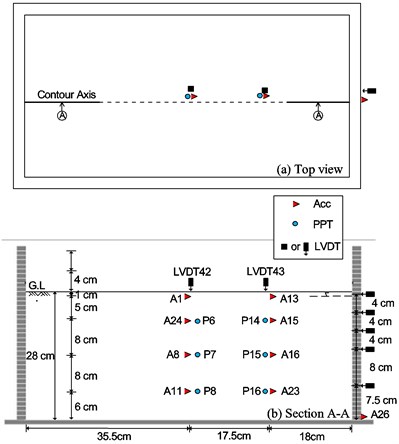
Fig. 3The arrangement of model Test 2
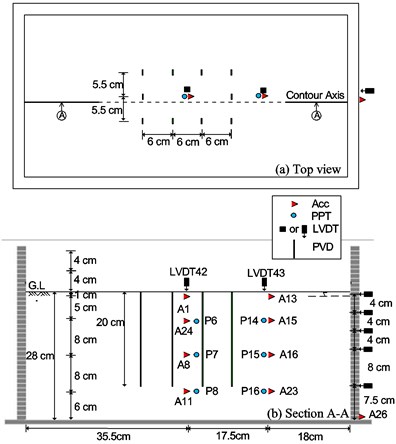
Three models have 280 mm of height in model type (corresponding to 22.4 m in prototype scale), other dimensions were fitted with dimensions of container. Figs. 2, 3 and 4 shows the top view and cross section of models in which indicate model profile, location of sensors as well as linear variable differential transformers (LVDTs) to monitor the trend of excess pore water pressure, acceleration history, settlement of ground surface, and horizontal displacement of model along depth during and after shaking. The same backfill was constructed in model Test 2, but some geosynthetic belt drains were installed into sandy ground reaching depth of 220 mm (17.6 m in prototype scale) as shown in Fig. 5(a). Similarity, model Test 3 was set up as Test 2 but geosynthetic belt drains were totally replaced by alternative sand pile drains as shown in Fig. 5(b). Nevertheless, it is very important to ensure how vertical the sand pile is or how accuracy of using hand to install to the saturated sandy ground. The excavated cross section of model Test 3 are shown in Fig. 6 and proving that the sand piles were installed vertically and would not influence the test results due to error installation. Thereby, the results were expected that treated model of drain systems can show much more benefit in which geosynthetic belt drains or sand pile drains were placed in distance of 55 mm along width of container and 60 mm along length of container. In the future, there will be a multi-stories structure on the ground surface and within the annularity arranged by vertical systems to investigate the effect of vertical drain systems on the deformation of building.
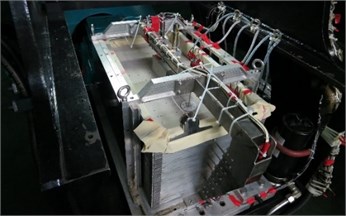
The completed model had been accomplished with horizontal and vertical LVDTs and assemble on the shaking table as shown in Fig. 7. Then, the modeling centrifuge was accelerated step by step up to 80 g, and the increment of acceleration in each step is 10 g. The model was maintained and lasted for 3 minutes at each step to ensure the consolidation of model at current overburden pressure. At 80 g, the model was detected by pre-shaking technique [20] and then excited by a one-dimensional sinusoidal input waves with 15 cycles and amplitude of about 0.4 g.
Fig. 4The arrangement of model Test 3
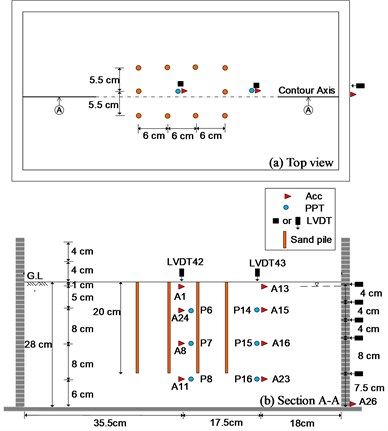
Fig. 5Installation of (a) belts and (b) sand piles
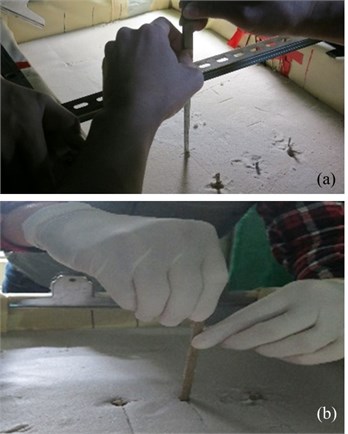
Fig. 6Cross section of sand pile drains
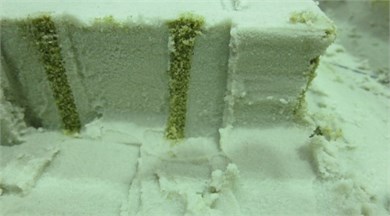
Fig. 7Completed model
4. Test results and analysis
4.1. Fundamental properties of models by pre-shaking technique
Several small shaking events with different frequency were used to detect shear wave velocities and the natural frequency of soil ground before and after the main shaking events. Furthermore, there are two ways to determine natural frequency by Fast Fourier Transform transferring time domain to frequency domain and by shear wave velocity in model to compare and ensure the accuracy of those values as well. By the difference of first arrival time of shear wave between two accelerometers, theoretical value of shear wave velocity in soil could be evaluated, as described in Table 1, which can be used to briefly predict the natural frequency of soil by the formula , where is the shear wave velocity and H is the thickness of soil layer. The frequency at the first peak of Fourier spectrum is around 2.0 Hz, is probably the natural frequency of soil foundation even though there are still other peak values behind that, but the first peak value show that the amplification of acceleration through layers smoothly.
On the other hand, the natural frequency also can be found by Fast Fourier Transform (FFT) of the time history of free vibration as shown in Fig. 8. The use of FFT to transfer the acceleration time history to the frequency domain, then the frequency with peak amplitude probably most dangerous in real site ought to be natural frequency. For the soil ground with relative density of 55 % and depth of 22.4 m is about 1.9 Hz.
The natural frequency of each case was shown in which the shear wave propagation between accelerometers A11-A1 (center of vertical drain system) and A23-A16 (outside of vertical drain system), respectively as shown in Table 2 that summarizes the natural frequencies calculated from the theoretical formula and obtained from the FFT of small shaking events, S1 and S3. The theoretical value is closed to the result of s1 event. The natural frequency of models are almost the same in each case of events and the natural frequency of the system increases with the increasing relative density of model. The shear wave velocity of soil layer increases with the increasing relative density or increasing soil stiffness caused by vertical drain presence.
Fig. 8Fourier amplitude result from pre-shaking event S1-1 Hz
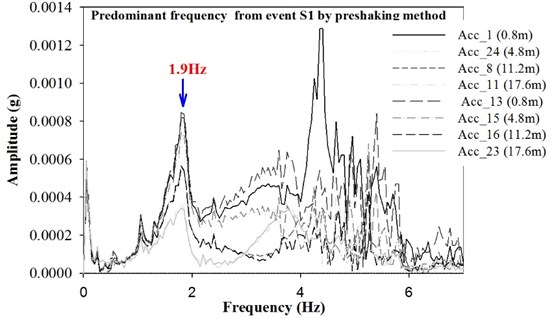
Table 2Determining natural frequency of soil via pre-shaking and theoretical method
Test 1-Free Field | S1-1 Hz | S1-2 Hz | S1-3 Hz | S3-1 Hz | S3-2 Hz | S3-3 Hz | |
Pre-Shaking | 1.6 | 1.8 | 1.9 | 1.5 | 1.7 | 1.7 | |
Theoretical value | A13-A23 | 2.4 | 2.2 | 1.6 | 2.3 | 1.9 | 1.6 |
A1-A211 | 2.3 | 2.3 | 2.0 | 2.2 | 2.2 | 2.1 | |
Test 2-Drainage Belt | S1-1 Hz | S1-2 Hz | S1-3 Hz | S3-1 Hz | S3-2 Hz | S3-3 Hz | |
Pre-Shaking | 1.5 | 1.7 | 1.8 | 1.5 | 1.7 | 1.7 | |
Theoretical value | A13-A23 | 2.1 | 2.0 | 1.9 | 2.0 | 2.2 | 2.0 |
A1-A211 | 2.3 | 2.0 | 1.9 | 2.1 | 2.2 | 2.1 | |
Test 3-Sand Pile | S1-1 Hz | S1-2 Hz | S1-3 Hz | S3-1 Hz | S3-2 Hz | S3-3 Hz | |
Pre-Shaking | 1.4 | 1.7 | 1.9 | 1.5 | 1.7 | 1.8 | |
Theoretical value | A13-A23 | 1.9 | 2.0 | 1.9 | 2.0 | 1.8 | 1.8 |
A1-A211 | 1.5 | 1.8 | 1.7 | 2.4 | 2.1 | 2.0 | |
4.2. Excess Pore water pressure time history
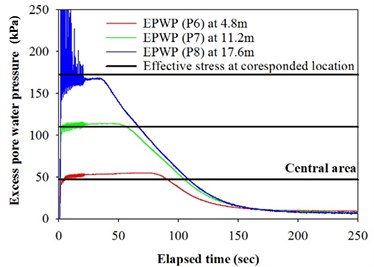
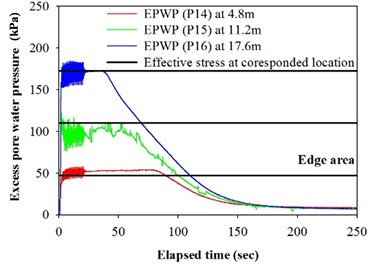
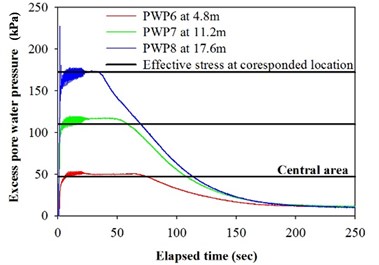
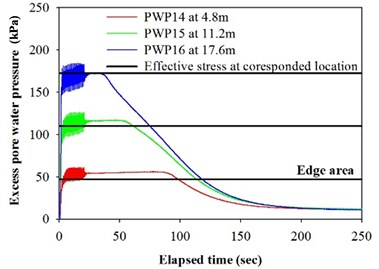
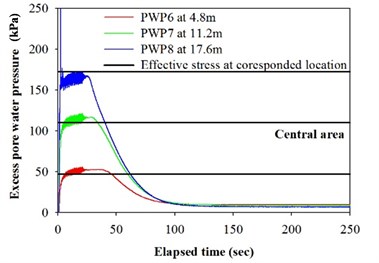
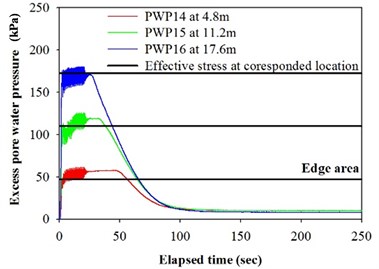
Figs. 9, 10 and 11 show the excess pore water pressure time history of main shaking, S2, for three model in which the horizontal line represent for constant effective stress to compare with excess pore water pressure at different depth in order to observe whether liquefaction occur or not. The effective overburden pressure was calculated according to the original buried depth of pore pressure transducers associated with excess pore water pressure history curve as shown. The horizontal axis is elapsed time and zero means the start of shaking. During the main shaking, the excess pore water pressure generated drastically, especially at the beginning of shaking at bottom of model. The series of test results in pore water pressure between center and edge area with three tests with and without improvement of drain systems in which pore water pressure was constructed versus time of each layer including surface, middle and bottom layer from sensors. As excess pore water pressure curve overlapped the horizontal straight line showing literally that ratio of excess pore water pressure, , would be greater than 1 pointing liquefaction was happening.
For the model Test 1 shown in Fig. 9, excess pore water pressure generated during main shaking and dissipated subsequently after shaking. The excess pore water pressure at lower layer dissipates earlier than those of the others shallower positions and goes on till completely dissipation. In the contrary, the excess pore water pressure of upper layer maintains high condition for longer time because the pore fluid continued flows upward to the ground surface, and it is the only way to dissipate because of the impermeability boundary of model container. However, during the dissipation period, lower layer takes longer time to reduce its excess pore water pressure than shallower layer till it completely dissipates. All the excess pore water pressures would decrease to a constant certain residual values which are the increase of static hydraulic pressure caused by the settlement of sensors during soil liquefaction.
Fig. 9Excess pore water pressure and effective stress at different depth for model Test 1
c) Central area
b) Edge area
For the model Test 2 as shown in Fig. 10, it points out that the similar consensus in which pore pressure get over effective overburden stress soon at the 2.6 second for the depth of 17.6 m at edge area. Liquefaction occurs likewise at around the 3.4 second for the depth of 11.2 m and 4.8 m at edge area. Area with treating of geosynthetic belt material, liquefaction do not happen until the 4.1 second at 11.2 m. The soil at the other two depths liquefies at the 6.3 second and maintain short time. Although excess pore water pressure of soil outside the treating area, or called free field after, reaches effective overburden stress sooner than area with treating, but the improved area is earlier to dissipate and to drain out. In fact, liquefaction phenomena at those depth of 4.8 m, 11.2 m and 17.6 m are stopped at the 74.8 second, 58.9 second and 34.5 second, respectively, whereas those time of free field are the 98.5 second, 61.1 second and 28.7 second from deeper to upper layer, respectively. It confirms that fluid flows upward from bottom faster than others because of vertical drain system. The layer nearby surface take longest to be out of liquefaction might be caused by waiting for obstacle fluid on the surface to dissipate.
In addition, for the model Test 3 with improvement method of sand pile drain system, it is clear to compare between two case of with and without sand pile drain in term of excess pore water pressure. As in Fig. 11, with the treated area of sand pile drain, the time of starting liquefaction is the 3.5 second, 4.8 second and 5.8 second from lower to upper depth and start to dissipate at the 22.4 second, 43.4 second and 73.7 second, respectively. On the other hand, at the free field of model, whole observation about those time would be longer significantly. The beginning time of liquefaction are at the 2.5 second of 17.6 m depth, the 3.7 second of 11.2 m depth, at the 3.4 second of 4.8 m, respectively. The times start to dissipate are at the 37.8 second at 17.6 m, the 57.9 second at 11.2 m and the 96.9 second at 4.8 m.
Fig. 10Excess pore water pressure and effective stress at different depth for model Test 2
c) Central area
b) Edge area
Fig. 11Excess pore water pressure and effective stress at different depth for model Test 3
c) Central area
b) Edge area
In terms of excess pore water pressure, the trend of each models are similar such as deeper layer would maintain liquefaction period shorter than those at shallower positions, soil near the surface liquefies and keeps for longer period. For the model Test 3 with sand pile drains, the dissipation period could be reduced. Table 3 gives liquefaction and dissipation periods for each model, thereby, the observation about drain system’s benefit could be more clearly and accurate. Each cell includes two values: first one is period normalized by liquefaction duration at depth of 17.6 m at center area for main shaking event, second one indicated in the parenthesis was duration with unit of second. It shows that the comparison of liquefaction duration or dissipation period to determine somewhat excess pore water pressure whether being apparently reduced. Generally, it is concluded that the drain has been unable to prevent liquefaction but it was recognized that duration of liquefaction and dissipation could be dramatically reduced by comparison of those value among various kinds of improvement methods. However, because of using the viscous fluid as saturated material in the modeling, the permeability of foundation soil affects by the temperature significantly. The period of excess pore water pressure dissipation depends on permeability leading to be hardly to exactly suppose which sort of drain system works better during shaking. On the other hand, excess pore water pressure ratio almost reaches critical value of 1 after first cycle, perhaps vertical drain capacity is overestimated in design for drainage and it should be considered carefully in prospective work to get better point of view regarding vertical drain performance in liquefiable ground [21]. As a matter of fact, liquefaction period as well as dissipation period could be decreased that may lead increasing settlement being discussed later.
Table 3Comparison of liquefaction dissipation duration among three models
Test No. | Depth (m) | Center area | Edge area | ||
Normalized liquefaction duration (real time in prototype, sec) | Normalized dissipation period (real time in prototype, sec) | Normalized liquefaction duration (real time in prototype, sec) | Normalized dissipation period (real time in prototype, sec) | ||
Test 1 Free field | 4.8 | 4.58 (87) | 7.62 (138) | 4.53 (86) | 7.32 (139) |
11.2 | 2.79 (53) | 9.05 (172) | 2.68 (51) | 9.16 (174) | |
17.6 | 1.00 (19) | 9.53 (181) | 1.68 (32) | 10.16 (193) | |
Test 2 Belt drainage | 4.8 | 2.43 (68) | 4.46 (125) | 3.39 (95) | 5.36 (150) |
11.2 | 2.00 (56) | 5.04 (141) | 2.18 (61) | 4.96 (139) | |
17.6 | 1.00 (28) | 5.93 (166) | 0.93 (26) | 6.14 (172) | |
Test 3 Sand pile | 4.8 | 3.63 (69) | 1.90 (131) | 4.89 (93) | 6.95 (132) |
11.2 | 2.00 (38) | 2.35 (162) | 2.84 (54) | 10.32 (196) | |
17.6 | 1.00 (19) | 2.60 (181) | 1.84 (35) | 11.32 (215) | |
Table 4Settlement and horizontal displacements of three models
Test No. | Location | ||||||
Horizontal displacement of laminar box (m) | Settlement (m) | ||||||
0.4 m | 3.6 m | 6.8 m | 10.0 m | 16.4 m | Center area | Free field | |
Test 1 -Free field | –0.3 | –0.22 | –0.18 | –0.19 | –0.18 | 0.79 | 0.62 |
Test 2 -Belt drainage | 0.87 | –0.21 | –0.21 | –0.21 | –0.2 | 0.69 | 0.54 |
Test 3 -Sand pile | 0.19 | –0.21 | –0.17 | –0.21 | –0.14 | 0.74 | 0.68 |
4.3. Settlement of ground surface
During the main shaking event, two LVDTs were placed on the top of model to measure the settlements at center and edge areas. Five LVDTs were setup aside of laminar box to recorded the horizontal displacement along depth of model as in Fig. 2, with corresponding to the depth of 0.4 m, 3.6 m, 6.8 m, 10.0 m and 16.4 m under the ground surface. Table 4 summarizes the measurements of each model in prototype scale to briefly show the horizontal displacements and settlements due to main seismic event. Generally, in term of horizontal displacement, the largest values frequently occurred at ground surface or nearby that might be caused by soil liquefaction and initial force of base shaking.
Generally, ground surface settled dramatically during shaking and slightly rise up till dissipation implementation, the dissipation implementation was anticipated as no more increasing settlement. In fact, vertical drain systems were expected to restrict excess pore water pressure generation and liquefaction phenomena leading diminish then surface settlement [22, 23]. Indeed, Surface settlement at center area surrounded by vertical drains is always smaller than that of edge area in the same test. It is recognized that total settlement of ground surface area of Test 1 greater than Test 2 and Test 3 at center, whereas settlement at edge area of Test 3 greater than Test 1 as reliable results of environmental temperature influence excess pore water pressure as discuss in previous section of excess pore water pressure result. It likely gives more evidences to prove the advantage of vertical drains in term of reducing surface settlement of ground during earthquake in adverse condition. In reality, deformation in almost case would be decreased with increasing relative density of soil. Therefore, a modeling building would be placed on the ground surface within treading area in the future. With loading on the ground surface would lead to higher effective stress and denser soil for the soil under building which would decrease the differential settlement and benefit to the vibration and deformation of structure.
5. Conclusions
The centrifugal shaking table tests was performed in which liquefiable soil models treated via vertical drain of geosynthetic material and sand pile system as countermeasures to illustrate the behaviors that are important for predicting the performance of treated site. Firstly, predominant frequency was determined by pre-shaking technique and Fast Fourier Transform method to ensure the good agreement of characteristics of soil ground between different methods. The excess pore water pressure generation and dissipation, and ground deformation were monitored during testing. The effectiveness of vertical drain systems as a liquefaction remediation technique was assessed on the basis of comparisons of the excess pore water pressure and deformation responses between free field and improved area.
According to the test results, though liquefaction could be not completely prevented by drain systems, it can be observed that drains were effective in dissipating the excess pore water pressures both during and after shaking and decreasing ground surface settlement. The deeper soil strata take longer time to dissipate might be due to waiting for fluid on upper layer. Seemingly, the fluid flow capacity of vertical drain system is overestimated in design. Therefore, the influence of diameter and spacing of those vertical drains should be considered carefully to increase dissipated rate from deep soil layer.
Because of using viscous fluid instead of water to simulate the excess pore water pressure generation and dissipation behaviors, temperature of testing environment should be consider which affects the permeability significantly.
References
-
Kishida H. Damage to reinforced concrete buildings in Niigata city with special reference to foundation engineering. Soils and Foundations, Vol. 6, Issue 1, 1966, p. 71-88.
-
Adachi T., Iwai S., Yasui M., Sato Y. Settlement of inclination of reinforced concrete buildings in Dagupan city due to liquefaction during 1990 Philippine earthquake. Proceedings of the 10th World Conference on Earthquake Engineering, Balkema, Rotterdam, The Netherlands, 1992, p. 147-152.
-
Chi-chi, Taiwan, Earthquake of September 21, 1999, Reconnaissance Report. Earthquake Engineering Research Institute (EERI), Earthquake Spectra, 2001.
-
Kocaeli. Turkey, Earthquake of August 17, 1999 Reconnaissance Report. Earthquake Engineering Research Institute (EERI), Earthquake Spectra, 2000.
-
Off the Pacific Coast of Tohoku Earthquake, Strong Ground Motion. National Research Institute for earth Science and Disaster Prevention (NIED), Tsukuba, Japan, 2011.
-
Brennan A. J., Madabhushi S. P. G. Effectiveness of vertical drains in mitigation of liquefaction. Soil Dynamics and Earthquake Engineering, Vol. 22, 2002, p. 1059-1065.
-
Hamedi A., Marandi S. M. Laboratory studies on the effect of vertical gravel column drains on liquefaction potential. International Journal of Engineering Transactions B: Applications, Vol. 24, Issue 3, 2011, p. 209-225.
-
Sadrekarimi A., Ghalandarzadeh A. Evaluation of gravel drains and compacted sand piles in mitigating liquefaction. Ground Improvement, Vol. 9, Issue 3, 2005, p. 91-104.
-
Papadimitriou A., Moutsopoulou M. E., Bouckovalas G., Brennan A. Numerical investigation of liquefaction mitigation using gravel grains. Proceedings of the Fourth International Conference on Earthquake Geotechnical Engineering, Thessaloniki, Greece, 2007, p. 1548.
-
Krishna A. M., Madhav M. R. Engineering of ground for liquefaction mitigation using granular columnar inclusions: recent developments. American Journal of Engineering and Applied Sciences, Vol. 2, Issue 3, 2009, p. 526-536.
-
Seed H. B., Booker J. R. Stabilization of potentially liquefiable sand deposits using gravel drains. Journal of the Geotechnical Engineering Division, Vol. 103, Issue 7, 1977, p. 757-768.
-
Tokimatsu K., Yoshimi Y. Effects of vertical drains on the bearing capacity of saturated sand during earthquakes. Proceedings of the International Conference on Soil Engineering for Protection from Natural Disasters, Asian Institute of Technology, 1980, p. 643-655.
-
Boulanger R., Idriss I., Stewart D., Hashash Y., Schmidt B. Drainage capacity of stone columns or gravel drains for mitigating liquefaction. ASCE Geotechnical Special Publication, Vol. 75, Issue 1, 1998, p. 678-690.
-
Brennan A. J., Madabhushi S. P. G. Effectiveness of vertical drains in mitigation of liquefaction. Soil Dynamics and Earthquake Engineering, Vol. 22, Issues 9-12, 2002, p. 1059-1065.
-
Priebe H. J. The prevention of liquefaction by vibro replacement. Proceedings of the 2nd International Conference on Earthquake Resistant Construction and Design, Rotterdam, The Netherlands, 1991, p. 211-219.
-
Baez J. I., Martin G. R. Permeability and shear wave velocity of vibro-replacement stone columns. Geotechnical Special Publications, Vol. 49, 1995, p. 66-81.
-
Shenthan T., Nashed R., Thevanayagam S., Martin G. R. Liquefaction mitigation in silty soils using composite stone columns and dynamic compaction. Earthquake Engineering and Engineering Vibration, Vol. 3, Issue 1, 2004, p. 39-50.
-
Saito A., Taghawa K., Tamura T., Oishi H., Nagayama H., Shimaoka H. A countermeasure for sand liquefaction: gravel drain method. Nippon Kokan Technical Report Overseas, Vol. 51, 1987, p. 46-52.
-
Saito A., Ito K., Oishi H. Development of gravel drain systems as a remedial measure for soil liquefaction. Proceedings of the Japanese Society of Civil Engineering, 1991, p. 41-46.
-
Lee C. J., Hung W. Y., Tsai C. H., Chen T., Tu Y., Huang C. C. Shear wave velocity measurements and soil–pile system identifications in dynamic centrifuge tests. Bulletin Earthquake Engineering, Vol. 12, 2014, p. 717-734.
-
Sasaki Y., Taniguchi E. Shaking table tests on gravel drains to prevent liquefaction of sand deposits. Soils and Foundations, Vol. 22, Issue 3, 1982, p. 1-14.
-
Ishihara K., Yamazaki F. Cyclic simple shear tests on saturated sand in multi-directional loading. Soils and Foundations, Vol. 20, Issue 1, 1980, p. 49-59.
-
Tatsuoka F., Sasaki T., Yamada S. Settlement on saturated sands induced by cyclic undrained simple shear. 8th World Conference on Earthquake Engineering, San Francisco, CA, Vol. 3, 1984, p. 95-102.
Cited by
About this article
The authors would like to express their gratitude for the financial supports from the National Science Council (NSC 102-2221-E-492-029). These supports make this study and the future researches possible.
