Abstract
Aiming at the difficulty in obtaining the eigenfrequency of the vibration component of rolling bearing faults in a strong background noise environment and the problem of extraction efficiency, the adaptive chirp mode decomposition (ACMD) combined with Improved maximum second-order cyclostationary blind deconvolution (ICYCBD) fault feature extraction algorithm is proposed. Firstly, to improve the signal-to-noise ratio, the original signal is adaptively decomposed using the ACMD method, and the optimal components are selected based on the principle of maximizing the correlation gini coefficient index. Secondly, to improve the accuracy of parameter setting and extraction efficiency, an improved CYCBD method is proposed to estimate the cyclic frequency set of CYCBD using the proposed enhanced energy harmonic product spectrum (EEHPS) method for the optimal components, the envelope spectrum peak factor index is improved by proposing the envelope spectral period pulse factor (EPPF) index, and the filtering length of the CYCBD is selected adaptively using the step search to obtain the optimized filtered signal. Finally, the envelope spectrum analysis is carried out to extract the fault information accurately. The simulation signals and experimental data show that the method can quickly and accurately extract the fault characteristics of rolling bearings under strong background noise, and the comparison with other methods shows the effectiveness and superiority of the proposed method.
1. Introduction
As one of the key moving parts in mechanical equipment, rolling bearings play an important role in the mechanical transmission system, are involved in a variety of industries, and are the basis and guarantee of mechanical operation. However, due to long time operation and working environment, rolling bearings often have a series of failures. If these failures are not detected and diagnosed in time, they may lead to accidents and property losses, seriously affecting productivity and safety. However, affected by environmental noise and other factors, fault information is often difficult to extract. Therefore, how to be able to quickly and accurately identify rolling bearing fault characteristics for the development of maintenance plans and improve equipment reliability is of great significance [1, 2].
In recent years, blind deconvolution algorithms have been widely used in early faults. The principle of the blind deconvolution method is to extract the source signal of the fault impulse through the process of back-convolution of the signal. Minimum entropy deconvolution (MED) is an earlier blind deconvolution method applied in the field of fault diagnosis, and Wang et al. [3] used the MED technique applied to weak fault feature extraction of rolling bearings. However, MED is used in rolling bearing fault diagnosis, the individual pulses that may occur are not the periodic pulses caused by faults [4]. To overcome the drawbacks of MED, Mcdonald et al. [5] proposed the maximum correlation Kurtosis deconvolution (MCKD), which can highlight continuous pulses that are flooded by noise and has a good noise reduction effect [6]. However, MCKD is affected by the number of displacements, can only locally extract a limited number of impact pulses, and requires more parameters to be input, so the method has some limitations. Buzzoni et al. [7] proposed the maximum second-order cyclostationary blind deconvolution (CYCBD), which solves the problem that MCKD can only locally extract a finite number of pulses by taking advantage of the fact that bearing vibration signals are cyclically stable. Compared to MED and MCKD methods, CYCBD can extract continuous-period pulses and enhance the pulse amplitude [8]. The CYCBD algorithm is suitable for the fault diagnosis of localized damage of gears, which can effectively extract the fault impact components from the signal, but it needs to set the cycle frequency set, the filtering length, and these two important parameters in advance according to the a priori knowledge to have a better diagnostic effect [9]. To address this problem, Ma et al. [10] optimized the parameters of the CYCBD algorithm using the sparrow search optimization algorithm, and Lin et al. [11] optimized the parameters of the CYCBD algorithm using the improved envelope spectral fault characteristic ratio metrics as the fitness function of the particle swarm algorithm. However, the high computational complexity of the optimization algorithm will lead to a long algorithm time, while it may fall into the local optimum.
Considering the interference situation of strong background noise, suitable methods should be selected to preprocess the signal before deconvolution to improve the signal-to-noise ratio. Whereas rolling bearing signals have nonstationary and nonlinear characteristics, adaptive time-frequency analysis methods provide greater flexibility and accuracy in dealing with nonstationary and nonlinear signals [12]. Among these methods, empirical modal decomposition [13], local average decomposition [14], and ensemble empirical modal decomposition [15] have made significant research progress in the field of time-frequency analysis. However, these methods often encounter problems related to mode aliasing and endpoint effects when dealing with nonstationary signals [16]. The variational modal decomposition (VMD) [17] does not use a recursive sieve structure but rather obtains the components by solving a variational problem with successive iterative updates in the frequency domain. It overcomes the endpoint effect and some modal aliasing problems [18], but the VMD relies on a priori modal quantity judgment and is less reliable. For this reason, Chen et al. [19]. proposed adaptive chirp mode decomposition (ACMD), which extracts the signal modes one by one by recursive decomposition without an a priori mode number. It can eliminate irrelevant components and noise interference, improve the accuracy of fault diagnosis, and greatly reduce the algorithm time.
In summary, this paper proposes ACMD combined with the improved CYCBD algorithm for the two problems of difficult-to-extract fault information and extraction efficiency under strong background noise interference. The method mainly obtains a number of signal modal components through ACMD and selects the optimal components according to the correlation Gini coefficient to reduce the influence of noise. Subsequently, the optimal components are processed using the improved CYCBD method, and on the one hand, for the case where the signal cyclic frequency is unknown, a cyclic frequency estimation method based on Teager’s energy operator combined with the improved harmonic product spectrum, referred to as the enhanced energy harmonic product spectrum, is proposed [20, 21]. On the other hand, for the optimization problem of CYCBD filter length, the index of envelope spectral peak factor is improved, the index of envelope cycle pulse factor is proposed [22], and the filter length is determined by using step search. The experimental results prove that the method successfully realizes the successful realization of fault feature extraction, therefore, this study can provide a useful reference for rolling bearing fault diagnosis. The main contributions of the work are as follows:
1) Noise reduction by preprocessing with the ACMD algorithm improves the accuracy and reliability of bearing fault diagnosis. The maximum principle of the correlation Gini coefficient index is proposed to select the signal modal components, which improves the selection mechanism and adaptivity of the sensitive signal components The potential problem of insufficient extraction of bearing fault feature information is solved, to improve the reliability of cycle frequency estimation of CYCBD.
2) The improved CYCBD method is used to filter the signal after ACMD noise reduction, and the rolling bearing fault feature extraction is completed quickly and accurately. Simulated signals are used to study the influence of CYCBD parameters on the filtering effect. The optimization method combining the enhanced energy harmonic product spectrum, and the envelope period pulse factor avoids the problems of long-time and local optimization using the optimization algorithm. Comparison with other methods is made to verify the effectiveness and superiority of the present method.
This paper is structured as follows: Section 2 introduces the basic principles of ACMD, CYCBD, improved CYCBD, and related Gini coefficients, Section 3 describes the steps to implement the method in this paper, Section 4 verifies the effect of CYCBD parameters and the effectiveness of the proposed method through simulation, Section 5 verifies the validity and superiority of the method in this paper by comparing the experimental signals with other methods, and Section 6 draws conclusions based on the simulation and experimental conclusions are drawn based on the simulation and experimental results.
2. Theoretical background
2.1. ACMD Principle
The ACMD approach makes its execution process very adaptive and smooth by iterating over the components layer by layer. Assuming that the nonstationary signal contains signal components, the mathematical model is:
where: , denote the instantaneous amplitude and frequency of the -th signal component, respectively; denote the phase of the th signal component. Based on the use of modulation and demodulation techniques, a broadband signal is transformed into a number of narrowband signals. The demodulation result is:
Among them:
where: and are the two demodulated signals; and are the demodulation operators; is the frequency function of the demodulation operator; and the instantaneous amplitude of the th signal component.
The instantaneous frequency of the th signal component is ; when is equal to the actual instantaneous frequency the FM term of the demodulated signal can be completely removed, thus obtaining a pure amplitude modulated signal containing the narrowest frequency band. Therefore, ACMD extracts the target component and estimates the instantaneous frequency of the component by minimizing the bandwidths of and . The ACMD is a simple and efficient method for estimating the instantaneous frequency of the component.
The original signal of ACMD decomposition will be continuously updated, which is based on the principle that the original signal is subtracted from the extracted th component to get the remaining signal . The decomposition will be continued by using the original signal for the next step of decomposition. decompositions are performed and the signal is decomposed as:
Set the algorithm termination condition so that the algorithm ends when the ratio of energy to energy reaches a threshold value.
2.2. CYCBD Principle
The CYCBD algorithm focuses on the process of finding an inverse filter h such that the source signal is recovered from the noisy observed signal [7]. The formula is shown below:
where ∗ is the convolution operator, is the estimated signal input, and g is the unknown pulse.
The second-order cyclic smoothness ( ) index is defined as follows:
where and are the weighted correlation matrix and the correlation matrix, respectively, and W is the weighting matrix, which can be expressed as:
A signal containing a periodic component is called and has the following expression:
Which, is the source signal length; is the filter length, is the number of samples, and is the fault period, which is related to the fault frequency. Therefore, the set of cycle frequencies of discrete-time signals is set as:
Solving for the value is equivalent to solving a generalized eigenvalue problem, where the maximum value should be solved for the maximum eigenvalue, that is:
2.3. Correlation Gini coefficient index
The ACMD algorithm is used to decompose the original signal into a series of modal components, which contain more fault characteristic information, but also noise information and spurious decomposition. To screen out the effective modal components, the Gini coefficient is characterized by robustness under interference conditions, but the Gini coefficient index cannot distinguish the false components. While the correlation coefficient can reflect the correlation between the components and the original signal and can well eliminate irrelevant spurious components. Therefore, to overcome the limitations of both, the correlation Gini coefficient index is introduced, and its expression is as follows:
where is the correlation Gini coefficient index, is the Pearson correlation coefficient, is the Gini coefficient, denotes Paradigm , is the squared-enveloped discrete time series, is the length of , and denotes the ascending sequence.
2.4. ICYCBD principle
2.4.1. Enhanced energy harmonic product spectrum
Harmonic Product Spectrum (HPS) is a method used to extract features of periodic signals, using features in the frequency domain to reveal harmonic components and fundamental frequencies in the signal [23]. This method is often used in speech signal processing, usually for the extraction of fundamental frequency traces. By applying HPS, we can accurately capture and highlight the harmonic components in the signal, thus revealing critical information. Its mathematical definition is as follows:
where is the amplitude spectrum and denotes the number of harmonics considered.
The cyclic frequency is correlated with the fault frequency, so the cyclic frequency estimation can be realized by applying HPS to rolling bearing fault signals, but studies have shown that there are two problems in applying the traditional harmonic product spectrum to directly analyze the vibration signals: it is susceptible to the interference of the background noise and it is subject to the high-frequency noise that leads to the higher-order harmonic distortions in the frequency domain.
To solve these problems, the enhanced energy product spectrum (EEHPS) method is proposed based on the Teager energy operator combined with the improved harmonic product spectrum. By demodulating the signal using the Teager energy operator followed by spectral analysis, this method can transfer the frequency analysis from the high resonance frequency range to the very low fault frequency range, reduce the influence of higher-order harmonics, simplify the signal, and at the same time be able to increase the fault impact component and suppress part of the noise.
The Teager energy operator is a nonlinear operator that efficiently extracts the instantaneous energy of a signal [20]. For a discrete signal , it is defined in differential estimation as:
As can be seen from the above equation, the Teager energy operator takes into account the instantaneous frequency, is more sensitive to the transient components of the signal, and is therefore suitable for highlighting the shock components of the signal and suppressing some of the noise.
Regarding the interference of background noise, Zhao et al. [21] proposed an improved method by dimensionless processing of HPS and considering background noise. The EEHPS method is based on the Teager energy operator combined with an improved harmonic product spectrum. The mathematical expression is given below:
where is the average noise value around , is the number of harmonics, and where is the amplitude spectrum after the Teager energy operator processing. Through the improvement, the interference of background noise can be effectively reduced, and the characteristic information in the signal can be revealed more clearly, which further improves the reliability and accuracy of vibration signal analysis. The method can directly analyze the vibration signal and is more sensitive to the periodic pulse.
2.4.2. Envelope spectral period pulse factor index
Typically, determining the optimal filter length requires adaptive selection based on empirical or predefined metrics in a search iteration method. Therefore, in selecting the appropriate filter length, suitable metrics need to be identified for adaptive selection.
Zhang et al. [22]. proposed a new indicator Crest factor of envelope spectrum (EC), which is defined as the ratio of the maximum value of the envelope spectrum to the effective value, and illustrated its superiority. Liu et al. [24]. used this indicator for the optimization of CYCBD parameters based on the particle swarm algorithm. However, this index only takes into account the peak characteristics of the signal and does not take into account the periodic pulse component, which cannot reflect the periodicity of the signal, while the rolling bearing fault signal is periodic.
In view of the problem of applying this indicator to rolling bearing fault signals, the EC indicator is improved to propose the EPPF indicator, which is defined as the ratio of the effective value of the pulse of the first n envelope spectral cycles to the effective value of the envelope spectrum. The mathematical expression is as follows:
where, is the number of cycle pulses corresponding to the maximum peak of the envelope spectrum, is the root mean square of the first n cycle pulses, and is the root mean square value of the envelope spectrum. This index can better reflect the rolling bearing fault signal periodicity. is a dimensionless index, the larger its value, the better the signal periodicity.
Considering that the filter length is too large, the computation time becomes longer, and the filter length is too small to effectively perform noise reduction. The step search method is used to find the optimization with EPPF as the index, and to prevent the filter length from increasing while the index change is not obvious, resulting in the algorithm time becoming longer, the efficiency threshold and the maximum filter range are introduced.
3. ACMD-ICYCBD algorithmic design
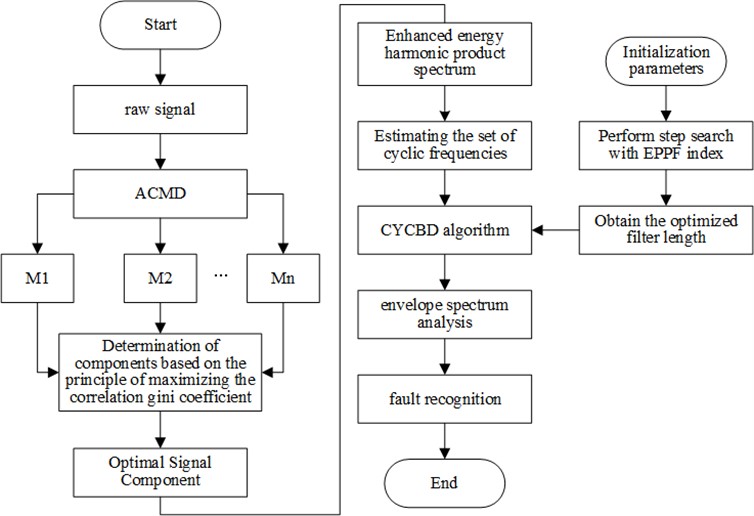
Based on the above method, to improve the accuracy and efficiency of fault information extraction in a strong background noise environment proposed, ACMD combined with the improved CYCBD method, firstly, the original signal is decomposed by using ACMD to obtain multiple components, and then the optimal components are adaptively selected by using the proposed principle of maximizing the correlation Gini coefficient index, and after that, the cyclic frequency is estimated for the optimal components by using the enhanced energy harmonic product spectra The estimated cyclic frequency set is input into the CYCBD algorithm, and the initial filter length , the step size , and the efficiency threshold are set to adaptively determine the filter length using the envelope cycle impulse factor as an indicator. Through the improved CYCBD to the optimal component of the second noise reduction, the deconvolution of the signal after the Hilbert transform to get the envelope spectrum, extract the fault characteristics, and analyze the location of the fault occurred. The flowchart of the diagnosis method is shown in Fig. 1.
Fig. 1Bearing diagnosis flow chart
4. Simulation verification
To construct a fault simulation signal for algorithm validation that contains the periodic shock components generated by rolling bearing faults, as well as harmonic signals random noise , and other interference components, the simulation signal can be expressed as follows:
where, the fault period 1/120 s, then the fault frequency is 120 Hz, damping coefficient = 0.1, displacement constant = 1, sampling frequency 12000 Hz, the bearing intrinsic frequency = 3000 Hz, the harmonic frequency = 88 Hz, the number of sampling points 12000. To emphasize the noise interference, set the signal-to-noise ratio to –15 dB.
From the time-domain waveform and envelope spectrum of the simulated signal in Fig. 2, it can be seen that the time-domain waveform is unable to recognize the impact component of the bearing fault, and there is also strong interference in the envelope spectrum, which is unable to distinguish the fault information.
Fig. 2Simulated signal
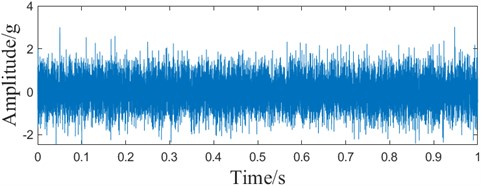
a) Time domain waveform
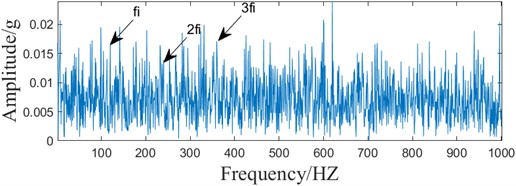
b) Envelope spectrum
To investigate the effect of CYCBD in extracting fault features at different fault feature frequencies and filter lengths, while considering the error range between the theoretical fault feature frequency and the actual fault feature frequency, the fault feature frequencies are set to be 118.8 Hz, 119.4 Hz, 120 Hz, 120.6 Hz, and 121.2 Hz, respectively, and the filter lengths are in the range of [50, 500], which are input into CYCBD for deconvolution. Every 50 steps the filter length is input into CYCBD for deconvolution. To better reflect the noise reduction ability after deconvolution, the peak signal-to-noise ratio is used as a measure of the signal after noise reduction, and the peak signal-to-noise ratio is defined as:
where is the maximum peak of the signal envelope spectrum and is the average noise value around the maximum peak.
From Fig. 3, it can be concluded that the input exact input fault frequency parameter greatly affects the noise reduction capability of CYCBD at the same filter length, and at the same input fault frequency, the filter length likewise has an impact.
In view of the above situation, it is proposed to improve the CYCBD method by using the enhanced energy harmonic product spectrum to estimate the cyclic frequency set and searching the filtering length with the envelope cycle pulse factor as the index step. According to Fig. 2, it can be seen that the fault characteristic information is seriously interfered with by the background noise, and to ensure the accuracy of the cycle frequency estimation, the ACMD algorithm is introduced to pre-process the signal for noise reduction.
Firstly, after decomposing the simulated signal into a series of modal components using the ACMD algorithm, the optimal components are selected based on the principle of the maximum correlation Gini coefficient to complete the noise reduction preprocessing. The values of the correlation Gini coefficient indexes of the decomposition of the 10 components in the ACMD are shown in Table 1, and the maximum correlation Gini coefficient is 0.4429, and the optimal components are shown in Fig. 4, which shows that some of the noises in the signal have been suppressed, but the interference part is still more, and the characteristic part is still more. disturbed part is still more, the feature extraction effect is not good.
Fig. 3Effect of input parameters on CYCBD
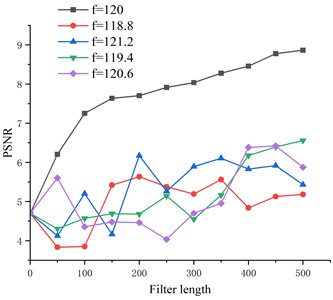
Table 1SCGI values of ACMD modal components of simulated signals
Modal component number | Modal component number | ||
1 | 0.4429 | 6 | 0.4317 |
2 | 0.4266 | 7 | 0.4173 |
3 | 0.3890 | 8 | 0.3829 |
4 | 0.4298 | 9 | 0.3829 |
5 | 0.4331 | 10 | 0.4237 |
Fig. 4The optimal component of the simulated signal ACMD
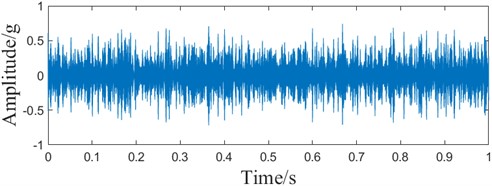
a) Time domain waveform
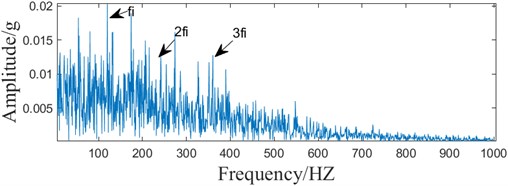
b) Envelope spectrum
To prove the superiority of the ACMD method, VMD decomposition of the emulated signal is carried out to ensure that the number of components decomposed by VMD is the same as that decomposed by ACMD. The values of the correlation Gini coefficient indexes of the 10 components decomposed in VMD are shown in Table 2, and the maximum is 0.4432. The optical components are selected by the principle of the maximum correlation Gini coefficient, as shown in Fig. 5. Compared with Fig. 4, it can be seen that the heterodyne component is more pronounced in the optimal component envelope spectrum of the VMD decomposition, although it also reduces some of the noise effects. In the benchmark speed of 3.10 GHz, 12-core CPU, memory 16 GB computer, the MATLAB R2022a environment, the ACMD algorithm time is 3.45 seconds, and the VMD algorithm time is 15.32 seconds. And the ACMD algorithm does not need a priori modal components, the comprehensive analysis shows that the ACMD decomposition has obvious superiority.
Table 2SCGI values of VMD modal components of simulated signals
Modal component number | Modal component number | ||
1 | 0.4129 | 6 | 0.4067 |
2 | 0.4369 | 7 | 0.4397 |
3 | 0.4424 | 8 | 0.4347 |
4 | 0.4385 | 9 | 0.4392 |
5 | 0.4432 | 10 | 0.4402 |
Fig. 5The optimal component of the simulated signal VMD
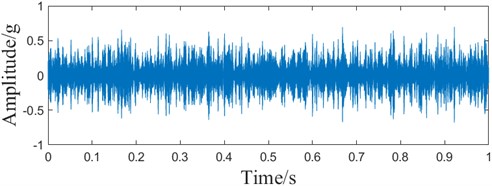
a) Time domain waveform
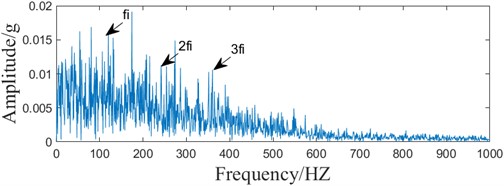
b) Envelope spectrum
To prove the feasibility of ACMD-ICYCBD, the fundamental frequency is extracted using EEHPS for the optimal component, and to avoid k is chosen too large, which affects the accuracy, and too small to reflect the periodicity, k is finally chosen to be 5, and the cyclic frequency set is estimated. As shown in Fig. 6.
Fig. 6Simulated signal enhancement energy harmonic product spectrum
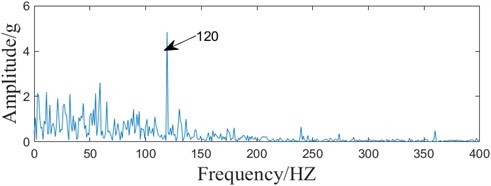
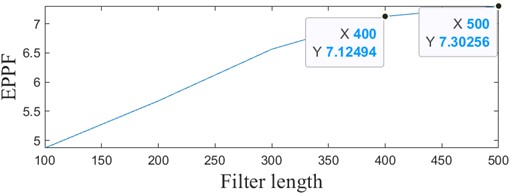
According to the enhanced energy harmonic product spectrum, the cyclic frequency set is set to [120, 240, 360...12000] adaptively, and after obtaining the cyclic frequency set, the initial filter length is set to 100, the step size is set to 100, the efficiency threshold is set to 0.2, and the maximal filter length is set to 700. the EPPF metrics are used as the objective function, and the n is selected to be consistent with the enhanced energy harmonic product spectrum . Energy Harmonic Product Spectrum k is kept consistent, and the result is shown in Fig. 7(a), and the filter length output result is 400.
Fig. 7Simulated signal ACMD-ICYCBD method
a) Variation of EPPF index of simulated signal
b) Time domain waveform
c) Envelope spectrum
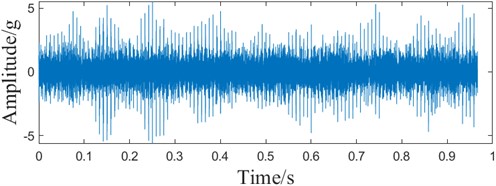
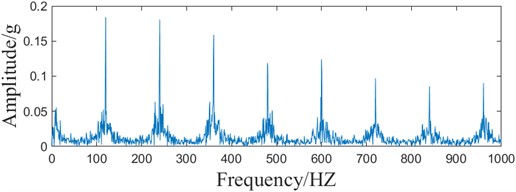
Fig. 7(b) shows that the periodic fault shock is obvious after ACMD-ICYCBD processes the simulated signal. As can be seen from Fig. 7(c), the envelope spectrum appears to have very distinct fault frequencies and their multiplicative frequencies. The comparison shows better results compared to the single ACMD algorithm processing. It also confirms that EEHPS can accurately estimate the cyclic frequency set after ACMD noise reduction. Comparison with Fig. 2(b) envelope spectrum shows that the ACMD-ICYCBD method is able to extract fault features in a strong background noise environment.
The ACMD-ICYCBD algorithm is adaptive to get the final filtering result without human intervention after inputting the signal. The overall algorithm duration is 45.42 seconds in a MATLAB R2022a environment on a computer with a benchmark speed of 3.10 GHz, a 12-core CPU, and 16 GB of RAM.
5. Experimental verification
In order to further verify the effectiveness and superiority of the actual acquired signals using the method of this paper. Rolling bearing test data were used for further analysis [25]. The experimental test platform is shown in Fig. 8, The platform consists of AC motors, motor speed controllers, rotating shafts, support bearings, hydraulic loading systems and test bearings to carry out accelerated tests of rolling bearings and to obtain cycle monitoring data of test bearings. and the specific parameters of the bearing are shown in Table 3.
Fig. 8Experimental test platform
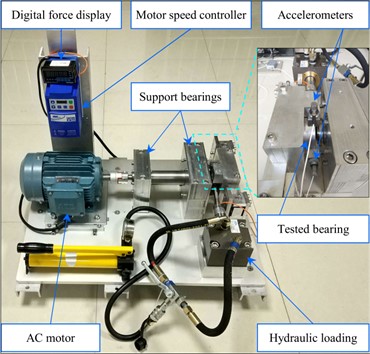
Table 3LDK UER204 bearing parameters
Parameters | Numerical value |
Inner ring diameter / mm | 29.30 |
Outer ring diameter / mm | 39.80 |
Bearing center diameter / mm | 34.55 |
Basic dynamic load rating / N | 12820 |
Ball diameter / mm | 7.92 |
Number of balls / pcs | 8 |
Basic rated static load / kN | 6.65 |
Contact angle / (°) | 0 |
Fig. 9Sampled signal
a) Time domain waveform
b) Envelope spectrum
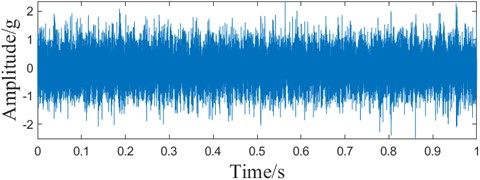
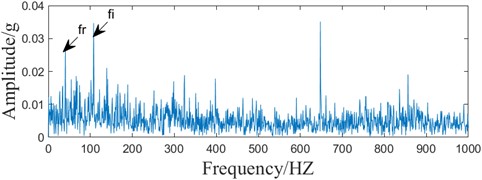
The sampling frequency of the test is 25.6 kHz, and the rotational speed is 2100 r/min. The sampled signals in the horizontal direction of the first group of outer ring faults of Bearing1_1 are analyzed. According to the fault frequency formula and parameter calculation, the theoretical fault frequency is 107.9 Hz. 25600 points are selected as the experimental sampling signals to ensure the effect of deconvolution and the time-domain waveforms and envelope spectra of the sampled signals are shown in Fig. 9.
Table 4SCGI values of ACMD modal components of sampled signals
Modal component number | Modal component number | ||
1 | 0.5080 | 7 | 0.4072 |
2 | 0.3180 | 8 | 0.3451 |
3 | 0.4379 | 9 | 0.3126 |
4 | 0.3827 | 10 | 0.3239 |
5 | 0.4422 | 11 | 0.2929 |
6 | 0.4294 | 12 | 0.4346 |
Fig. 10ACMD partially decomposed component time domain waveforms
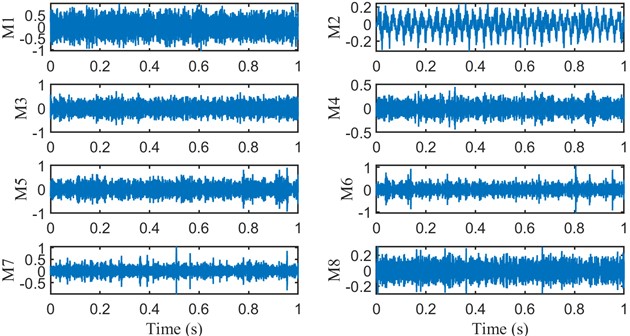
As can be seen from the envelope spectrum of the sampled signal in Fig. 9(b), although the fault frequency can be observed, it will be affected by the transfer frequency and the noise influence fault frequency can’t be fully recognized. To further verify the effectiveness of this method, the sampled signal is processed using the method proposed in this paper. Firstly, the signal is decomposed by ACMD, and the tolerance level parameter of the loop iteration within ACMD is 10-8, and the algorithm is stopped when the residual energy is less than 3 % of the original signal energy, and finally, 12 modal components are obtained. As shown in Table 4, the maximum correlation Gini coefficient is 0.5080, and the first 8 modal components, for example, are shown in Fig. 10, where M1 is the optimal component.
The optimal component time-domain waveforms and envelope spectra, as shown in Fig. 11. Compared with Fig. 9, it can be seen that the random interference component is significantly reduced, but there is still interference.
The optimal component signals are further processed to estimate the loop set using the enhanced energy harmonic product spectrum, as shown in Fig. 12.
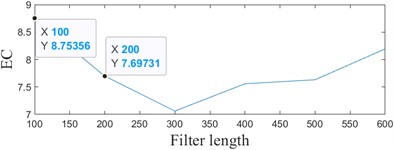
According to the enhanced energy harmonic product spectrum, the cyclic frequency set is set to [108, 216,324...10800] adaptively, and after obtaining the cyclic frequency set, the initial filter length is set to 100, the step size is set to 100, and the efficiency threshold is set to 0.2. The maximum filter length is 700, and the EPPF index and EC index are adopted as the objective functions, where the EPPF index is selected to be consistent with the enhanced energy harmonic product spectrum . The results are shown in Fig. 13. The maximum filter length is 700. The EPPF index and EC index are used as the objective function, where the EPPF index is selected to be consistent with the enhanced energy harmonic product spectrum . The results are shown in Fig. 13, and the actual filter length of the EPPF index is output to be 500, and the actual filter length of the EC index is 100. ACMD-ICYCBD method in MATLAB R2022a environment on a computer with a benchmark speed of 3.10 GHz, 12-core CPU, and 16 GB of RAM. The overall algorithm duration is 183.46 seconds.
Fig. 11The optimal component of the Sampled signal ACMD
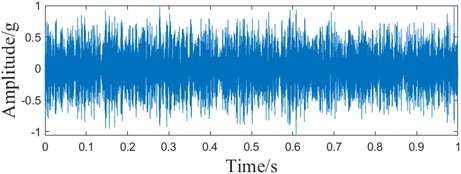
a) Time domain waveform
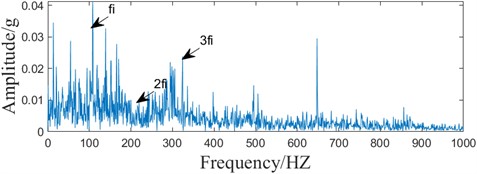
b) Envelope spectrum
Fig. 12Enhanced energy harmonic product spectrum of the sampled signal
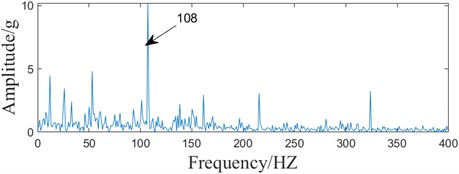
Fig. 13Sampled signal ACMD-ICYCBD method
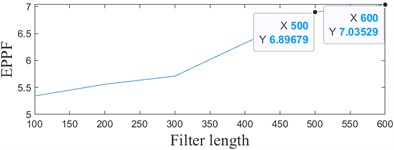
a) Variation plot based on EPPF metrics
d) Variation plot based on EC metrics
b) Time domain waveform based on EPPF metrics
e) Time domain waveform based on EC metrics
c) Envelope spectrum based on EPPF metrics
f) Envelope spectrum based on EC metrics
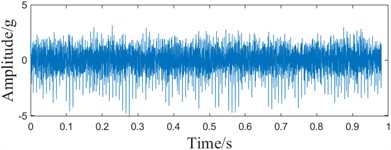
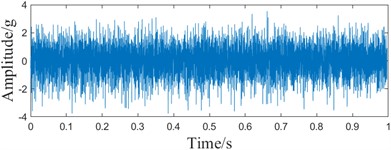
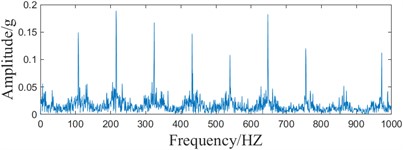
From Fig. 13(b), it can be seen that the fault impact components can be clearly observed from the time domain waveforms after the processing of the proposed method in this paper, and in Fig. 13(c), it can be seen that the fault frequencies can all be recognized. Compared with Fig. 11(b), it can be seen that the method in this paper is able to reduce the noise effect and extract the weak fault frequency.
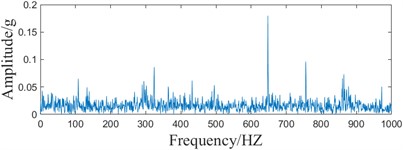
Comparing Fig. 13(c) and 13(f), it can be seen that based on the EC indicator, only part of the fault characteristic information can be recognized, and it can be understood that the EC indicator only takes into account the peak variation of the signal, and cannot take into account the periodicity of the signal. On the other hand, the EPPF index can recognize the periodic change of the signal and avoid the situation that the single peak is too large. Comprehensive analysis shows that the EPPF indicator is more effective in reflecting periodic faults.
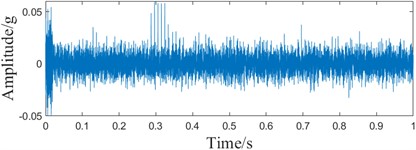
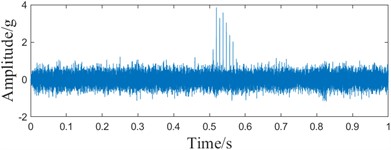
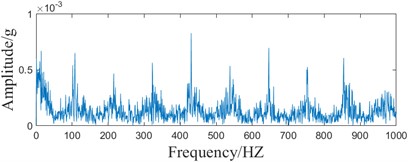
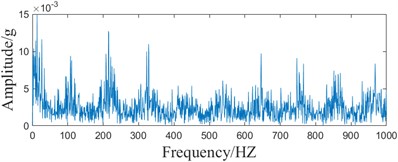
To further reflect the superiority of the method in this paper, the sampled signals are processed by the MCKD algorithm and MCKD alone after reconstruction based on ACMD decomposition, respectively, for comparison. The filter length parameter is selected as 500, which is consistent with the optimized EPPF index, and the fault period is selected to be consistent with the fault frequency estimated by the enhanced energy harmonic product spectrum. Its time domain waveform and envelope spectrum are shown in Fig. 14.
Fig. 14ACMD-MCKD method and MCKD method
a) ACMD-MCKD time domain waveform
c) MCKD time domain waveform
b) ACMD-MCKD envelope spectrum
d) MCKD envelope spectrum
Comparing Fig. 14(a-c) and Fig. 13(b) time domain waveforms, it can be found that the MCKD-based method can only extract the local limited fault feature information, while the method in this paper can extract the continuous periodic fault feature information. The time domain analysis shows that the periodic fault impact of this method paper is more obvious. Comparing the envelope spectra in Fig. 14(b) and Fig. 13(c), it can be found that the fault frequency of the proposed method can be recognized, while the ACMD-MCKD method can recognize part of the fault frequency, and the 9-fold frequency can't be recognized, and the noise amplitude is larger. Spectrum analysis shows that the method in this paper has less interference, which is conducive to fault feature extraction. Comparison of Fig. 14(b) and Fig. 14(d) envelope spectrum can be found, the separate MCKD method by the noise interference is serious, can only identify part of the fault frequency, 4 times the frequency, 5 times the frequency, 7 times the frequency, 8 times the frequency all can’t be identified, through the spectral analysis can be seen that the decomposition of the ACMD can be reconfigured to reduce the influence of the noise, improve the effect of fault information extraction. Comprehensive analysis shows that ACMD-ICYCBD has obvious superiority.
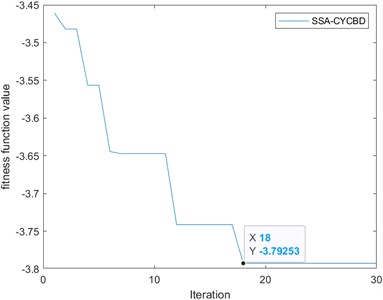
To show the efficiency of the present sub-method, the sparrow search optimization algorithm in the literature 9 is now used to improve the CYCBD, due to the sparrow search optimization algorithm seeking the minimum objective, the negative of the envelope cycle pulse factor is used as the objective function. To take into account the computation time during the iteration, the length of the signal should not be too long, the first 5000 points are selected as the iterative optimization signal, and the optimized parameter condition is selected, the search range of the cyclic frequency is set to (103, 113), and the search range of the filter length is set to (100, 700). The final optimal parameter cycle frequency is 108 and the filter length is 339 as shown in Fig. 15.
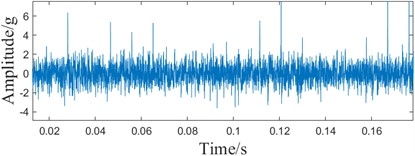
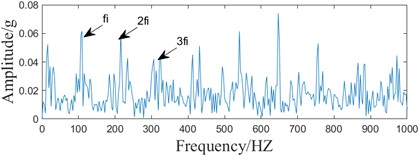
SSA-CYCBD method in a benchmark speed of 3.10 GHz, 12 core CPU, 16 GB memory computer, MATLAB R2022a environment. The overall algorithm time reaches 2132.36 seconds. Compared to the method in this paper, 183.46 seconds is too long. It is known that the computation time of CYCBD using the optimization algorithm is too long and too inefficient for engineering practice compared to the method proposed in this paper. Meanwhile, according to the iterative graph in Fig. 15(a), it is known that if the number of iterations is not enough, it will fall into the local optimum. According to the comparison of Fig. 13(c) and 15(c), it can be seen that SSA-CYCBD can observe the fault frequency, but part of the multiplicative frequency is still disturbed, which is not as obvious as the method proposed in this paper.
Fig. 15SSA-CYCBD method
a) SSA-CYCBD iteration diagrams
b) SSA-CYCBD time domain waveform
c) SSA-CYCBD envelope spectrum
6. Conclusions
Aiming at the rolling bearing fault features difficult to extract and efficiency problems under the strong background noise, this paper proposes the ACMD-ICYCBD method to extract fault features from rolling bearing signals, which is verified according to simulation and experimental data, and the conclusions are obtained as follows:
1) Based on the correlation Gini coefficient ACMD method, it can extract better correlation components of fault components from the signal, reduce the influence of noise, and then improve the reliability of cyclic frequency estimation, compared with the VMD, the method does not need the number of a priori signal components and avoids the complexity of the parameters.
2) The simulation signal verifies that CYCBD depends on the selection of parameters, and this paper overcomes the defect by improving the CYCBD algorithm and improves the effectiveness of the CYCBD method. It is demonstrated through simulation and experimental data that the Enhanced Energy Harmonic Product Spectrum (EEHPS) method is capable of estimating the cyclic frequency set quickly and accurately. Through experimental data, it is proved that the proposed EPPF index is more effective in reflecting cyclic faults than the EC index, and is more suitable for fault diagnosis of rotating machinery.
3) Through simulation and experimental data, it is verified that the ACMD-ICYCBD algorithm proposed in this paper can quickly and accurately extract fault information. Compared with the MCKD method, the method in this paper can better weaken the interference of heterodyne. Compared to the SSA-CYCBD method, the method in this paper is shorter and more efficient.
References
-
G. Geetha and P. Geethanjali, “An efficient method for bearing fault diagnosis,” Systems Science and Control Engineering, Vol. 12, No. 1, p. 23292, Dec. 2024, https://doi.org/10.1080/21642583.2024.2329264
-
S. Patel and S. Patel, “Research progress on bearing fault diagnosis with signal processing methods for rolling element bearings,” Noise and Vibration Worldwide, Vol. 55, No. 1-2, pp. 96–112, Dec. 2023, https://doi.org/10.1177/09574565231222615
-
Z. Wang, J. Wang, Y. Kou, J. Zhang, S. Ning, and Z. Zhao, “Weak fault diagnosis of wind turbine gearboxes based on MED-LMD,” Entropy, Vol. 19, No. 6, p. 277, Jun. 2017, https://doi.org/10.3390/e19060277
-
X. Li, Z. Xu, and Y. Wang, “PSO-MCKD-MFFResnet based fault diagnosis algorithm for hydropower units,” Mathematical Biosciences and Engineering, Vol. 20, No. 8, pp. 14117–14135, Jan. 2023, https://doi.org/10.3934/mbe.2023631
-
G. L. Mcdonald, Q. Zhao, and M. J. Zuo, “Maximum correlated kurtosis deconvolution and application on gear tooth chip fault detection,” Mechanical Systems and Signal Processing, Vol. 33, pp. 237–255, Nov. 2012, https://doi.org/10.1016/j.ymssp.2012.06.010
-
W. Deng, Z. Li, X. Li, H. Chen, and H. Zhao, “Compound fault diagnosis using optimized MCKD and sparse representation for rolling bearings,” IEEE Transactions on Instrumentation and Measurement, Vol. 71, pp. 1–9, Jan. 2022, https://doi.org/10.1109/tim.2022.3159005
-
M. Buzzoni, J. Antoni, and G. D. ’Elia, “Blind deconvolution based on cyclostationarity maximization and its application to fault identification,” Journal of Sound and Vibration, Vol. 432, pp. 569–601, Oct. 2018, https://doi.org/10.1016/j.jsv.2018.06.055
-
Y. Qi, C. Shan, S. Jia, L. Liu, and C. Dong, “A gearbox composite fault diagnosis based on enhanced CYCBD,” China Mechanical Engineering, Vol. 33, p. 2927, 2022, https://doi.org/10.3969/j.issn.1004-132x.2022.24.004
-
B. Zhang, Y. Miao, J. Lin, and Y. Yi, “Adaptive maximum second-order cyclostationarity blind deconvolution and its application for locomotive bearing fault diagnosis,” Mechanical Systems and Signal Processing, Vol. 158, p. 107736, Sep. 2021, https://doi.org/10.1016/j.ymssp.2021.107736
-
J. Ma and S. Liang, “Research on rolling-element bearing composite fault diagnosis methods based on RLMD and SSA-CYCBD,” Processes, Vol. 10, No. 11, p. 2208, Oct. 2022, https://doi.org/10.3390/pr10112208
-
Y. Lin, Y. Guo, and X. Chen, “Planet bearing fault extraction based on parameter optimized maximum second-order cyclostationary blind deconvolution,” Journal of Vibration and Shock, Vol. 42, pp. 321–328, 2023, https://doi.org/10.13465/j.cnki.jvs.2023.02.038
-
Y. Bai, W. Cheng, W. Wen, and Y. Liu, “Application of time-frequency analysis in rotating machinery fault diagnosis,” Shock and Vibration, Vol. 2023, pp. 1–16, Jul. 2023, https://doi.org/10.1155/2023/9878228
-
N. E. Huang et al., “The empirical mode decomposition and the Hilbert spectrum for nonlinear and non-stationary time series analysis,” Proceedings of the Royal Society of London. Series A: Mathematical, Physical and Engineering Sciences, Vol. 454, No. 1971, pp. 903–995, Mar. 1998, https://doi.org/10.1098/rspa.1998.0193
-
J. S. Smith, “The local mean decomposition and its application to EEG perception data,” Journal of The Royal Society Interface, Vol. 2, No. 5, pp. 443–454, Dec. 2005, https://doi.org/10.1098/rsif.2005.0058
-
Z. Wu and N. E. Huang, “Ensemble empirical mode decomposition: a noise-assisted data analysis method,” Advances in Adaptive Data Analysis, Vol. 1, No. 1, pp. 1–41, Nov. 2011, https://doi.org/10.1142/s1793536909000047
-
J. Yang, “Research on feature extraction and fault diagnosis method for rolling bearing vibration signals based on improved FDM-SVD and CYCBD,” Symmetry, Vol. 16, No. 5, p. 552, May 2024, https://doi.org/10.3390/sym16050552
-
J. Luo, Y. Chen, Q. Huang, S. Zhang, and X. Zhang, “Joint application of VMD and IWOA-PNN for gearbox fault classification via current signal,” IEEE Sensors Journal, Vol. 23, No. 12, pp. 13155–13164, Jun. 2023, https://doi.org/10.1109/jsen.2023.3269594
-
B. Chang, X. Zhao, D. Guo, S. Zhao, and J. Fei, “Rolling bearing fault diagnosis based on optimized VMD and SSAE,” IEEE Access, Jan. 2024, https://doi.org/10.1109/access.2024.3386835
-
S. Chen, Y. Yang, Z. Peng, X. Dong, W. Zhang, and G. Meng, “Adaptive chirp mode pursuit: algorithm and applications,” Mechanical Systems and Signal Processing, Vol. 116, pp. 566–584, Feb. 2019, https://doi.org/10.1016/j.ymssp.2018.06.052
-
H. Bendjama, “Bearing fault diagnosis based on optimal Morlet wavelet filter and Teager-Kaiser energy operator,” Journal of the Brazilian Society of Mechanical Sciences and Engineering, Vol. 44, No. 9, p. 392, Aug. 2022, https://doi.org/10.1007/s40430-022-03688-4
-
M. Zhao, J. Lin, Y. Miao, and X. Xu, “Detection and recovery of fault impulses via improved harmonic product spectrum and its application in defect size estimation of train bearings,” Measurement, Vol. 91, pp. 421–439, Sep. 2016, https://doi.org/10.1016/j.measurement.2016.05.068
-
L. Zhang, “New procedure and index for the parameter optimization of complex wavelet based resonance demodulation,” Journal of Mechanical Engineering, Vol. 51, No. 3, p. 129, Jan. 2015, https://doi.org/10.3901/jme.2015.03.129
-
C. Yi, H. Wang, Q. Zhou, Q. Hu, P. Zhou, and J. Lin, “An adaptive harmonic product spectrum for rotating machinery fault diagnosis,” IEEE Transactions on Instrumentation and Measurement, Vol. 72, pp. 1–12, 2022, https://doi.org/10.1109/tim.2022.3230462
-
Y. Liu and H. Sun, “Application of CYCBD based on particle swarm optimization in rolling bearing fault feature extraction,” (in Chinese), Mechanical Transmission, Vol. 45, pp. 171–176, 2021, https://doi.org/10.16578/j.issn.1004.2539.2021.02.026
-
B. Wang, Y. Lei, N. Li, and N. Li, “A hybrid prognostics approach for estimating remaining useful life of rolling element bearings,” IEEE Transactions on Reliability, Vol. 69, No. 1, pp. 401–412, Mar. 2020, https://doi.org/10.1109/tr.2018.2882682
About this article
The authors would like to acknowledge the anonymous reviewers for their valuable and constructive comments. This study was supported by the National Natural Science Foundation Project (Grant numbers 51966018 and 51466015) and the Key Research & Development Program of Xinjiang (Grant number 2022B01003).
The datasets generated during and/or analyzed during the current study are available from the corresponding author on reasonable request.
Yuanjun Dai: visualization, supervision, validation. Anwen Tan: writing-original draft preparation, software, conceptualization. Kunju Shi: writing-review and editing, visualization.
The authors declare that they have no conflict of interest.
