Abstract
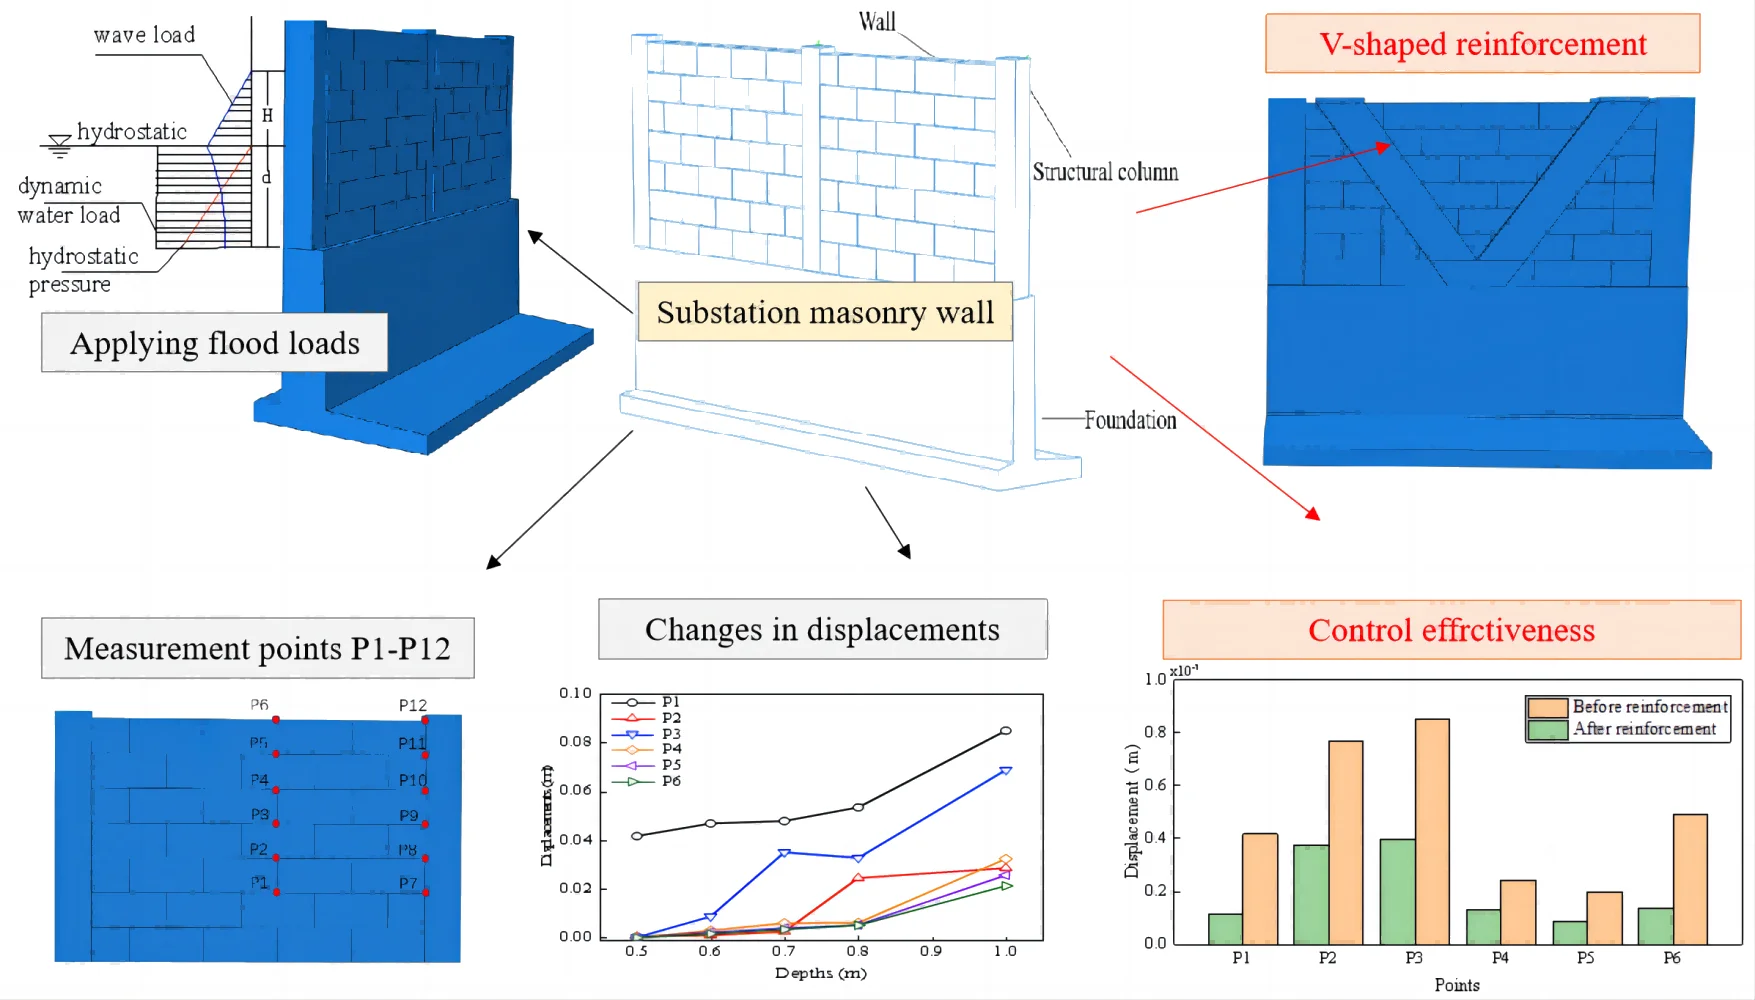
This study examines the stress characteristics and deformation modes of masonry walls under flood loads in a 500kV substation project in Xinyang City, Henan Province. A simplified finite element model of substation masonry walls is developed in ABAQUS, considering dynamic water loads, the stress characteristics and deformation modes of masonry walls under flood loads are studied. Flood depth, water velocity, and erosion depth are selected as variables to carry out the parametric analysis of masonry enclosure walls under flood load, to investigate the dynamic response of walls under various parameters, and to examine the damage mechanism of the wall. The research findings suggest that stress levels are elevated at critical locations, such as the bottom center of the wall, the junction between the inner wall and structural column, and the connection between the foundation and structural column during flood loading. The safety of a masonry wall is significantly compromised when flood depth exceeds 0.8 m, water velocity exceeds 2.3 m/s, or erosion depth reaches 0.4 m. A proposed measure aims to enhance the performance of masonry walls by improving stress distribution and reducing stress concentrations, thereby significantly augmenting their load-bearing capacity.
Highlights
- Mechanical characteristics of substation masonry wall under flood load is investigated.
- A V-shaped reinforcement measure is proposed for enhancing flood impact resistance.
- The proposed measure can effectively reduce stress concentrations in masonry wall.
1. Introduction
The substation fence serves as a crucial component of the power grid, fulfilling defense and isolation functions. In recent years, the frequency of extreme weather events has risen globally, and climate crises have resulted in frequent occurrences of natural disasters. Strong winds, rainstorms, floods, and other phenomena pose a substantial risk to the stable functioning of substations. In the relevant regulations for substation engineering in our country, regulations are made for the selection of substation sites, determination of site elevation, site flood control and drainage, wall flood control, and cable trench flood control, but there is no mention of substation wall flood control. The reliability of the substation fence directly determines whether the internal facilities can operate safely and stably under the influence of floods, which has a significant impact on the safe use of the substation facilities. Hence, investigating the stress characteristics of the substation enclosure during flooding and enhancing its flood control capacity can ensure stable substation operation during severe natural calamities like rainstorms.
Scholars have extensively researched the flood resilience and load-bearing capacity of walls. Finite element modeling is an important way to analyze the load-bearing capacity of fences, in 2010, Xiao et al. [1] conducted a study on the impact of different opening rates on houses under the action of flood water flow and found that the pressure near the opening decreases with the increase of opening rate, while the changes in other water flow pressures are not significant. Rosi et al. [2] conducted experiments to obtain flood water level and velocity and studied the limitations on the size of flood walls. Jeroen [3] integrated the unit cost information of six major types of flood adaptation measures, described each measure, and provided cost figures for developed and developing countries, which can be used for economic evaluation studies of flood adaptation measures. Xia et al. [4] compared the coping strategies of three mega-floods in 1954, 1998, and 2020, analyzed the changes in the flood control pattern of the Yangtze River, and proposed a new type of flood control system to improve resilience to extreme flooding hazards. Yari et al. [5-6], based on actual cases and analysis, found that night, flood recurrence period, mudslides, torrential rainfall, and peak flood flow are important factors affecting the role of floods, and exceeding 500 m3/s flood flow can lead to double the damage. and that flood flows exceeding 500 m3/s lead to exponential increase in damages. These studies facilitate a more detailed analysis of the role of flood loads.
Meanwhile, domestic and foreign scholars have achieved some research results on reinforcement measures for masonry walls. Examples include externally adhered FRP reinforcement [7], embedded FRP reinforcement [8-9], high ductility concrete reinforcement [10], steel plate with polymer mortar reinforcement [11], and fabric-reinforced mortar [12, 13]. However, due to the relative complexity of many of the existing reinforcement techniques and the high cost of reinforcement, the application in actual projects is limited. Siavash et al. [14] proposed an optimized design of flood control walls based on Non-dominated sorting genetic algorithm II (NSGA-II) to minimize the cost and weight of the structure while satisfying stability and limiting state constraints. Deng et al. [15] proposed the use of high ductility concrete (HDC) surface layer and strip to reinforce masonry walls. Jing et al. [16] used the reinforcement scheme of the internal frame structure to reinforce the masonry structure of the Moon City in Xi’an by de-bearing walls. Jansen et al. [17] assessed the impact of flooding on modern Dutch homes through laboratory testing and structural modeling, developing physically based vulnerability curves that illustrate a physical approach to assessing residential collapse.
In summary, current research mainly focuses on the force performance under flood loads in villages, dams, and other common buildings or projects. In recent years, the frequent occurrence of extreme weather has put forward higher requirements for the flood protection capability of substations, but little research has been done on the force performance and damage mode of substation enclosure walls under flood loads, and at the same time, there is a lack of reliable performance enhancement measures for resisting flood loads in substations. Compared with other enclosure walls, the substation enclosure wall must consider the flood protection requirements in addition to meeting the bearing capacity and functional requirements. Under flood loads, masonry walls become saturated and the water content of the mortar layer and blocks increases, leading to softening of the mortar layer and a reduction in compressive and shear strength. Under horizontal loading, masonry walls are susceptible to damage. The reliability of substation walls is critical to ensure the safe and stable operation of internal facilities during floods. Therefore, it is necessary to clarify the bearing capacity of substation masonry enclosure walls under flood loads and to propose reliable performance improvement measures to enhance their flood protection capability.
A finite element model of substation masonry walls is established using ABAQUS to analyze the stress characteristics and failure modes of masonry walls under flood loads. The study considers the impact of flood depth, water velocity, and erosion depth, and conducts a parametric analysis to evaluate the stress performance of masonry walls. A proposed performance enhancement measure is evaluated for the force characteristics of masonry enclosure walls to ensure the safety of substation masonry enclosure walls under flood loads.
2. Flood load calculation method
2.1. Masonry wall finite element model
Fig. 1 displays the finite element model of the masonry wall with foundation structural columns, simulated using ABAQUS software. Solid element C3D8R is used to simulate the blocks, structural columns, and foundations, while beam element B31 is used to simulate the reinforcement. To simplify the simulation of masonry walls, each block is extended in six directions in space to include 1/2 of the thickness of the surrounding vertical and horizontal mortar joints, forming a “composite block” and modeled as an isotropic continuous element [18]. The reinforcement adopts a double-line material model, and the mechanical behavior of concrete is simulated using a damage plasticity model. The concrete material parameters are shown in Tables 1 and 2, and Table 3 displays the parameters of the reinforcement material.
Fig. 1Masonry wall finite element model
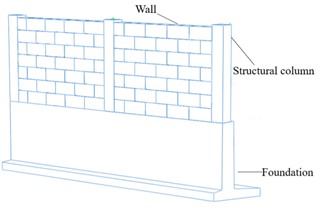
a) Overall model
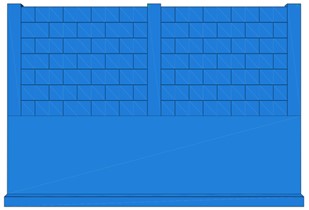
b) Wall model
Table 1Concrete material parameters
Density (kg/m³) | Young’s modulus (MPa) | Poisson’s ratio |
2400 | 31000 | 0.2 |
Table 2Plastic parameters in concrete damage plasticity model
Shear angle (°) | Eccentricity | fb0/fc0 | K | Viscosity parameters |
36.31 | 0.1 | 1.16 | 0.66667 | 0.005 |
Note: fb0/fc0 is the initial biaxial compressive yield stress/initial uniaxial compressive yield stress; K is the ratio of normal stress between the tensile meridian and the compressive meridian. | ||||
Table 3Reinforcement material parameters
Reinforcement | Density (kg/m³) | Young’s modulus (MPa) | Poisson’s ratio | Yield stress (MPa) | Plastic strain |
HPB300 | 7900 | 200000 | 0.3 | 300 | 0 |
HRB400 | 7900 | 200000 | 0.3 | 400 | 0 |
The interaction between the combined blocks is set and all degrees of freedom of the foundation are constrained. The simplified separated modeling method for block walls simulates the failure of mortar joints by the failure of contact behavior between composite blocks, and their contact behavior needs to be set in the normal and tangential directions respectively [19]. The normal behavior adopts “hard” contact to prevent mutual intrusion between adjacent component elements. For tangential behavior, the “penalty” contact property (Coulomb friction property) is set, with a friction coefficient of 0.5. Viscous behavior is handled using the non-coupled traction separation criterion, which assumes that pure normal separation will not cause changes in tangential traction stress, and pure tangential slip will not cause changes in normal traction stress. In addition, binding constraints are used between the composite block and the construction column, as well as between the composite block and the foundation, and built-in constraints are used between the reinforcement skeleton and the construction column. The hexahedral meshing method is employed to achieve good simulation accuracy.
2.2. Flood load calculation method
Since most of the substation enclosures are subject to flooding caused by heavy rainfall, the flooded area is relatively shallow. Therefore, it can be assumed that the coupling effect between the water flow and waves of the flood can be ignored. When considering the total water flow pressure, the total water flow pressure is composed of wave load, dynamic water load, and static water pressure.
The static water pressure that varies along the height of the wall can be expressed as:
where: FG is the hydrostatic pressure, ρ represents the water density, gdenotes gravitational acceleration, and h represents the water depth. Hydrostatic pressure and flood water depth are directly proportional. Horizontally, at the same water depth, the hydrostatic pressure is equal; at different water depths, the hydrostatic pressure at the bottom is large.
The wave pressure calculation method of Ryoji [20] was used to calculate the wave load force. In this project, d/L is determined from the given data to meet the condition of shallow water wave area, i.e.0.135≤d/L<0.35. Consequently, the maximum wave load beneath the static water surface can be expressed as follows:
where: k is the wave number, which can be calculated as 2π/L, L is the average wavelength; γ is the flood heaviness; H is the wave height of the incident wave; the cosh(∙)function is the hyperbolic cosine function; is the flood depth; z is the vertical coordinate that is positive upwards from the static water surface. The mean wavelength L can be determined according to Appendix C Wave Calculation Lookup Table of Levee Engineering.
In this study, based on the experimental results of Danel, the incident wave height H is selected as the limiting incident wave height Hlim [21] in front of the wall, which can then be expressed as:
The primary load acting on the enclosure surface is the dynamic water load [22], which can be expressed as follows:
where: Fw is the standard value of water flow force; Kw is the integrated impact coefficient of water flow resistance, when the opening rate is 0, Kw is 2.32; A is the gross area of the wall on the flow-facing surface; v is the velocity of the water flow, which can be calculated as:
where: the Xie Cai coefficient C=R1/6/n; the hydraulic radius R=S/x; i is the slope of the river section, taken as 0.005; n is the roughness coefficient of the riverbed, taken as 0.03; S is the cross-sectional area of the riverbed; and x is the wet perimeter of the cross-section of the riverbed.
Both the on-site damage and finite element simulation indicate that the middle and lower parts of the enclosure wall experience the most displacement, gradually decreasing from bottom to top. The highest tensile stress is observed at the junction of the wall and the structural column. Therefore, measurement points P1-P6 are selected at the center of the span of the wall to study the displacement changes at different heights of the wall, and measurement points P7-P12 are chosen to investigate stress variations at different heights of the wall where they connect to the structural column. To verify the reasonableness of the numerical model, a comparison between the actual damage of the wall in the field in Fig. 3(a) and the numerical simulation damage in Fig. 3(b) is carried out. The area damaged by the substation enclosure wall under the flood impact is the upper wall, and it is out-of-face impact damage. The results of the numerical simulation and the location and form of the actual substation enclosure wall damage are basically in line with each other, which indicates that the numerical simulation can simulate the actual engineering force characteristics to a certain extent, and the subsequent dynamic response analysis is combined.
Fig. 2Distribution of flood load on masonry walls
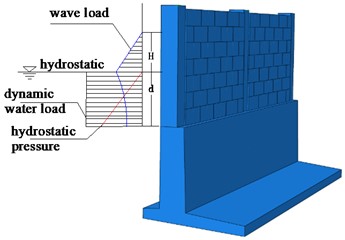
a) Load diagram
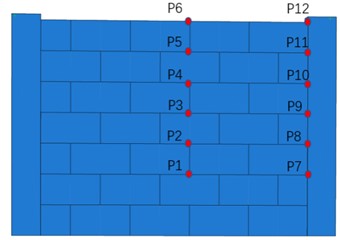
b) Mapping of wall measurement points.
Fig. 3Damage situation of masonry walls
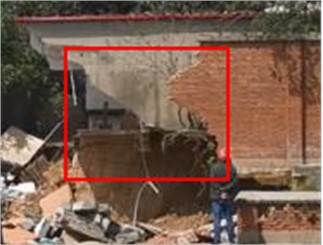
a) Physical damage on site
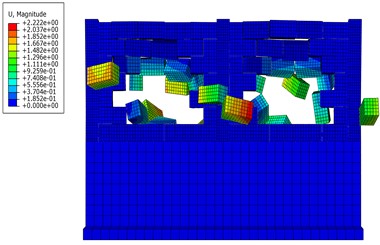
b) Model simulation of destruction
3. Mechanical characteristics analysis of masonry wall under flood load
3.1. Project overview
This study is based on the Xinyang, Henan 500 kV substation project. The substation is situated in a hilly and low-lying region, with the wall's north side exposed to flooding. In 2021, Henan Province encountered a rare extremely heavy rainstorm in history. The flood level exceeded the original design standard, and the substation wall is flooded. The masonry wall collapsed over a large area due to water scouring, after the local walls on the upstream face overturned from the bottom of the superstructure wall. Fig. 4 shows the actual engineering layout and construction of the masonry walls, which mainly consist of structural columns and walls made of A3.5 autoclaved aerated concrete blocks using MD7.5 mixed mortar. The wall height is 2.3 meters. The block size is 600 mm × 300 mm × 300 mm, with mortar between the blocks. C30 concrete and reinforcements are used to construct columns on both sides of the block wall. The cross-sectional size is 300 mm × 300 mm, with a centerline spacing of 3 meters between adjacent structural columns. Expansion joints are placed every 6 meters on the wall. For numerical modeling and stress analysis, this article focuses on the wall between two expansion joints.
Fig. 4Layout and construction information of masonry wall (Unit: mm)
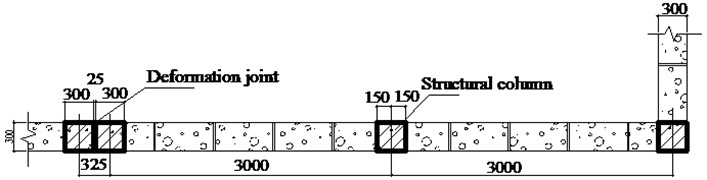
a) Wall elevation view
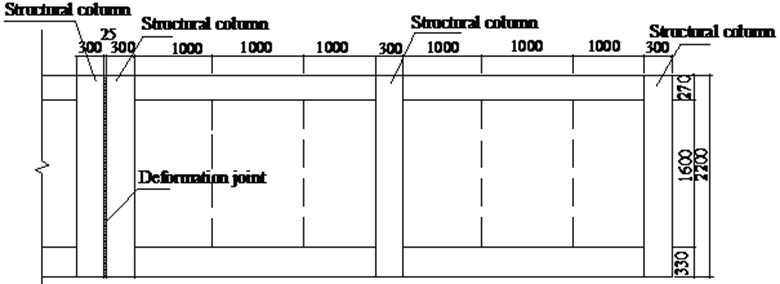
b) Wall plan
3.2. Force characteristics analysis
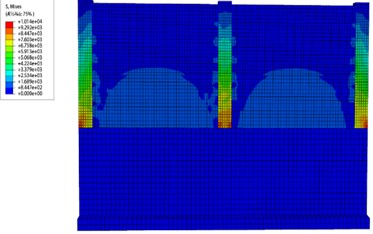
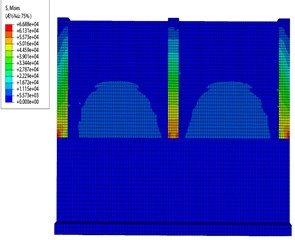
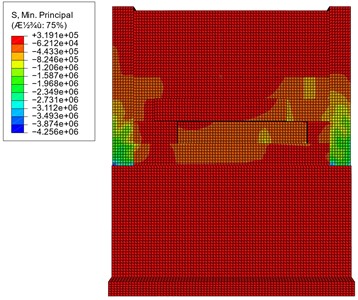
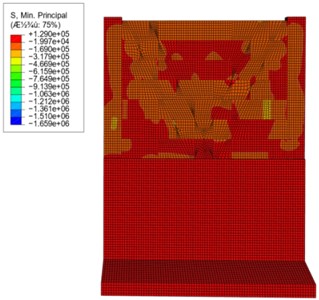
The stress characteristics of the substation’s masonry wall are examined based on engineering monitoring measurements of a flood depth of 1 m and a flood velocity of 2 m/s. The compressive stress distribution of the masonry wall under flood loading is shown in Fig. 5, where the stress cloud of the masonry wall on the flood side outside the substation station (referred to as the “outer side”) is shown in Fig. 5(a), and the stress cloud of the masonry wall on the facility side (referred to as the “inner side”) is shown in Fig. 5(b).
Fig. 5Cloud chart of wall pressure stress under flood load
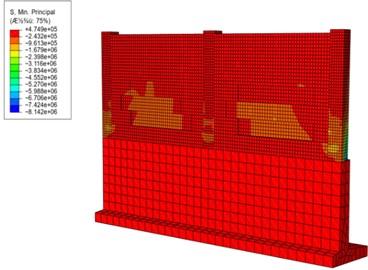
a) Outer side
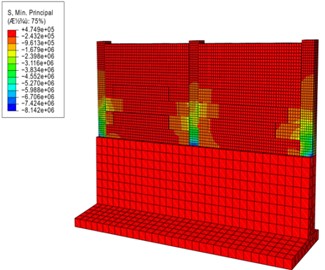
b) Inner side
The flood pressure causes an increase in compressive stress at the center of the bottom of the outer wall, exhibiting a relatively uniform stress distribution ranging from –2.43 MPa to 4.74 MPa. Notably, the inner wall experiences significant stress concentration. The compressive stress in the structural column gradually increases with height, reaching its maximum value at the connection with the foundation.
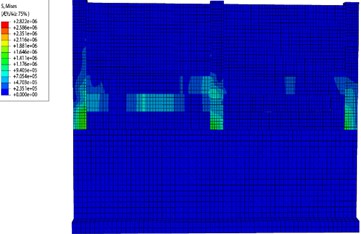
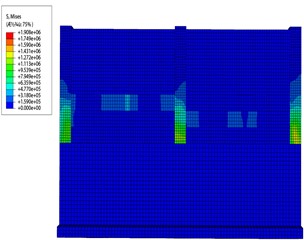
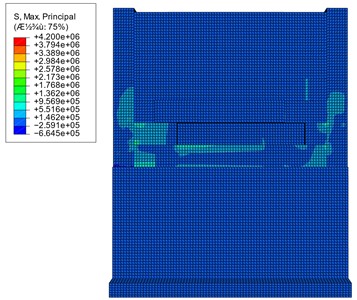
The distribution of tensile stress in the masonry wall under flood load is shown in Fig. 6. The connection area between the wall and the structural column experiences the highest tensile stress. The outer connection between the structural column and the foundation shows greater tensile stress with notable variations compared to the inner side. Moreover, due to block interaction, several regions on the wall show prominent tensile stresses, primarily near the structural columns, indicating the force transfer mechanism between the blocks and the structural columns.
Fig. 6Cloud chart of wall tensile stress under flood load
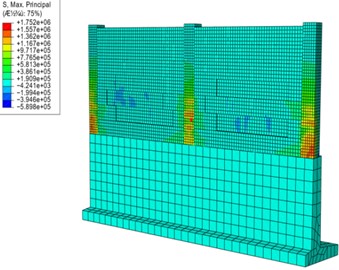
a) Outer side
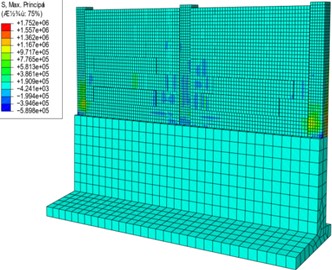
b) Inner side
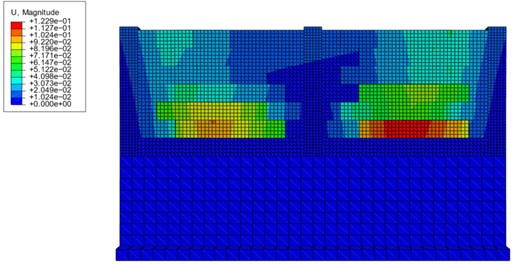
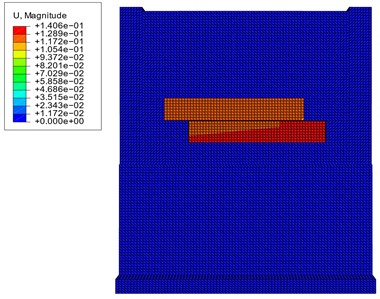
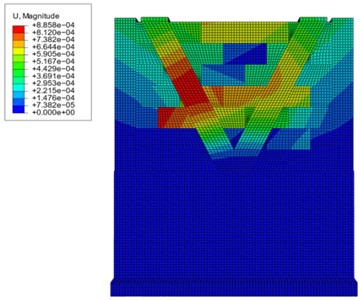
Fig. 7 shows the displacement cloud of the masonry wall under flood load. The red part of the displacement is larger and concentrated in the lower region, and the blue part of the displacement is smaller and concentrated in the upper region, indicating that the wall deformation is smaller above and larger below. Under similar working conditions, when the flood load is low, the wall has no vertical deformation, with displacement and deformation primarily occurring perpendicular to the wall. However, under higher flood loads, the wall exhibits significant displacement and deformation. The deformation pattern of the wall follows a decreasing trend from the centerline to the edges, with larger deformation observed below and smaller deformation above. The rigidity of the structural columns on both sides of the masonry wall is large, the deformation is small on the top and small on the bottom, and a certain degree of twisting phenomenon occurs. The deformation of the masonry wall is not uniform, because the wall is composed of multiple blocks interacting with each other by setting, and the flood load at different heights varies greatly, resulting in differences in deformation between the blocks distributed along the height of the wall. In addition, the deformation decreases with increasing height, which is because the flood height for this condition is 1.0 m and the lower area is directly subjected to flooding.
Fig. 7Displacement cloud map of masonry wall
4. Parametric analysis
The flood load has a significant impact on the force characteristics and deformation of masonry enclosure walls, as analyzed above. Further research is required to investigate the force performance of masonry enclosure walls under flood load, specifically the influence of changes in parameters such as flood depth, water velocity, and erosion depth on masonry enclosure walls.
4.1. Influence of flood depths
The flood depth parameters selected for analysis are 0.5 m, 0.6 m, 0.75 m, 0.8 m, 1.0 m, and 1.25 m. A comparative analysis of stress distribution and displacement changes of masonry enclosure walls under different flood depths was conducted to study the stress and deformation change patterns of masonry enclosure walls with varying flood depths.
Fig. 8 displays the displacement and stress response of the masonry wall at various measurement points during flooding. As depicted in Fig. 8(a), when the flood depth ranges from 0 to 0.8 m, the displacement at different measurement points is small, with values below 0.05 m. When the flood depth is increased to 0.8 m, the displacement changes at the wall measurement points P1, P2, and P3 are very significant, while the displacement changes at the other measurement points are small. As the flood depth continued to increase, the displacements at points P1 and P2 are 0.085 m and 0.029 m, respectively, when the depth reached 1.0 m, which increased by 0.043 m and 0.028 m, respectively, compared with the depth of 0.5 m. In addition, the displacements at point P1 are consistently the largest at different flood depths, which indicates that this point is the most unfavorable location for the wall. At a flood depth of 1.25 meters, the middle block at the lower end of the wall experiences its highest stress, resulting in wall collapse without recorded simulation data.
Fig. 8(b) illustrates the stress variation of the masonry wall under flood loading. The stresses at measurement points P9, P10, P11, and P12 do not change much when the flood depth increases from 0.5 m to 1.0 m. The stresses at measurement points P9, P10, P11, and P12 do not change much. However, the stresses at measurement points P7 and P8 changed significantly, and when the flood depth increased from 0.5 m to 1.0 m, the stresses at measurement point P7 are 0.30 m and 1.96 m, respectively, which increased by 553.3 %.
Fig. 8The impact of flood depths on fences
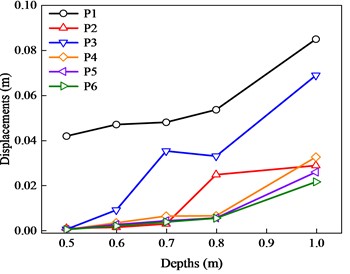
a) Changes in displacements with flood depths
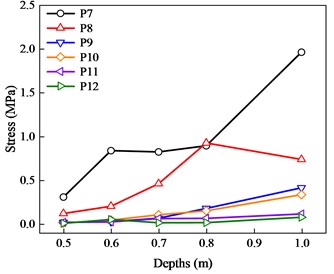
b) Variation of stress with flood depths.
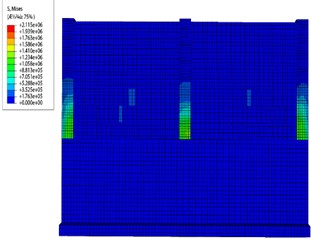
Fig. 9 illustrates the evolution of stress cloud diagrams for the masonry enclosure wall as the flood depth reaches 1.0 m. It is evident that the application of flood load results in intricate stress patterns on both sides of the wall, and the stress values in the lower part of the wall are always greater than those in the upper part of the wall; the stresses in the wall are greater at the ends and the bottom of the outer wall, which satisfy the results obtained from the stress analysis section.
Fig. 9The change process of wall stress cloud map at a flood depth of 1.0 m
a) Initial application of loads
b) Progressive change of loads
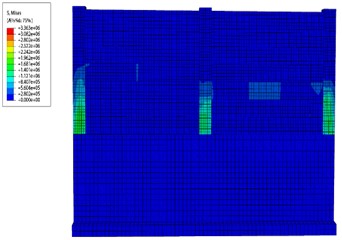
c) Continuing changes in loads
d) End of load application
4.2. Influence of water velocity
The water velocity parameters selected for this study are 1 m/s, 2 m/s, 3 m/s, 4 m/s, and 5 m/s. The objective is to investigate the stress distribution and displacement changes of the masonry enclosure wall. The comparative analysis aims to identify the relationship between flood velocity, stress, and deformation of the masonry enclosure wall.
Fig. 10 displays the displacement and stress response of the masonry wall at different measurement points during flooding. Fig. 10(a) presents the displacement changes in the masonry enclosure under flood loading. As the water velocity increases from 0 m/s to 3 m/s, the wall displacement increases slowly due to the low inertia of the water body, and the change rule of the displacement at different control points is the same, in which the displacement of the wall measuring point P2 is the largest. When the water velocity increases from 3 m/s to 4.0 m/s, the displacements of measuring points P1 and P2 increase rapidly to 0.12 m and 0.070 m, which are 118.18 % and 573.07 % larger compared with that when the water velocity is 1 m/s.
Fig. 10The impact of flood velocity on the fence
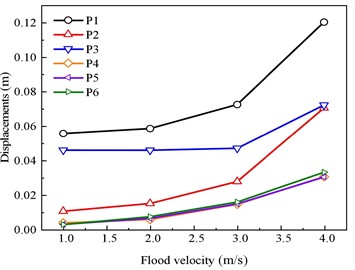
a) Changes in displacements with flood velocity
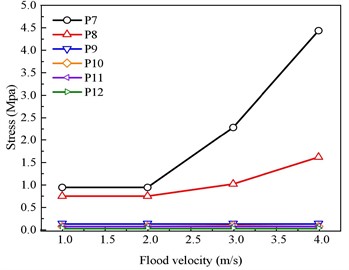
b) Variation of stress with flood velocity
The stress variation in the masonry enclosure under flood loading is given in Fig. 10(b). There is no significant change in stress values at the measurement points along the wall as the water velocity increases from 0 m/s to 2 m/s, where the maximum stress is applied to the measurement point P8, with a profit of 0.072 MPa. The change in stress at the measurement point P8 is very significant when the water velocity increases from 2 m/s to 4 m/s. The stress at the measurement point P8 at a water velocity of 4 m/s is 4.43 MPa, which is 4.43 MPa, compared to that at the water velocity of 1 m/s increased by 376.34 %, and the stress change at the rest of the measurement points is small.
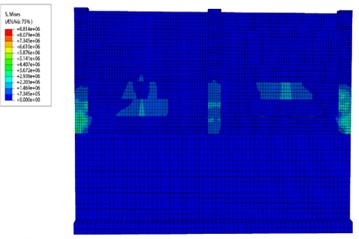
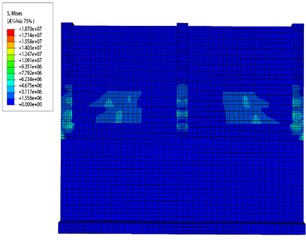
Fig. 11 depicts the stress cloud diagram changes of the masonry wall under a flow water velocity of 5 m/s. The flood load increases due to the velocity rise, resulting in large displacement and deformation of the wall. The lower wall experiences severe deformation, including being washed away, while the upper wall undergoes relatively small deformation. However, damage occurs along the through joint in the lower wall, leading to the collapse of the upper wall. The connection between the wall and the structural column exhibits relatively small deformation.
Fig. 11The change process of wall stress cloud map when flood speed is 5 m/s
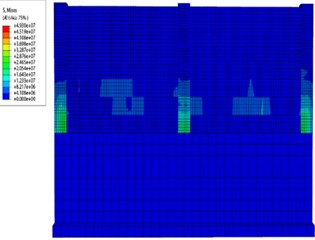
a) Initial application of loads
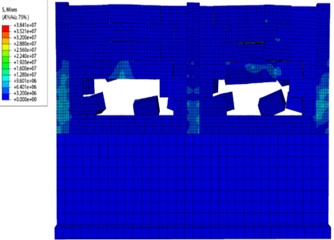
b) Progressive change of loads
c) Continuing changes in loads
d) End of load application
4.3. Effect of erosion depth
The erosion depth parameters selected for analysis are 0.1 m, 0.2 m, 0.3 m, 0.4 m, and 0.5 m. A comparative analysis of stress distribution and displacement changes of the masonry enclosure wall was conducted under various erosion depths to investigate the deformation and stress change patterns of the masonry wall concerning erosion depth.
Fig. 12 presents the displacement and stress response of the masonry wall at various measurement points during flooding. Fig. 12(a) shows that when the erosion depth is less than 0.4 m, the displacement at the measuring points of the wall does not change significantly with the increase of erosion depth, and the increase is small. When the erosion depth gradually increases from 0.4 m to 0.5 m, the displacements at measuring points P2 and P3 increase significantly, and the displacements at the rest of the measuring points change less. When the erosion depth is 0.5 m, the displacements at measuring points P2 and P3 are 0.12 m and 0.074 m, which are 104.09 % and 305.14 % larger compared to the erosion depth of 0.1 m. The displacements at measuring points P2 and P3 are 0.12 m and 0.074 m, respectively.
The stress variation of the masonry enclosure under flood load is given in Fig. 12(b). When the erosion depth is less than 0.4 m, there is no significant change in the stress at the wall measurement points. When the erosion depth exceeds 0.4 m, the stress change at measurement point P8 is very significant, and the stress change at other measurement points is small. When the erosion depth reaches 0.5 m, the stress at measuring point P8 is 3.41 MPa, which increases by 193.09 % compared with the erosion depth of 0.1 m. The stress at measuring point P8 is 3.41 MPa, which is 193.09 % higher than the stress at measuring point P8.
Fig. 12The impact of different erosion depths on the wall
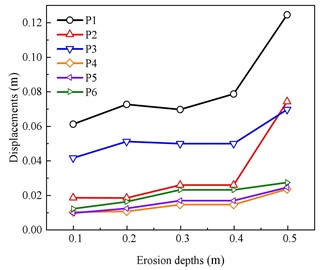
a) Changes in displacements with erosion depths
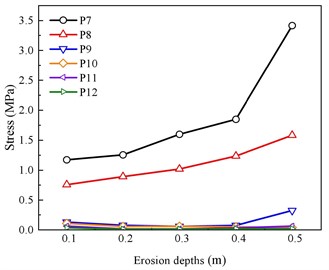
b) Variation of stress with erosion depths
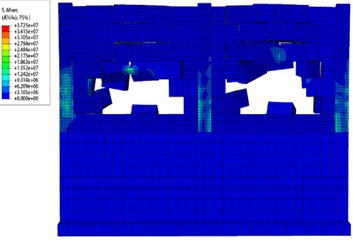
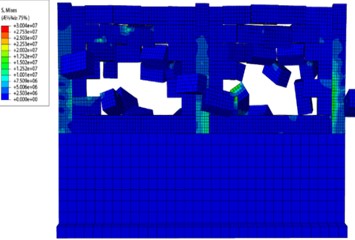
Fig. 13 gives the process of stress cloud changes in the masonry enclosure wall at an erosion depth of 0.5 m. As the depth of erosion increases, the static water load on the upper wall remains unchanged, while the wave load remains largely unchanged, and the dynamic water load increases. The displacements at control point 1, which is most significantly impacted by the flood, are relatively large. Wall panel tensile stresses are then distributed more to the blocks below.
Fig. 13Change process of stress cloud map of the wall when the erosion depth is 0.5 m
a) Initial application of loads
b) Progressive change of loads
c) Continuing changes in loads
d) End of load application
5. Improvement of impact resistance of substation masonry wall
The analysis above shows that the stresses and deformations in the lower region of the masonry wall are significant, making it the most vulnerable location under flood loading. As the masonry wall is not a solid structure, it can easily lead to the failure of the interaction between the blocks under flood load. A proposal for a performance enhancement measure is required to improve the load-carrying capacity of the masonry enclosure. This can be achieved by making it uniformly stressful and less susceptible to washout under flood loads.
Fig. 14Dimensions of V-shaped reinforcement
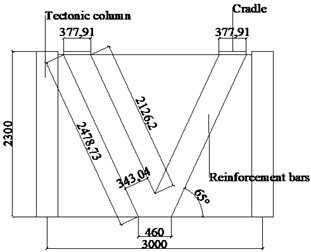
a) Front view
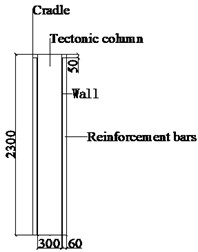
b) Side view
As shown in Fig. 14, for the characteristics of the substation masonry enclosure, this study proposes a bilateral V-shaped performance enhancement measure. The size of the V-shaped bar is determined according to the dimensions of the single-span wall, with a length of 2.48 m, a thickness of 0.06 m, and a height of 2.3 m. The V-shaped bar is at an angle of 65° with the lower wall, with a rib width of 0.34 m. The V-shaped bar is made of steel with the parameters shown in Table 4 and is set on both the inner and outer sides of the wall in a through-length manner, and the bars on the inner and outer sides of the wall are connected through the connecting plate at the upper end of the wall, which can enhance the device's Overall stability. Performance enhancement measures on both sides with the blocks using surface-to-surface contact, the bottom with the foundation using a binding connection, and no contact with the structural columns. Fig. 15 presents the establishment of a finite element model in ABAQUS software for the performance enhancement measure of the masonry enclosure wall.
Table 4Steel material parameters
Density (kg/m³) | Young’s modulus (MPa) | Poisson’s ratio | Yield stress (MPa) | Plastic strain |
7800 | 200000 | 0.3 | 300 | 0 |
Fig. 15Finite element model of V-shaped reinforcement

a) Diagram of V-shaped reinforcement
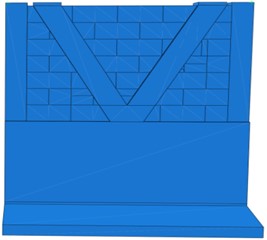
b) Inside wall diagrams
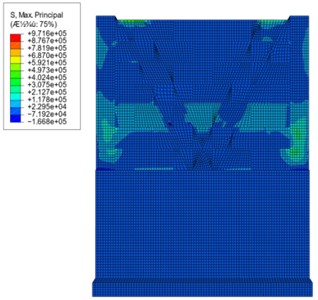
A flood depth of 0.5 m and a water velocity of 1.48 m/s are chosen to analyze the force characteristics and deformation of the masonry enclosure wall before and after reinforcement under flood loads. The aim is to evaluate the effectiveness of performance enhancement measures. The stress-strain distribution of the masonry wall before and after reinforcement is given in Figs. 16-18. The displacement of the wall before reinforcement is larger, while the displacement of the wall after reinforcement is uniformly distributed and significantly smaller than the displacement of the wall before reinforcement. By adding reinforcement materials such as reinforcements or mesh to the wall, the overall strength and stiffness of the wall can be increased. This helps to distribute the stress more evenly throughout the structure, reducing the localized stress concentrations that may occur in certain areas such as the connection with the structural column and foundation. As a result, the reinforced wall is better able to withstand external loads and is less prone to failure or deformation.
Fig. 16Comparison diagram of displacement
a) Pre-reinforcement displacement maps
b) Post-reinforcement displacement maps
Fig. 17Comparison diagram of compressive stress
a) Pre-reinforcement displacement maps
b) Post-reinforcement displacement maps
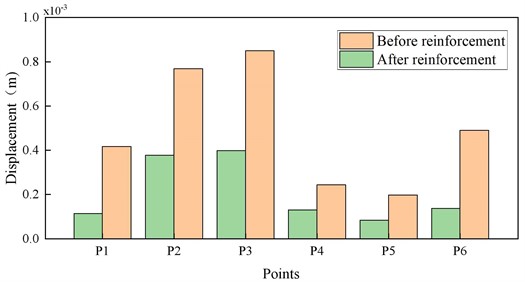
Fig. 19 presents a comparison of the displacements at different measurement points of the wall under flood load. The displacement changes at different measurement points before reinforcement are significant before reinforcement, whereas the displacement differences at different measurement points of the wall after reinforcement are minimal. At measurement point P3, the displacements of the wall before and after reinforcement were measured to be 0.85 mm and 0.39 mm, respectively, representing a reduction of 46.92 %. This reduction demonstrates that the implementation of this performance enhancement measure has the potential to significantly enhance the wall’s resistance against floods.
Fig. 18Comparison diagram of tensile stress
a) Pre-reinforcement displacement maps
b) Post-reinforcement displacement maps
Fig. 19Comparison of displacement before and after wall reinforcement
6. Conclusions
In this study, numerical simulation is carried out using ABAQUS finite element software to analyze the 500 kV substation flood wall project in Xinyang, Henan Province. The simulations are compared with the actual damage observed on-site to investigate the force performance and damage mechanism of the substation masonry enclosure wall under flood load. Further flood resistance enhancement measures are proposed to provide a reference for flood protection of substation masonry enclosure walls. The main findings are as follows:
1) Under flood loading, the stress in the masonry wall is minimal, with the highest stress concentrated at the connection between the structural column and the foundation. The displacement of the wall indicates a small response above and a large response below, gradually decreasing from the center to the sides. The deformation of the structural column is also minimal. The displacement of the structural column is smaller than that of the wall at the same height under flood load due to its higher rigidity. This suggests that the structural column experiences less deformation than the wall under flood load at the same height, and its presence restrains the deformation of the wall.
2) As flood depth or water velocity increases, the impact force of flood load on the masonry wall increases gradually. This leads to an increase in erosion depth, which can result in part of the foundation being impacted by the flood load. If the flood depth exceeds 0.8 m, water velocity exceeds 2.3 m/s, or erosion depth exceeds 0.4 m, significant displacement and stress response can be observed in the masonry wall. Furthermore, an increase in wall height leads to a decrease in total flow pressure, resulting in reduced displacement and stress. It is worth noting that the lower region at the span center (measurement point P1) experiences greater displacement, while the lower region of the wall-to-structural column connection (measurement point P7) experiences higher stress.
3) The effectiveness of the bi-lateral V-bar method significantly in reducing the maximum displacement response of the enclosure wall by approximately 46.88 % at an erosion depth of 0.5 m and a water velocity of 1.48 m/s. This demonstrates the method's effectiveness in reducing the dynamic response of the masonry wall and enhancing its flood protection capacity.
There are still many deficiencies in this research work, on the one hand, the validation of the numerical model is insufficient, and the authors will design and carry out the performance test of masonry structure under flood impact in the next research. Moreover, the current study only considered the response analysis of masonry structure under the frontal impact of flood, and has not yet carried out the analysis of the effect of parameters such as flood impact angle and wall thickness on the dynamic response of masonry structure, and the subsequent study will carry out more detailed parametric analyses to reveal the mechanism in depth.
References
-
S. Xiao and R. Cheng, “Research on the failure mechanism of rural buildings under wave-current coupling loads,” Journal of Water Resources and Building Engineering, Vol. 15, No. 2, pp. 1–8, 2017, https://doi.org/10.3969/j.issn.1672-1144.2017.02.001
-
Rosi Liem and Jürgen Köngeter, “Mobile flood protection walls: experiments and reflections on the risk of flood waves caused by a failure,” in 29th Annual Water Resources Planning and Management Conference, Jun. 1999, https://doi.org/10.1061/9780784404300
-
J. Aerts, “A review of cost estimates for flood adaptation,” Water, Vol. 10, No. 11, p. 1646, Nov. 2018, https://doi.org/10.3390/w10111646
-
J. Xia and J. Chen, “A new era of flood control strategies from the perspective of managing the 2020 Yangtze River flood,” Science China Earth Sciences, Vol. 64, No. 1, pp. 1–9, Dec. 2020, https://doi.org/10.1007/s11430-020-9699-8
-
A. Yari et al., “Deadly floods and their causal factors: A case-control study in Iran between 2005 and 2018,” International Journal of Disaster Risk Reduction, Vol. 77, p. 103036, Jul. 2022, https://doi.org/10.1016/j.ijdrr.2022.103036
-
E. Pilone and M. Demichela, “A semi-quantitative methodology to evaluate the main local territorial risks and their interactions,” Land Use Policy, Vol. 77, pp. 143–154, Sep. 2018, https://doi.org/10.1016/j.landusepol.2018.05.027
-
N. Reboul, Z. Mesticou, A. Si Larbi, and E. Ferrier, “Experimental study of the in-plane cyclic behaviour of masonry walls strengthened by composite materials,” Construction and Building Materials, Vol. 164, pp. 70–83, Mar. 2018, https://doi.org/10.1016/j.conbuildmat.2017.12.215
-
K. M. C. Konthesingha, M. J. Masia, R. B. Petersen, N. Mojsilovic, G. Simundic, and A. W. Page, “Static cyclic in-plane shear response of damaged masonry walls retrofitted with NSM FRP strips – An experimental evaluation,” Engineering Structures, Vol. 50, pp. 126–136, May 2013, https://doi.org/10.1016/j.engstruct.2012.10.026
-
A. Eslami, A. Zahedi, and H. Mirabi Banadaki, “In-plane seismic behavior of NSM strengthened adobe walls: Experimental evaluation of different reinforcements,” Engineering Structures, Vol. 246, p. 113016, Nov. 2021, https://doi.org/10.1016/j.engstruct.2021.113016
-
F. Dong, H. Wang, F. Jiang, Q. Xing, and J. Yu, “In-plane shear behavior of masonry panels strengthened with ultra-high ductile concrete (UHDC),” Engineering Structures, Vol. 252, p. 113609, Feb. 2022, https://doi.org/10.1016/j.engstruct.2021.113609
-
X. Yao, Z.-X. Guo, S. H. Basha, and Q. Huang, “Innovative seismic strengthening of historic masonry walls using polymer mortar and steel strips,” Engineering Structures, Vol. 228, p. 111507, Feb. 2021, https://doi.org/10.1016/j.engstruct.2020.111507
-
B. Torres, S. Ivorra, F. Javier Baeza, L. Estevan, and B. Varona, “Textile reinforced mortars (TRM) for repairing and retrofitting masonry walls subjected to in-plane cyclic loads. An experimental approach,” Engineering Structures, Vol. 231, p. 111742, Mar. 2021, https://doi.org/10.1016/j.engstruct.2020.111742
-
S. Ivorra, B. Torres, F. J. Baeza, and D. Bru, “In-plane shear cyclic behavior of windowed masonry walls reinforced with textile reinforced mortars,” Engineering Structures, Vol. 226, p. 111343, Jan. 2021, https://doi.org/10.1016/j.engstruct.2020.111343
-
S. Sajedi, P. A. Sheykhloo, and A. Lopez, “Design optimization of flood walls using evolutionary algorithms,” in Eighth International Conference on Case Histories in Geotechnical Engineering, pp. 247–255, Mar. 2019, https://doi.org/10.1061/9780784482087.022
-
M. Deng, X. Ma, and W. Zhang, “Experimental study on seismic performance of high ductility concrete reinforced autoclaved aerated concrete masonry walls,” Engineering Mechanics, Vol. 38, No. 7, pp. 9–18, 2021, https://doi.org/10.6052/j.issn.1000-4750.2020.06.0336
-
D. Jing, D. Qiao, and K. Xing, “Experimental study on seismic performance of brick masonry walls reinforced with prestressed steel plate strips,” Journal of Hunan University (Natural Science Edition), Vol. 48, No. 7, pp. 19–27, 2021, https://doi.org/10.16339/j.cnki.hdxbzkb.2021.07.003
-
L. Jansen, P. A. Korswagen, J. D. Bricker, S. Pasterkamp, K. M. de Bruijn, and S. N. Jonkman, “Experimental determination of pressure coefficients for flood loading of walls of Dutch terraced houses,” Engineering Structures, Vol. 216, p. 110647, Aug. 2020, https://doi.org/10.1016/j.engstruct.2020.110647
-
A. Wu, “Research on the compressive static performance of Tibetan ancient stone masonry,” Beijing Jiaotong University, 2022.
-
N. Shu and M. Wang., “The application of Hetian Liangshi wave pressure calculation formula in british standards,” China Harbour Construction, Vol. 23, No. 2, pp. 18–22, 2003, https://doi.org/10.3969/j.issn.1003-3688.2003.01.006
-
Y. Shen, Q. Zhang, C. Chen, and C. Ji, “The application of Hetian Liangshi’s wave breaking index correction formula in SWAN model,” Ganggong Technology, Vol. 54, No. 6, pp. 1–6, 2017, https://doi.org/10.16403/j.cnki.ggjs20170601
-
“Code for Design of Embankment Engineering,” GB 50286-2013, 2013.
-
S. Huang, Y. Lyu, and Y. Peng, “Effect Analysis of dynamic water pressure on dynamic response of offshore wind turbine tower,” Journal of Vibroengineering, Vol. 22, No. 1, pp. 225–238, Feb. 2020, https://doi.org/10.21595/jve.2019.20905
About this article

The authors have not disclosed any funding.
The datasets generated during and/or analyzed during the current study are available from the corresponding author on reasonable request.
Liang Zhang, Han Yao, and Qing Wang: investigation, supervision, writing-original draft. Mengqi Zhai, Yue Wu, and Chenyu Zhang: software, data curation, writing-review, and editing. Kunjie Rong: conceptualization, supervision, writing-review, and editing. Li Tian: resources, writing-review and editing.
The authors declare that they have no conflict of interest.
