Abstract
With the continuous development of the energy industry, photovoltaic power generation is gradually becoming one of the main power generation methods. However, detecting hot spot defects in photovoltaic power stations is challenging. Therefore, enhancing detection efficiency using information technology has become a crucial aspect. The study presents a defect detection model for PV power stations using the YOLOv3 (You Only Look Once v3) algorithm. The model incorporates coordinate attention module (CAM) and self-attention module (SAM) to improve feature extraction in low-resolution conditions. The Multi objective Sparrow is employed to achieve multiple objectives. It is very contributing in the detection of low-resolution features. It shows that the research method can reduce the loss value to 0.009 after 400 iterations of the loss curve test. The precision-recall (P-R) curve generated by the research method only starts to drop sharply when the Recall value reaches 0.96. The number of parameters generated by the research method is 3.46×10⁶. The detection accuracy of the research method reaches 98.86 % when there are five defective fault types. The results indicate that the proposed research method offers improved detection speed and higher accuracy in identifying hot spot defects in PV power stations. This technology provides valuable support for hot spot defect detection and presents new opportunities for the field.
1. Introduction
The rapid advancement of photovoltaic technology has elevated photovoltaic power plants to an important position in the new energy sector worldwide [1]. When constructing and operating photovoltaic power plants, the strings are susceptible to several factors, including climate change and physical damage. These factors can cause hot spot defects, thereby reducing the plant's power generation efficiency [2]. Therefore, detecting hot spot defects is critical as efficient and accurate detection can prevent power system failures, enhance power generation efficiency, and reduce energy losses. Therefore, identifying methods to quickly and accurately detect defects in photovoltaic power stations is a popular research area in the field of photovoltaic power generation [3]. In the field of hot spot defect detection, traditional image processing and machine learning methods have been widely used. However, these methods often have some problems, such as low processing efficiency and low classification accuracy. You Only Look Once v3 (YOLOv3) is a Convolutional Neural Network (CNN) based target detection algorithm with the advantages of high real-time and high accuracy [4]. Compared to traditional target detection algorithms, YOLOv3 significantly improves detection speed and accuracy by introducing Darknet-53 network structure and multi-scale feature fusion [5]. Multi objective Sparrow Search Algorithm (MSSA) is a time-frequency analysis method based on multi-scale analysis, which can improve the time-frequency resolution and noise robustness of the signal. Deep Belief Networks (DBN) is a deep learning model that can automatically extract features from images to improve the accuracy of image classification. In light of this, novel research endeavors to merge the YOLOv3 and MSSA algorithms rooted in image detection to enhance the detection accuracy using DBN. This aims to craft a fresh approach for identifying hot spot defects in photovoltaic power plants reliant on YOLOv3-MSSA. The ultimate goal is to harness emerging technologies for hot spot defect detection in photovoltaic power plants and offer viable reference technologies for the solar energy industry.
2. Related works
As clean energy continues to gain prominence as a source of power, the photovoltaic method has emerged as a critical focus of research in the energy industry. Researchers have recognized the importance of applying hot spot defect detection techniques in photovoltaic power plants. Numerous scholars have conducted extensive research on hot spot defect fault detection in photovoltaic power generation. Ramírez et al. [3] proposed a fault handling method using Internet of Things (IoT) for hot spot monitoring of photovoltaic solar panels. Fault thermal patterns such as hot spots and open circuits were recorded and calculated during the process and compared with the fault-free case. This has good fault identification accuracy and can quickly determine the fault type. Ma and his research team [6] proposed a defect fault diagnosis method grounded on I-V data for the problem of PV plant module current affected by hot spot faults. The process extracted different types of module fault characteristics and used an exponential function to amplify the fault features. It showed that the research method can effectively diagnose hot spot faults. Carletti et al. [7] proposed the early detection of hot spot defect faults in PV plants using a thermal sensing camera. The process used a PV string structure to find local maxima and to identify faults in multiple frames. Experiments showed that this method has a high accuracy in detecting hot spot defect faults. Zhang and his research team [8] proposed a detection method to extract fault features for the problem of hot spot defect faults in PV modules. The process involved characterisation of the PV modules with faults, numerical statistics, and analysis of the fault information. The conclusion was that it can effectively detect hot spot defects and is highly adaptable in different scenarios. Luciani et al. [9] proposed a detection method using I-V curves for the problem of hot spot defects caused by the ageing of photovoltaic equipment during use. The process was based on a solar simulator set up with a flash test module, and the data obtained from the test were made into a data set for calculation. This can successfully detect hot spot defects in different environments.
The You Only Look Once (YOLO) algorithm has been investigated by several scholars, including Ramadass and his team [10]. They proposed a recognition model for detecting crowd mask wearing by unmanned aircraft using YOLO. The process established a connection between the Unmanned Aerial Vehicle (UAV) and the mission planning software while extracting information from the camera-captured images. The system has demonstrated high detection efficiency and accuracy. Kim [11] proposed a control algorithm based on YOLO for the purpose of determining distinct signal intervals for traffic lights. The algorithm established the traffic situation and calculated the traffic flow to configure the appropriate traffic light timing. This method can suggest rational traffic light timing and mitigate traffic congestion. Zhang et al. [12] proposed a detection model using the YOLO algorithm for the scenario of bridge deck crack detection and repair. It used mobile network convolution to reduce the network parameters and introduced reverse residual blocks to improve the detection accuracy. Their findings can effectively perform bridge deck crack detection with high detection efficiency. Yan [13] proposed an obstacle recognition method using the YOLO algorithm to help blind individuals navigate obstacle-filled paths. The method employd 140 obstacle images during training and utilized speech to provide recognition information feedback, resulting in accurate obstacle recognition and precise speech guidance. Sichkar and Kolyubin [14] developed a detection model that utilizes the YOLO algorithm to identify and classify traffic signs objectively. The model employed shape as the key feature for sign classification, while RGB images were used for model training. This model has high detection accuracy and is feasible for practical application. Table 1 shows the literature survey and analysis.
In summary, numerous scholars have researched methods for detecting hot spot defects in photovoltaic power generation. However, such methods still have several shortcomings. Furthermore, although the YOLO algorithm has been extensively studied in various fields, there is minimal research on its use for detecting hot spot defects in photovoltaic power plants. In light of this, the study puts forward a thermal spot defect detection model for photovoltaic power plants, utilizing YOLOv3-MSSA and based on analysis of thermal spot defects. This model offers technical solutions for the photovoltaic power generation industry's advancement.
3. Design of a YOLOv3-MSSA based hot spot defect detection method for photovoltaic power stations
3.1. Design target project information of thermal spot defect detection method for photovoltaic power plants
The paper selects a photovoltaic power plant with an installed capacity of 100 MWp in Heilongjiang Province, China as the background project. The project is located at an altitude between 140 m and 185 m, and the site is saline alkali land. The annual sunshine hours in the project area exceed 2200 hours, reaching the lowest monthly sunshine hours in December and the highest monthly sunshine hours in June. The average annual total solar radiation at the project location fluctuates between 4400 MJ/m2 and 5100 MJ/m2. The photovoltaic power station selects 330 Wp polycrystalline silicon modules and uses a fixed installation method to install solar cell modules. The spacing between photovoltaic arrays should be maintained at over 14 m, with a tilt angle of 38 degrees. The spacing between the front and rear photovoltaic arrays should be greater than 11 m. The specification of the centralized inverter is 2.5 MW. The 35 kV circuit breaker utilizes a breaking current of 31.5 kA. The transformer uses a three-phase integrated transformer. The project belongs to a large-scale photovoltaic power station project.
Table 1Literature survey and analysis
Literature | Ramírez et al. [3] | Ma et al. [6] | Carletti et al. [7] | Zhang et al. [8] | Luciani et al. [9] |
Main technologies used | IoT analysis | I-V data | Thermal camera | Extract fault features | I-V curve |
Main response issues | Fault detection of solar panels | Photovoltaic module fault detection | Early detection of hot spot defects | Photovoltaic module hot spot defect detection | Detection of hot spot defects caused by equipment aging |
Technical performance | High accuracy | High suitability | High accuracy | High suitability | High suitability |
Comparison with research methods | Insufficient computational performance | Insufficient accuracy | Limited scope of use | Insufficient running speed | Limited scope of use |
3.2. Design of an improved YOLOv3-based target detection method for PV strings
Common photovoltaic power stations use photovoltaic cells to generate electricity, using the photovoltaic effect to convert light energy into electricity. When sunlight reaches the surface of a photovoltaic cell, the contained P-N in the semiconductor is activated, and the covalent bonds between the electrons are broken [15, 16]. Fig. 1 illustrates the photovoltaic power generation process.
Fig. 1Photovoltaic power generation process

In Fig. 1, illumination of a photovoltaic cell results in the formation of hole and electron pairs. These pairs then migrate towards the N and the P region. As electrons aggregate in the P section, it gains a positive charge while holes aggregate in the N section, causing an inactive charge, ultimately generating an electric potential. The electric potential is fed into the controller and is then distributed and exchanged with the electrical energy stored in the battery bank for auxiliary power generation. Depending on the need, the electrical energy is selected for direct DC load output or for AC load output from the inverter [17, 18]. The YOLO algorithm employs a CNN exclusively to forecast the class and location of diverse targets, affording a favorable computational velocity and enhancing detection efficiency for hot spot defect detection. The YOLOv3 model is utilized accordingly for PV string target detection in PV plants. In many instances, the infra-red video of the PV string is influenced by multiple factors, leading to an overabundance of information in the image. Hence, preprocessing is applied first. OpenCV is utilized to convert the color images to greyscale, thereby eliminating redundant color information and minimizing data for future calculations. Otsufa binarisation is introduced to establish the segmentation threshold for distinguishing the target from the background. A grey-scale histogram of the infrared image is created and the probabilities of the PV group string regions and background regions are calculated as shown in Eq. (1):
where, N is the sum of pixels; i represents the grayscale level; pi represents the proportion of pixels with a grayscale level of i; t represents the selected threshold value; pA represents the probability of the PV string region; pB represents the probability of the background region. The grey scale values for the PV string region and the background region are calculated as shown in Eq. (2):
where, ωA and ωB refer to the mean grey value of the PV string area and the background area. The average gray level of the infrared image for the PV string is determined by using the gray level values from various regions, as depicted in Eq. (3):
where, ω0 represents the mean grey level. The interclass variance is computed by obtaining the average grayscale of every region and the PV group string IR image. This is demonstrated in Eq. (4):
where, σ represents the inter-class variance. The grey values are processed to obtain the Otsufa binary image once the inter-class variance reaches a significant value. Coupled Head detection head is used by the YOLOv3 model for task detection and classification, as depicted in Fig. 2.
Fig. 2Coupled head network architecture

In Fig. 2, YOLOv3's Coupled Head is Anchor-Based, where detection and classification share a single convolution. Also, data is dimensionally reduced during classification and regression, leading to fewer parameters to differentiate classification and regression features [19]. The decoupling header contains one convolutional layer with a reduced number of channels and two convolutional branches [20]. Figure 2 depicts YOLOv3's Anchor-Based Coupled Head, where detection and classification utilize a single convolution. Additionally, data is dimensionally decreased during classification and regression, resulting in fewer parameters for distinguishing classification and regression features [19]:
where, zhc(h) represents the output of the c channel with a height of h. zwc(w) represents the output of the c channel with a width of w. The location of the target area of interest is determined from the output coordinate positions and the output of the CAM is shown in Eq. (6):
where, yc(i,j) contains the attention in both vertical and horizontal directions. ghc(i) and gwc(j) are obtained by convolving the horizontal and vertical directions in the spatial dimension. The CAM is separated into two one-dimensional feature vectors upon feature encoding completion, integrating the spatial location information into the mapped feature map. The self-attentive module utilizes the reference of target pixel weights in the two-dimensional image. The input signal is downsampled and transposed, then dimensionally restored via convolutional operations, as demonstrated in Eq. (7):
where, wz represents the learnable weight matrix and the self-attentive module can be plug-and-play when the value of wz is 0. The structure of the obtained improved YOLOv3 algorithm is Fig. 3.
Fig. 3 shows the placement of the CAM after the 1/16 resolution feature map to extract map channel and location details, which are then fed into the next layer for further processing. The SAM, on the other hand, is set after the 1/32 resolution feature map to capture relational information regarding location and spatial data. The use of the PV string in a low-resolution feature map environment enhances target detection capabilities.
Fig. 3Improved YOLOv3 algorithm structure

3.3. Design of a hot spot defect detection method incorporating multiobjective sparrow search algorithm
The sparrow algorithm is based on sparrows' foraging and anti-predation behavior, which divides group behavior into interconnected individual behaviors and transforms local optimal solutions into global ones. It has strong optimization capabilities for complex system problems. To enhance the accuracy of detecting hot spot defects in photovoltaic power stations, the DBN model is integrated into MSSA for optimization. DBN is formed by stacking multiple Restricted Boltzmann Machines (RBMs), which are capable of feature extraction and learning using parameters [21, 22]. The RBM is comprised of two layers: the hidden layer and the visual layer. When the condition of the visual layer is certain, the neurons in the hidden layer will be independent, facilitating parallel training of neurons thereby reducing the required training time. The energy calculation between the visual and hidden layers is demonstrated in Eq. (8):
where, s represents the visual layer; h represents the hidden layer; m represents the number of neurons; bi represents the visual layer bias; si represents the visual layer neurons; cj represents the hidden layer bias; hj represents the hidden layer neurons; wij is the neuron connection weight. The probability distribution is calculated as shown in Eq. (9):
where, P(s,h) represents the probability distribution. The activation conditions of neurons have independent properties, and when the state is determined, the hidden layer activation probabilities can be calculated. The calculation of the neuron activation probability is shown in Eq. (10):
where, P(hj=1|s) represents the activation probability of the j neuron; σ(x) is the sigmoid function. After identifying the hidden layer’s neuron states, calculating the activation probability of visual layer neurons follows. This process is demonstrated in Eq. (11):
where, P(si=1|h) represents the activation probability of the i neuron. After determining the status of the visible layer, the status of the hidden layer can be recalculated. The result is then used to project the status of the visible layer once again. The deviation between the two results is then calculated and the value is continuously adjusted to bring the deviation as close as possible to 0. The structure of DBN is shown in Fig. 4.
Fig. 4DBN structure
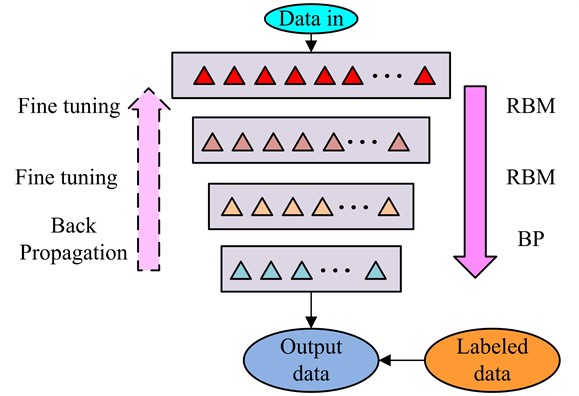
In Figure 4, the DBN structure contains several RBNs and a Back Propagation Network (BP) at the top layer. The first RBM includes a first visible layer and a second hidden layer. The second RBM involves a second and a third layer. The RBM gradually passes data up after input. If the data value deviates significantly from the true value upon reaching BP, it is back propagated until it matches the expected value before being output [23]. The initial step is the pre-training phase in which the input data is propagated forward and backward to optimize parameters locally at each stage. Then comes the fine-tuning phase, involving successive supervision of the data and fine-tuning using a parameter matrix to transform the network from a local to a global optimum. After the defective data is completed and collated, the data is normalised as shown in Eq. (12) due to the poor correlation of the parameters, resulting in a difference in the proportion of weights accounted for:
where, a* represents the data obtained after normalization; a represents the original data; ˉa means to the mean value of the covariates; aσ is the standard deviation of the data. Among the fault data, the maximum power voltage, open circuit voltage, short circuit current, and current are the most representative characteristic values. They are used as input variables to establish five diagnostic results: normal, short circuit, aging, open circuit, and shadow. The fault diagnosis model of DBN is Fig. 5.
Fig. 5DBN fault diagnosis model
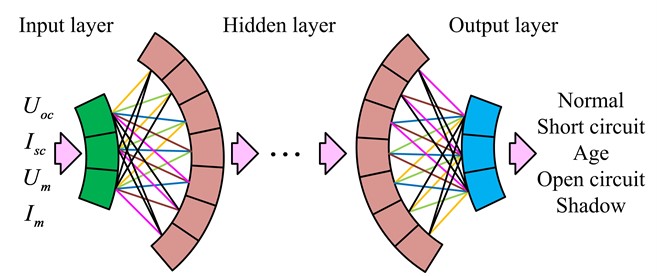
In Fig. 5, the input layer receives four types of feature data, which are processed. The model becomes self-learning upon entering the hidden layer, and all hidden layers complete the data processing, followed by outputting the data to the classifier for classification. Subsequently, the classified results are presented in the diagnosis categories. The experimental parameters need to be continuously adjusted during the model training until the best results are achieved. The sum of sparrows contained in the virtual sparrow population in MSSA is set to m, and the population fitness is calculated as shown in Eq. (13):
where, GY represents the population fitness; n represents the number of variable dimensions. During the process of foraging, the probability of a sparrow finding food first increases with its fitness level. Once food is found, the sparrow guides other members of the population and expands the search. To determine the location of food, refer to Eq. (14):
where, Zd+1i,j represents the location of the food after multiple iterations. d represents the iterations in the foraging process. α is a random number greater than 0 and less than 1. β represents the limit on the max iterations. Zdi,j represents the i-th sparrow location in the j-th dimension after d iterations. Q is a normally distributed random matrix. L is a unit column vector. The flow of the sparrow search algorithm is Fig. 6.
In Fig. 6, the max iterations need to be set when the population is initialised, after which the population adaptation value calculation is carried out and the search for an individually and globally optimal solution begins. The speed and position are updated continuously, and the adaptation value is recalculated throughout the solution process. The search concludes when the calculation outcomes meet the optimal value condition. The probability of a sparrow finding food during foraging is shown in Eq. (15):
where, Pj represents the probability of the first j sparrow finding food. Fitnessk represents the adaptation value of the first k sparrow. The optimized MSSA hotspot defect detection method is combined with the YOLOv3 PV string target detection method to obtain a YOLOv3-MSSA-based defect detection way for PV power plants.
Fig. 6Sparrow search algorithm process

4. Comprehensive performance testing of hot spot defect detection methods
4.1. Simulation performance testing of hot spot defect detection methods
To examine the YOLOv3-MSSA based defect detection method’s effectiveness for hot spot defect detection in photovoltaic power stations, the study initially evaluated the algorithm's system performance. Table 2 displays the basic software and hardware environment settings.
Table 2The experimental basic environmental parameters
Parameter variables | Parameter selection |
CPU | Intel 8 CoreTM i7-6700HQ CPU |
Memory | 16G |
GPU | NVIDIA GeForce GTX1660 |
Framework | Tensorflow |
Operating system | Wndows10 |
Operating environment | PyCharm |
Script | Python |
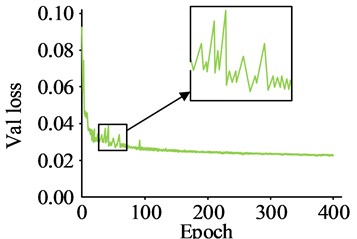
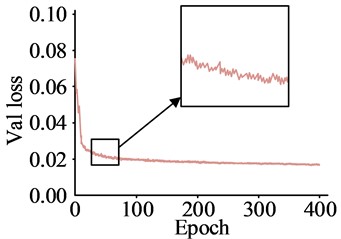
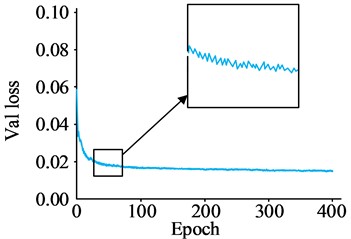
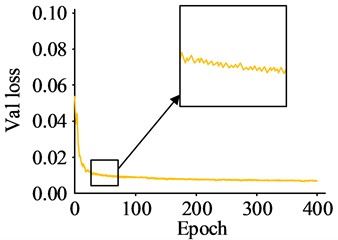
The square input image has a side length of 640 mm. The batch size is 4 and the weight attenuation is 0.0005. Additionally, the hue enhancement factor is 0.015, while the saturation enhancement factor is 0.7 and the luminance enhancement factor is 0.4. For the model training, 1800 out of the 2000 images in the dataset are used, while 200 are reserved for testing. Compare with YOLOv4s algorithm, YOLOv5s algorithm, and Fast Regions with Convolutional Neural Network Features (Faster-RCNN) algorithm during testing. The loss curve is shown in Fig. 7.
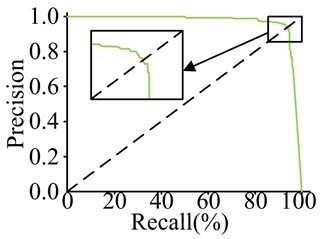
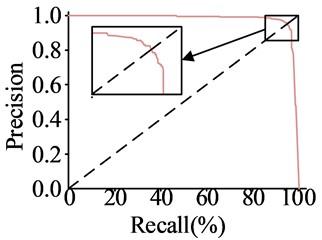
The YOLOv4s model achieved an initial loss value of 0.092, followed by a decrease to 0.024 after 400 iterations, and no significant loss curve fluctuations in the first 100 iterations. The Faster-RCNN model had an initial loss value of 0.058, which decreased to 0.017 after 400 iterations, with no substantial decline fluctuations. Finally, the research method reached an initial loss value of 0.055, which dropped to 0.009 after 400 iterations, with no major fluctuations in the decline. This indicates that the research method has good convergence and performs better on training data. The recall of the research method was tested to generate a P-R curve and the results are shown in Fig. 8.
Fig. 7Model loss curve
a) YOLOv4s
b) YOLOv5s
c) Faster-RCNN
d) Research method
Fig. 8P-R curve
a) YOLOv4s
b) YOLOv5s
c) Faster-RCNN
d) Research method
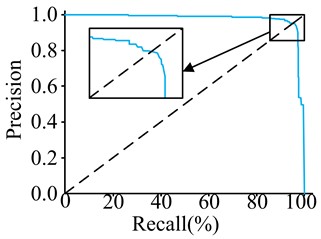
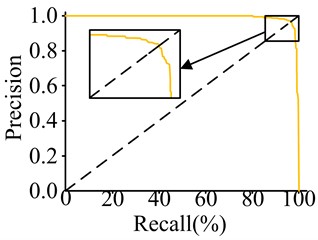
In Fig. 8, the P-R curves for all models are roughly symmetrical along the line of equal horizontal and vertical coordinates, with Precision values decreasing slowly before reaching the line of equality and starting to decrease sharply after reaching the line of equality. The Precision values for all models’ P-R curves are 1 at Recall value 0 and 0 at Recall value 1. YOLOv4s, YOLOv5s, and Faster-RC’s P-R curves display a rapid decline in Precision at a Recall value of approximately 0.91, 0.93, and 0.93, respectively. The P-R curve for Faster-RCNN exhibits a substantial decline at a Recall value of around 0.95, while the P-R curve for the experimental method shows a sharp decrease at a Recall value of approximately 0.96. The research method can detect a greater number of hot spot defects in photovoltaic power plants, reduce missed detections, and provide improved accuracy in detecting hot spot defects. Additionally, this methodology can better adapt to varying sizes and shapes of hot spot defects.
4.2. Application efficiency test of hot spot defect detection method
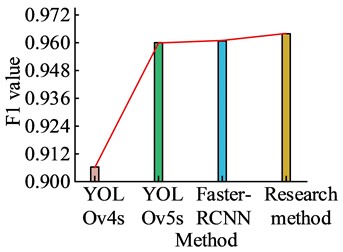
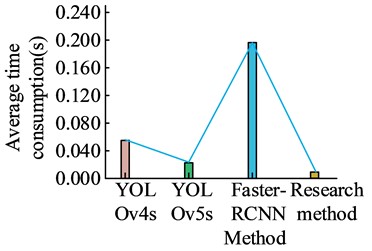
To ensure that the research method has good efficiency in the detection of hotspot defects in real PV power stations, the application effectiveness of the research method also needs to be tested. To ensure the recall, accuracy, and F1 value of the method do not exhibit significant anomalies, a confidence threshold of 0.5 is set. The F1 value, average time consumption, and parameter quantity of the research method were tested, and the results are shown in Fig. 9.
Fig. 9F1 value, average time consumption, parameter quantity test results
a) F1 value
b) Average time consumption
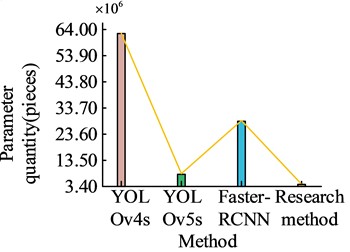
b) Parameter quantity
In Fig. 9, in terms of F1 values, YOLOv4s is 0.906. YOLOv5s is 0.960. Faster-RCNN is 0.961. The research method is 0.964, which is higher than the other methods. In terms of average elapsed time, YOLOv4s is 0.055 ms. YOLOv5s is 0.023 ms. Faster-RCNN is 0.192 ms. The research method is 0.010 ms, which is significantly lower than the other methods. In terms of the number of parameters, YOLOv4s is 6.29×10⁷. YOLOv5s is 7.06×10⁶. Faster-RCNN is 2.85×10⁷. The research method is 3.46×10⁶, which is significantly less than the other methods. The presented findings suggest that the utilized research method can strike a fine balance between achieving high accuracy and recall rates while requiring a lower average detection time. Fewer parameter quantities indicate that the research method can effectively capture key information, reducing the system pressure during subsequent calculations. The detection accuracy of the research method is tested for different defect fault types and the results are shown in Fig. 10.
In Fig. 10, the detection accuracy of Deep Convolutional Neural Network (DCNN) is 89.56 % in normal condition, 82.35 % in short circuit condition, 87.1 % in open circuit condition, 90.13 % in shadow condition and 85.51 % in aging condition. The detection accuracy of DBN is 92.60 % for DBN in normal conditions, 93.52% for short circuit, 90.33 % for open circuit, 91.68 % for shaded condition and 92.36 % for aged condition. The detection accuracy of the research method is 96.26 % in the normal case, 97.57% in the short circuit case, 98.88 % in the open circuit case, 97.63 % in the shadow case and 98.2 % in the ageing case. All of these data are higher than the other methods. This indicates that the research method has good adaptability for different types of defect faults, thus ensuring a high detection accuracy during detection. To provide an in-depth analysis of the detection accuracy of the study method, a confusion matrix is created for the test set results, as shown in Fig. 11.
Fig. 10Diagnostic accuracy
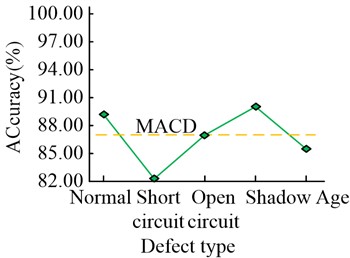
a) DCNN
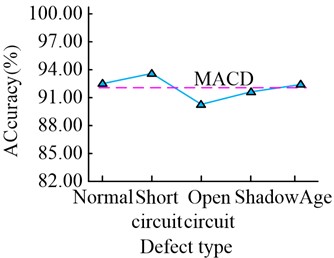
b) DBN
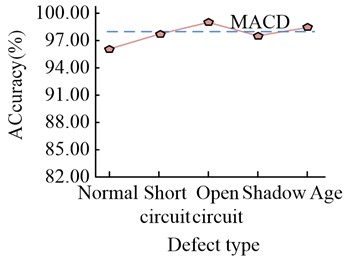
c) Research method
In Fig. 11, the five detection results of normal, short circuit, ageing, open circuit and shadowing are set to numbered tags 1-5. The misjudgment of faulty states for labels 2, 4, and 5 resulted in faulty state 3 being incorrectly identified as faulty state 4 on six occasions. The high frequency of false positives is normal due to circuit resistance becoming too high in circuits that have aged severely, resulting in the same effect as an open circuit fault. Overall, the detection accuracy of the research method reaches 98.86 %, indicating that the research method has a good judgement accuracy and is able to make good judgements for all types of hot spot defect faults. To provide a more comprehensive test of the performance of the research method, the ROC rectangular curve of the research method is plotted as shown in Fig. 12.
In Fig. 12, the ROC curve of the original DRN model is farthest from the upper left corner (U-LC) of the ROC rectangle and surrounds the smallest region. This indicates that the original DRN performs poorly in environments with changes in irradiance and temperature in photovoltaic power generation. The rectangle enclosed by AlexNet and DCNN has a larger area. The ROC curve of the research method is closest to the U-LC of the ROC rectangle and surrounds the largest region. This indicates that the research method can work smoothly in environments with changes in irradiance and temperature in photovoltaic power plants. It has good performance in hot spot defect detection. Table 3 shows the resources required for the operation of analytical research methods.
In Table 3, the research method only requires three operators to complete the operation during runtime. The minimum processor performance required at runtime is consistent with the Faster RCNN method and slightly lower than the DCNN method. When conducting the complete detection process, the DCNN method takes up to 132 seconds, the Faster RCNN method takes up to 86 seconds, and the research method only takes 21 seconds. The research method requires lower labor and material costs in actual operation.
Fig. 11Confusion matrix
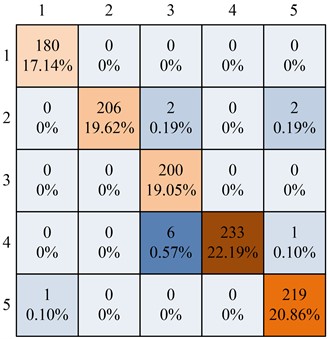
Fig. 12ROC rectangular curve
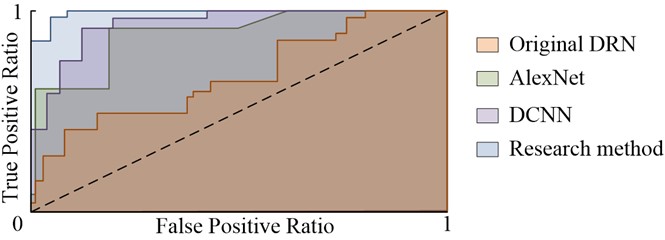
Table 3Analysis of required resources for operation
Natural resources | DCNN | Faster-RCNN | Research method |
Number of operators | 12 | 9 | 3 |
Minimum processor performance requirements | 12 threads, 6 cores, basic frequency 3.2 GHz, 8 MB cache | 8 threads, 4 cores, basic frequency 2.8 GHz, 6 MB cache | 8 threads, 4 cores, basic frequency 2.8 GHz, 6 MB cache |
The complete inspection process takes time | 132 s | 86 s | 21 s |
5. Discussion
The detection of hot spot defects in photovoltaic power plants is a key step in ensuring the normal operation of solar panels, improving power generation efficiency, extending lifespan, reducing maintenance costs, improving system reliability, and ensuring environmental sustainability. It helps to fully tap into the potential of solar power generation and promote the application and development of renewable energy. This paper designs a detection method for thermal spot defects in photovoltaic power plants based on YOLOv3 and MSSA algorithms. When analyzing the comprehensive performance of the research method, it showed good data performance in both loss values and P-R curve indicators, indicating that the research method has stronger sensitivity and adaptability to data. When conducting application efficiency analysis, the research method maintained a high F1 value while maintaining a lower calculation time, and maintained an accuracy of over 96 % in different situations. This indicates that the research method has good performance in detecting hot spot defects in photovoltaic power plants. The constructed hot spot detection method is based on large photovoltaic power plants, which can theoretically maintain high accuracy when operating in small photovoltaic power plants. However, the data processing steps in the algorithm mostly rely on large-scale data, and the operation speed in small photovoltaic power plants may not be as fast as methods specifically designed for small photovoltaic power plants.
6. Conclusions
The effective detection of hot spot defects is an important guarantee for the efficiency and safety performance of photovoltaic power stations. This study designed a PV column target detection method based on YOLOv3. Subsequently, the MSSA algorithm was introduced for defect detection, and the DBN model was introduced for neuron optimization. This study normalized the data to calculate hot spot defects. Finally, the comprehensive performance of the research method was tested. The loss curve of the research method did not show large fluctuations. The F1 value of the research way was 0.964, which was higher than others. In the average running time test, the average running time of the research method was only 0.010 ms. Among other methods, YOLOv5s, which has the lowest running time, also reached 0.023 ms. The research method was able to detect defects in normal, short circuit, aging, open circuit, and shadow, et al. The confusion matrix expressed that the research method has a maximum of 2 false positives between faults other than ageing and open circuit. In the ROC rectangular curve test, the curve generated by this research method was closest to the U-LC of the rectangle and had the largest enclosing area. The above conclusions indicate that the research method has a faster detection speed for hot spot defects in photovoltaic power plants and higher detection accuracy for different categories. Moreover, it performs well in the environment where photovoltaic power plants are exposed to changes in irradiance and temperature. The above results indicate that the research method has good detection efficiency in detecting hot spot defects in photovoltaic power plants, and can maintain high accuracy for different types of hot spot defect detection. Moreover, the research method can still operate normally in environments with changes in irradiance and temperature where photovoltaic power plants are located. This indicates that the research method can be applied to the detection of hot spot defects in large photovoltaic power plants. The paper innovatively uses the technology of image capture analysis to design a method for detecting hot spot defects in photovoltaic power plants, which can be combined with drone control technology in the future to achieve automated detection. However, the study was tested in an ideal environment and did not take into account the unexpected conditions caused by defects in some of the equipment. Therefore, further experiments need to be conducted on equipment under different operating conditions to enrich the experimental results.
References
-
L. Najafi, S. Bellani, L. Gabatel, M. I. Zappia, A. Di Carlo, and F. Bonaccorso, “Reverse-bias and temperature behaviors of perovskite solar cells at extended voltage range,” ACS Applied Energy Materials, Vol. 5, No. 2, pp. 1378–1384, Feb. 2022, https://doi.org/10.1021/acsaem.1c03206
-
Y. Su, F. Tao, J. Jin, and C. Zhang, “Automated overheated region object detection of photovoltaic module with thermography image,” IEEE Journal of Photovoltaics, Vol. 11, No. 2, pp. 535–544, Mar. 2021, https://doi.org/10.1109/jphotov.2020.3045680
-
I. Segovia Ramírez, B. Das, and F. P. García Márquez, “Fault detection and diagnosis in photovoltaic panels by radiometric sensors embedded in unmanned aerial vehicles,” Progress in Photovoltaics: Research and Applications, Vol. 30, No. 3, pp. 240–256, Mar. 2022, https://doi.org/10.1002/pip.3479
-
D. Li, H. Liu, T. Wei, and J. Zhou, “Robotic grasping method of bolster spring based on image-based visual servoing with YOLOv3 object detection algorithm,” Proceedings of the Institution of Mechanical Engineers, Part C: Journal of Mechanical Engineering Science, Vol. 236, No. 3, pp. 1780–1795, Feb. 2022, https://doi.org/10.1177/09544062211019774
-
W. A. Ezat, M. M. Dessouky, and N. A. Ismail, “Evaluation of deep learning YOLOv3 algorithm for object detection and classification,” Menoufia Journal of Electronic Engineering Research, Vol. 30, No. 1, pp. 52–57, Jan. 2021, https://doi.org/10.21608/mjeer.2021.146237
-
M. Ma, Z. Zhang, P. Yun, Z. Xie, H. Wang, and W. Ma, “Photovoltaic module current mismatch fault diagnosis based on I-V data,” IEEE Journal of Photovoltaics, Vol. 11, No. 3, pp. 779–788, May 2021, https://doi.org/10.1109/jphotov.2021.3059425
-
V. Carletti, A. Greco, A. Saggese, and M. Vento, “An intelligent flying system for automatic detection of faults in photovoltaic plants,” Journal of Ambient Intelligence and Humanized Computing, Vol. 11, No. 5, pp. 2027–2040, May 2020, https://doi.org/10.1007/s12652-019-01212-6
-
Z. Zhang, M. Ma, H. Wang, H. Wang, W. Ma, and X. Zhang, “A fault diagnosis method for photovoltaic module current mismatch based on numerical analysis and statistics,” Solar Energy, Vol. 225, No. 4, pp. 221–236, Sep. 2021, https://doi.org/10.1016/j.solener.2021.07.037
-
S. Luciani, G. Coccia, S. Tomassetti, M. Pierantozzi, and G. Di Nicola, “Use of an indoor solar flash test device to evaluate production loss associated to specific defects on photovoltaic modules,” International Journal of Design and Nature and Ecodynamics, Vol. 15, No. 5, pp. 639–646, Nov. 2020, https://doi.org/10.18280/ijdne.150504
-
L. Ramadass, S. Arunachalam, and S. Z., “Applying deep learning algorithm to maintain social distance in public place through drone technology,” International Journal of Pervasive Computing and Communications, Vol. 16, No. 3, pp. 223–234, Jun. 2020, https://doi.org/10.1108/ijpcc-05-2020-0046
-
S. D. Kim, “Situation-cognitive traffic light control based on object detection using YOLO algorithm,” International Journal of Computational Vision and Robotics, Vol. 10, No. 2, p. 133, 2020, https://doi.org/10.1504/ijcvr.2020.105682
-
Y. Zhang, J. Huang, and F. Cai, “On bridge surface crack detection based on an improved YOLO v3 algorithm,” IFAC-PapersOnLine, Vol. 53, No. 2, pp. 8205–8210, 2020, https://doi.org/10.1016/j.ifacol.2020.12.1994
-
S.- Yan, “A study on intelligent guide stick using YOLOv3 algorithm – improving spatial awareness with self-made data set,” Proceedings of Business and Economic Studies, Vol. 4, No. 3, pp. 76–87, Jun. 2021, https://doi.org/10.26689/pbes.v4i3.2203
-
V. N. Sichkar and S. A. Kolyubin, “Real time detection and classification of traffic signs based on YOLO version 3 algorithm,” Scientific and Technical Journal of Information Technologies, Mechanics and Optics, Vol. 20, No. 3, pp. 418–424, Jun. 2020, https://doi.org/10.17586/2226-1494-2020-20-3-418-424
-
Q. Wang, K. Paynabar, and M. Pacella, “Online automatic anomaly detection for photovoltaic systems using thermography imaging and low rank matrix decomposition,” Journal of Quality Technology, Vol. 54, No. 5, pp. 503–516, Oct. 2022, https://doi.org/10.1080/00224065.2021.1948372
-
S. Choudhuri, S. Adeniye, and A. Sen, “Distribution alignment using complement entropy objective and adaptive consensus-based label refinement for partial domain adaptation,” Artificial Intelligence and Applications, Vol. 1, No. 1, pp. 43–51, 2023, https://doi.org/10.47852/bonviewaia2202524
-
C. Dunderdale, W. Brettenny, C. Clohessy, and E. E. van Dyk, “Photovoltaic defect classification through thermal infrared imaging using a machine learning approach,” Progress in Photovoltaics: Research and Applications, Vol. 28, No. 3, pp. 177–188, Mar. 2020, https://doi.org/10.1002/pip.3191
-
Y. Guo, Z. Mustafaoglu, and D. Koundal, “Spam detection using bidirectional transformers and machine learning classifier algorithms,” Journal of Computational and Cognitive Engineering, Vol. 2, No. 1, pp. 5–9, Apr. 2022, https://doi.org/10.47852/bonviewjcce2202192
-
E. Nsugbe, “Toward a self-supervised architecture for semen quality prediction using environmental and lifestyle factors,” Artificial Intelligence and Applications, Vol. 1, No. 1, pp. 35–42, 2023, https://doi.org/10.47852/bonviewaia2202303
-
L. Li, X.-L. Yu, Z.-L. Liu, Z.-M. Zhao, K. Zhang, and S.-H. Zhou, “RFID tag group recognition based on motion blur estimation and YOLOv2 improved by Gaussian,” Metrology and Measurement Systems, Vol. 29, No. 1, pp. 53–74-53-74, Nov. 2023, https://doi.org/10.24425/mms.2022.138548
-
B. Fang, M. Jiang, J. Shen, and B. Stenger, “Deep generative inpainting with comparative sample augmentation,” Journal of Computational and Cognitive Engineering, Vol. 1, No. 4, pp. 174–180, Sep. 2022, https://doi.org/10.47852/bonviewjcce2202319
-
S. Liu, Y. Xu, L. Guo, M. Shao, G. Yue, and D. An, “Multi-scale personnel deep feature detection algorithm based on Extended-YOLOv3,” Journal of Intelligent and Fuzzy Systems, Vol. 40, No. 1, pp. 773–786, Jan. 2021, https://doi.org/10.3233/jifs-200778
-
P. Lu, Y. Ding, and C. Wang, “Multi-small target detection and tracking based on improved YOLO and sift for drones,” International Journal of Innovative Computing, Information and Control, Vol. 17, No. 1, pp. 205–224, 2021, https://doi.org/10.24507/ijicic.17.01.205
About this article
The authors have not disclosed any funding.
The datasets generated during and/or analyzed during the current study are available from the corresponding author on reasonable request.
Kaiming Gu proposed methods and experiments, Yong Chen analyzed the data, Kaiming Gu and Yong Chen had constructive discussions, Kaiming Gu wrote the first draft, and Yong Chen reviewed and edited this article. All authors have read and agreed to the published version of the manuscript.
The authors declare that they have no conflict of interest.

