Abstract
The complex and process-critical conditions of machineries are needed to be continuously monitored in order for incipient breakdown to detect and ensure its high performance and operating safety. The change in the resonant frequency is focused by the spectrum analysis which is caused by the structural degradation and for health monitoring, useful information is produced. A test signal is required by the spectral analysis for health monitoring of structural condition. A test signal is the easiest way for structural spectral characteristics measurement but during every measurement, a structure vibration is impractical. Several techniques are presented for the condition of a machine depending on the application monitoring. The structure health would be able to be monitored if structural vibrations are utilized for spectral characteristics measurement due to wind and ground motion. The vision-based monitoring with the sources of errors are detailed and presented in this paper. Different parameters are observed for the different signals, unify the scale and can also be used to signals errors as compared with different levels of amplitudes. The PSNR and Structural Similarity are analyzed, the PSNR value is obtained in the range of 40 dB to 50 dB and the SSIM values are nearby to the 1 for all the signals. The MAPE and MAE values obtained by the presented technique are less for all the signal samples. The presented method outperforms the existed technique by 3.21 % to 44.02 % in form of MAPE. The presented method is 3.21 % to 44.02 % better than the previously existed technique in form of MAPE. The percentage improvement of the presented method outperforms by 33.93 % and 42.43 % in terms of MAE.
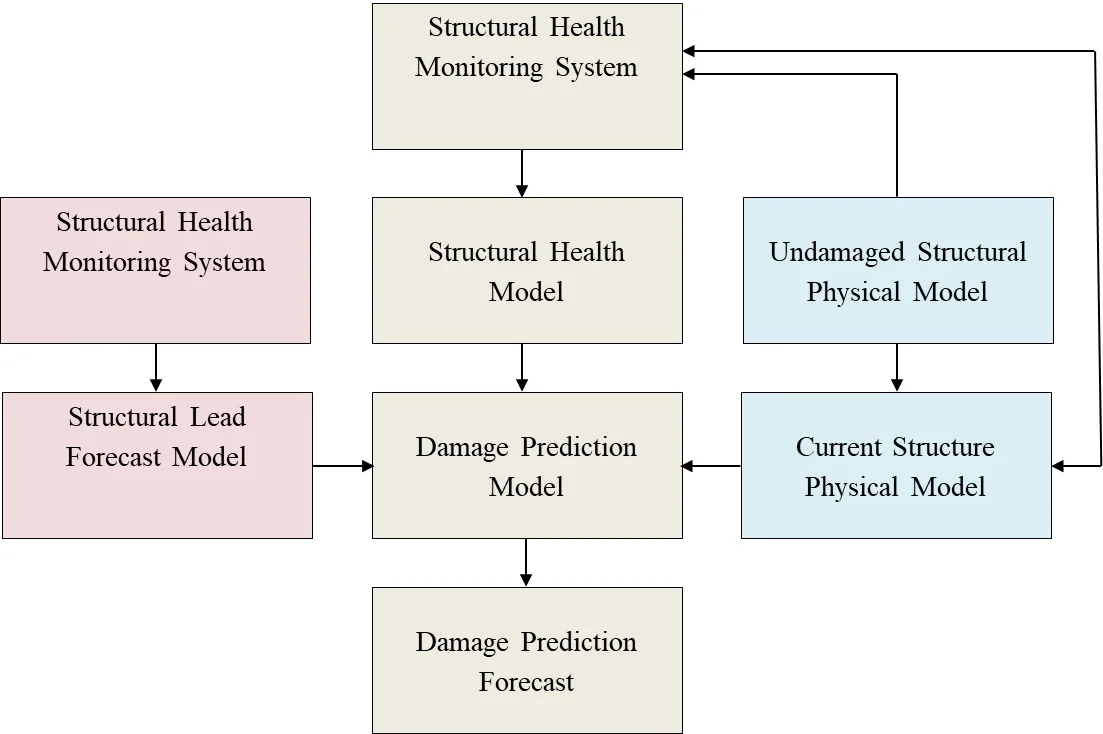
Highlights
- The change in the resonant frequency is focused by the spectrum analysis which is caused by the structural degradation and the useful information is produced.
- A test signal is required by the spectral analysis for health monitoring of structural condition. The complex conditions monitoring, expensive and process-critical machineries for incipient breakdown are detailed.
- The diagnosis of structural health condition detection and its high performance and ensurance of operating safety is discussed.
- All the time, the structure would be able to be monitored if structural vibrations are utilized for spectral characteristics measurement due to wind and so forth.
- The vision-based monitoring are detailed and presented in this paper with the errors sources.
1. Introduction
For the safety of buildings from the earthquakes and old buildings, the diagnosis of structural health condition is required properly. The resonant frequency change is focused by the spectrum analysis which is produced by the structural degradation and for health monitoring, useful information is produced [1]. A test signal is required by the spectral analysis for health monitoring of structural condition. A test signal is the easiest way for structural spectral characteristics measurement but during every measurement, a structure vibration is impractical [2, 3]. A lot of spectral information is required for this sort of measurement about external noise characteristics. The external source characteristics required by the characteristics analysis for structural health monitoring. The short-interval period (SIP) distribution is utilized in literature for analysis of the structural subject’s dominant spectral components to an unknown vibration [4-6]. In poor measuring conditions, the shape of the frequency response is represented by the SIP distribution. The frequency response variation is got by utilizing the SIP distribution of a structure subjected to non-stationary vibrations [7]. A sufficiently long signal is required by the SIP distribution as the SIP distribution’s computational process utilizes the information on the dominant frequency components.
For the evaluation of mechanical characteristics and performances, structural materials loading tests are common. The specific protocols are followed by material tests detailed by building codes when used for the construction materials qualification [8-10]. For the investigation of the structural aspects there are many testing options performed up to different levels of damage. When the structure size increases, the situation changes, it requires the experimental testing for the behavior of large structures [11]. A structural behavior’s big picture is not generally provided but the information gained is indeed useful. In low-energy tests, the dynamic input can be either assigned directly or be an ambient noise [12]. Many structural engineering applications are permitted by the data collected from vibration monitoring, ranges from system identification. General principles of earthquake-resistant design is shown in Fig. 1.
Fig. 1General principles of earthquake-resistant design
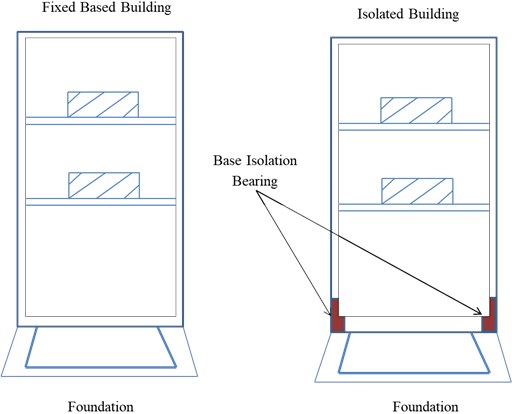
Damage of non-structural components is also caused by the drifts of the large inter-storey. The structure stiffening minimizes the inter-storey drifts but ground motion amplification is led by it which further lead to high floor acceleration, so it cause damage of the components of structure. The floor acceleration is reduced by making the flexible system. The utilization of the base isolation is the practical way for the reduction of the inter-storey drift and floor acceleration simultaneously. At the isolation level, the necessary flexibility is also provided by it with the displacements concentrated. The general configuration of a base isolated building is shown in Fig. 2.
Fig. 2Configuration of a base isolated building
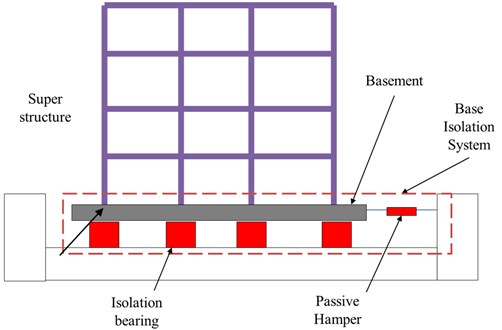
An isolation bearing is comprised and installed in between the superstructure and the foundation. The energy damping is provided by many isolation devise and the requirement of the passive damping device is eliminated.
In between the building base and the ground, utilization of the flexible pads are done by the base isolation system. When there is any shake in ground, the building nearly stationary is held by inertia while in large vibrations, the ground oscillates. Thus, due to the ground shaking, no force is transferred to the building. By decoupling the later from the ground motion, the structure is prevented by the earthquake energy. So, the ductility demand and inter-story drifts both are reduced. The data dimensionality reduction is done by the data compression techniques in which the signal size is reduced while conserving its important features or most of the energy. For non-stationary time series compression like strong motion earthquake records, expansion of wavelet packet is very effective. By conserving most of the energy for structural response records, the dramatic compression rates are achieved.
This paper aims for complex conditions monitoring, expensive and process-critical machineries for incipient breakdown. The diagnosis of structural health condition detection and its high performance and ensurance of operating safety is detailed. All the time, the structure would be able to be monitored if structural vibrations are utilized for spectral characteristics measurement due to wind and so forth. The vision-based monitoring are detailed and presented in this paper with the errors sources.
The rest of the paper is organized as follows. Section 2 provides an overview of the exhaustive literature survey followed by a methodology adopted in Section 3. A detailed discussion of obtained results is in Section 4. Finally, Section 4 concludes the paper.
2. Literature survey
For structural health monitoring, author in this paper describes the estimation of resonance dacay in the existence of non-stationary vibrations. The resonant decay characteristics and structure’s frequency response have significant role in structural health monitoring for structure changes [13]. The frequency decay is estimated by the Cumulative spectral analysis (CSA) by utilizing the impulse response. Due to the need to shake the building, measuring the buildings impulse response is impractical. Based on CSA, cumulative harmonic analysis is utilized for system damping. The scale model experiments are described in the current study and the hidden resonance decay is estimated under noise conditions. In order to detect its incipient breakdown, the complex conditions and process-critical machinery are required to be continuously monitored for incipient breakdown detection and confirm for high performance [14]. For monitoring the condition of a machine, several techniques are available depending on the application. A self-diagnosis tool is developed for monitoring machines’ conditions and Vibration monitoring of rotating machinery is also considered. Simulation and analysis of most common vibration signals are done by the vibration fault simulation rig (VFSR). The simulation and analysis of different fault conditions are done by utilizing the VFSR. In this paper, the author overviewed the induction motors signature analysis for fault detection [15]. The fundamental theory, main results, and practical applications are introduced concisely in this paper for the analysis of motor signature for practical applications. Motor Current Signature Analysis (MCSA) is described in this paper in which the spectral analyses of the stator results are utilized. The author in this paper describes the importance of contactless structural monitoring systems in recent years as there is increment in the civil engineering applications [16]. The monitoring based on vision is the solution among contactless technologies. The latest applications discussion of vision-based vibration monitoring of structures is provided by the authors in this paper. By the high-frequency resonance technique, the rolling element vibration monitoring is reviewed. The envelope signal spectrum is obtained and established by the procedure which controls the appearance of this spectrum [17]. The technique utilization is limited until the spectrum envelope is fully explained. The application of motor current spectral analysis is addressed in induction machines for rolling-element bearing damage detection. The presence of a fault condition is detected by utilization of the vibration monitoring of mechanical bearing frequencies [18]. The relationship between the vibrational and current frequencies is verified by an induction machine with different bearing faults as shown by the experimental results. For identification of the presence of a bearing fault, the stator current signature can be utilized as illustrated by the test results. In this paper, author describes that the safety and reliability of the equipment is improved by the mechanical vibration monitoring. Different problems like high-frequency signal pickup collection are faced by the existing wired monitoring technology [19]. A high-precision MEMS (Micro Electro Mechanical System) acceleration sensor is used by the monitoring node with a 16-bit resolution ADC (Analog to Digital Converter) acquisition chip for high-precision acquisition of vibration signals achievement. Finally, the comparison of this method reconstruction accuracy and the traditional reconstruction algorithm is done and the analysis of reconstruction performance is performed for different parameters. Author in this paper discussed the natural frequency utilization as a diagnostic parameter for the procedure of structural assessment. The presented approach is natural frequencies based which are structural integrity of sensitive indicators [20]. The structural condition is utilized to monitor and the periodical frequency measurements analysis is done. An inexpensive structural assessment technique is provided by the approach since it cheaply acquires the frequency measurements. The frequency changes and structural damage are related to each other which are discussed here in this paper. By utilizing the natural frequencies, damage is detecting by the various methods. Author described the Medium-voltage (MV) induction motors which are broadly utilized and important for the industrial process [21]. The high repair expenses are not only led by the MV motors breakdown extraordinary financial losses are also caused due to downtime. The condition monitoring reliability is provided and existing condition monitoring and protection methods survey is presented in this paper. There is different area and the approach is discussed and the MV motors features are detailed the existing methods effectiveness in terms of their accuracy and implementation complexity. Authors in this paper present the description of chemical diagnostics techniques utilization along with their interpretation schemes [22]. Different chemical techniques are discussed here and the exceptional importance is gained by the electrical diagnostic techniques. At low frequencies, the current measurement among these techniques return voltage measurement are the most widely used.
3. Methodology
A high speed digital optical camera is connected with the personal computer (PC) by image data acquisition system for capturing the most dominant vibration signal modes precisely. The non-physical modes are involved in it induced by the insufficient frame rates and a Prosilica CV640C CMOS high-speed camera is utilized by the image system. The high speed camera has the maximum frame rate of 500 FPS with the 640×480 resolution. The 85 mW of maximum power, DC 5 V of the maximum voltage, 30 mA mean current and the 120 mA of peak current are the specifications of the light source.
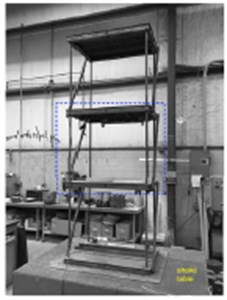
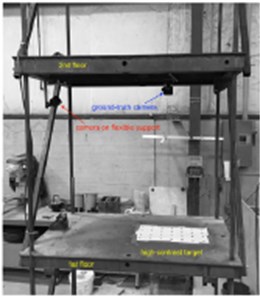
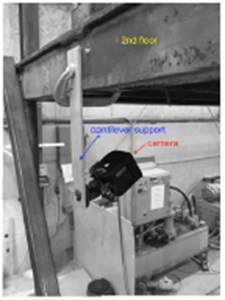
A laboratory experiment was designed for verification and the three-story building model shown in Fig. 4 was selected for the presented approach validation. On a single-axis shake table, a model is fixed as shown in Fig. 3(a). In the second floor, the interstory drift was captured by the camera. In the underside of the second floor, camera is mounted to view the first floor as shown in Fig. 3(b). The configuration of the one camera is to be perpendicular to the floor serves as the “ground truth” for the measurement of the vision based procedure. At the edge of the second floor, other camera was attached for the flexible support simulation as presented in Fig. 3(c) for the angle representation in the surveillance camera.
The complex and process-critical machineries conditions are monitored by designing the technique in order for incipient breakdown. This technique helps structural health condition detection and to ensure its high operating safety. It monitored all the time if structural vibrations are utilized for spectral characteristics measurement. The set of video cameras is required to make this system; it acquires the recordings during monitoring and processed later. To obtain images with adequate resolution, the selection of appropriate lenses must be required depending on the structure to be monitored and camera’s distance [23, 24]. For conducting measurements in positions, the lighting lamps could be added with occasional illumination. The monitoring process consists of the following phases:
1) Installation: The connection and synchronization of the video cameras to the computer [25, 26].
2) Calibration: The coordinates of pixel and the physical coordinate’s relationship is obtained.
3) Video processing: The videos recordings are done and each target motion is tracked in the image sequences.
Fig. 3The experimental setup: a) building model; b) vision-based camera configuration and c) surveillance camera on cantilever support
a)
b)
c)
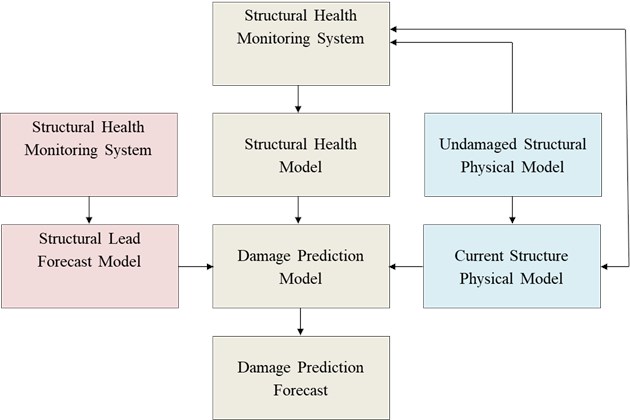
A simple flowchart for schematic representation is depicted in Fig. 4.
Fig. 4Flowchart for schematic representation
3.1. Errors and uncertainties
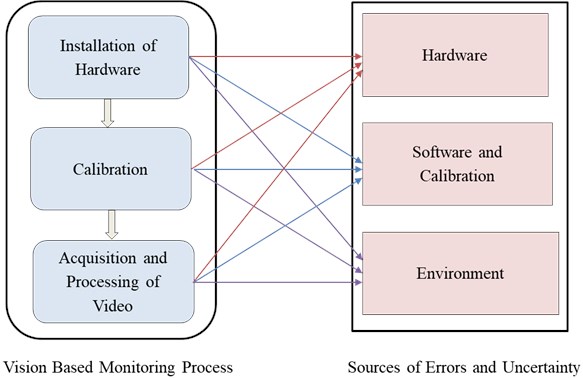
The vision-based system’s accuracy cannot be video camera’s technical specifications related. It is different from the other measurement approaches where the manufacturers provide the system’s accuracy [27-30]. During a given calibration time span, it generally remain stable within assigned operational conditions. To determine the accuracy of vision-based monitoring system is rather complex problem as it is multifaceted combination dependent. In vision-based monitoring, there are sources of errors and uncertainties which are divided into different groups:
1) Intrinsic to the monitoring hardware.
2) The synchronization process relevancy.
3) Environmental, e.g., vibrations induced in the non-uniform air refraction.
The possible interactions between the sources of errors and the vision-based monitoring process are shown in Fig. 5.
Fig. 5Diagram of the vision-based monitoring and relations with the sources of errors and uncertainties
The most favorable locations are accessed by the camera installation, in up-to-date software and in accurate calibration controls [31, 32]. The ambient light variations and temperatures faced by it inducing the vibrations in the cameras. In comparison to conventional monitoring procedures; there is larger impact of errors on vision-based monitoring when there was direct contact of sensors with the object [33].
4. Results and discussion
Data compression is accomplished by expanding the signal in a wavelet basis and the insignificant expansion coefficients are dropped based on an adopted rule which depends on the specific application. By dropping the detail coefficients that correspond to the smaller scales, creating a lower resolution approximation of the signal is consisted in the one rule. These are desirable for the applications where coarser scales features are considered. Another rule is thresholding based, consisting some specific applications and the coefficient that have magnitude smaller than that level are dropped. If the signal has some significant higher resolution features, then this rule is utilized and the features are conserved. The high-resolution features are conserved by this method which is associated with a large wavelet coefficient and the less significant features are dropped. Other thresholding schemes can also be defined depending upon the applications. There is close relation of data compression to the nonparametric estimation and removal of noise as these both are principle of “shrinking” based having insignificant coefficients.
In a 7-story reinforced building, the acceleration records in the city of Van Nuys of the Los Angeles metropolitan area are illustrated and the data was provided by California Div. of Mines and Geology. By the 1994 Northridge earthquake, this building was severely damaged. The efficiency of the representation in the (discrete) wavelet domain is illustrated in Fig. 6. The fraction of the total energy is showed by it which is represented by the top coefficients as function of their number. The Northridge building’s EW accelerations are recorded at the ground and roof. The most of the energy are represented by the very few of the top coefficients.
Fig. 6Fraction of total energy represented by top coefficients v/s number for acceleration records at the ground floor and at the roof from earth quake north-ridge 1994
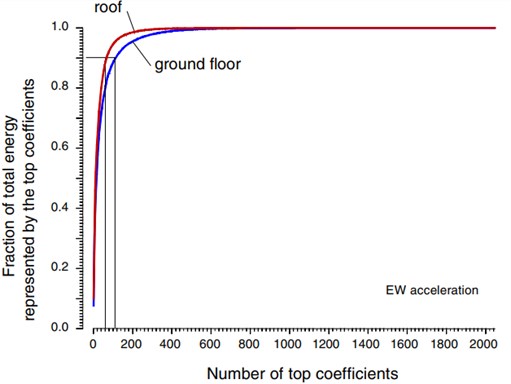
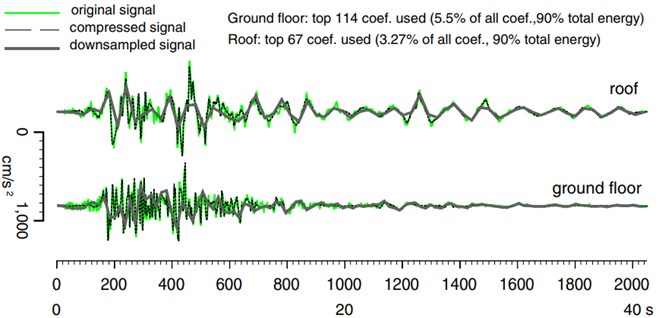
Fig. 7 shows the effect of reduction of dimensionality by subsampling and thresholding. It is observe that the high frequency content is preserved by the thresholding compression and it is much significant while subsampling does not. For earthquake records, the root mean square error is transient in nature which is small and dependent on the nature of the excitation.
Fig. 7Comparison of results of reduction of dimensionality by shrinkage of the less significant coefficients and by sub-sampling
4.1. Statistical analysis of the signal vibration in system
The mostly used performance metrics like Mean Absolute Error (MAE), Mean Absolute Percentage Error (MAPE) and Peak Signal to Noise Ratio (PSNR) are utilized for the evaluation of the presented model. The research community highly accepted these parameters for the signal quality evaluation. These are utilized for the analysis of the global behavior and model development. The MAE is insensitive to the outliers and used for forecast evaluation. These parameters are observed for the different samples of signals, unify the scale and can also be used to signals errors as compared with different levels of amplitudes as tabulated in Table 1. The graphically representation of these metrics are also shown in Fig. 8 for better visualization and analysis.
Table 1Different parameters obtained for different scenarios by the proposed method
Signals samples | Proposed method | |||
MAPE (%) | MAE | PSNR (dB) | SSIM | |
1 | 1.87 | 0.372 | 48.34 | 0.92 |
2 | 1.94 | 0.399 | 45.65 | 0.89 |
3 | 2.01 | 0.412 | 42.43 | 0.85 |
4 | 1.99 | 0.401 | 46.72 | 0.91 |
5 | 1.84 | 0.331 | 51.56 | 0.96 |
Fig. 8MAPE and MAE for different signal samples
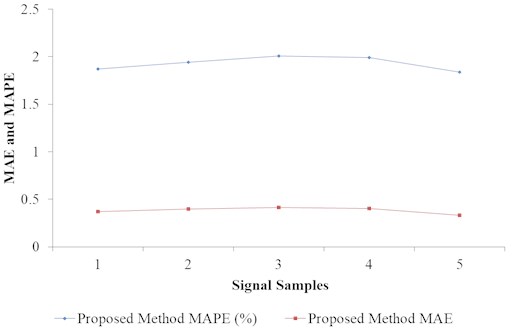
Fig. 9PSNR (dB) for different signal samples
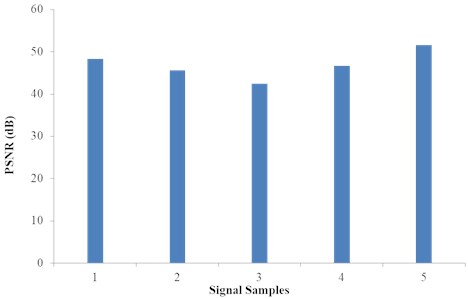
Fig. 10SSIM for different signal samples
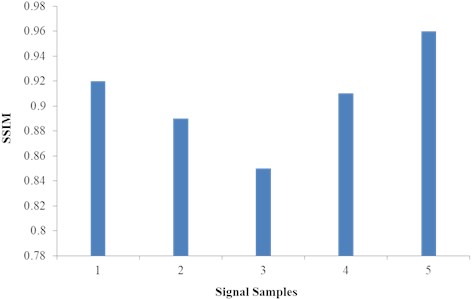
It is observed from the Fig. 9 that the errors are measured for different signals and it shows the quality of the signal. The quality of the signal is poor if the value of MAE and MAPE is large. High quality of signal is achieved if the MAE and MAPE are less. The Other parameters like PSNR and SSIM are also presented graphically in Figs. 9 and 10. The typical value of the PSNR is in the range of 30 dB to 50 dB, for lossless recovery, it is infinite. The range of SSIM is in between 0 to1. If the obtained SSIM approaches to 1 then the obtained signal are good in quality otherwise it will be poor quality signal.
It is depicted from the above figures of PSNR and SSIM, the value of PSNR is obtained in the range of 40 dB to 50 dB and the SSIM values are nearby to the 1 for all the signals. High values of PSNR and SSIM shows the better quality of the signal.
4.2. Comparison of the presented technique with the existing work
The presented technique is compared with the existing work in terms of MAPE and MAE for different signals. The values of MAPE and MAE for the existing and the presented technique are tabulated in Table 2 and graphically represented in Fig. 11 for better analysis.
Table 2MAPE and MAE comparison of the proposed technique with existing technique
Signal samples | Existing technique [16] | Proposed technique | ||
MAPE | MAE | MAPE | MAE | |
1 | 1.93 | 0.563 | 1.87 | 0.372 |
2 | 1.99 | 0.643 | 1.94 | 0.399 |
3 | 2.25 | 0.626 | 2.01 | 0.412 |
4 | 2.54 | 0.611 | 1.99 | 0.401 |
5 | 2.65 | 0.575 | 1.84 | 0.331 |
Fig. 11Comparison of proposed technique with existing technique in terms of MAPE and MAE
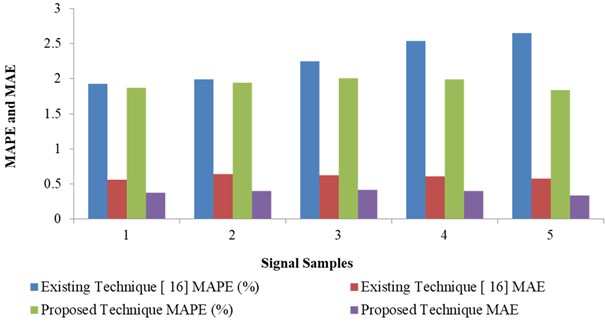
It is clear from the Fig. 11 that the MAPE and MAE values obtained by the presented technique are less for all the signal samples. The percentage improvement of the presented technique is also calculated and presented in Table 3 in terms of MAPE and MAE.
Table 3Percentage improvement of the proposed technique over existing technique
Different samples of signals | Percentage improvement over existing technique | |
In terms of MAPE | In terms of MAE | |
1 | 3.21 % | 33.93 % |
2 | 2.58 % | 37.95 % |
3 | 11.94 % | 34.19 % |
4 | 27.64 % | 34.37 % |
5 | 44.02 % | 42.43 % |
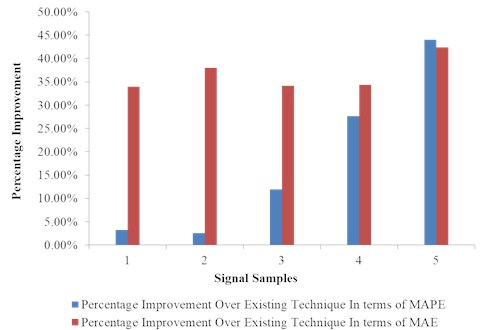
The graphical representation of the percentage improvement is also shown in Fig. 12 for better visualization.
It is clear from the Fig. 12 that the presented method is 3.21 % to 44.02 % better than the previously existed technique in form of MAPE. The percentage improvement of the presented method outperforms by 33.93 % and 42.43 % in terms of MAE.
Fig. 12Percentage improvement of the proposed technique in terms of MAPE and MAE
5. Conclusions
The specific protocols are followed by material tests detailed by building codes when used for the construction materials qualification. For the investigation of the structural aspects there are many testing options performed up to damage of different levels. When the size of the structure increases, the situation changes, it requires the experimental testing for the behavior of large structures. The structure health would be able to be monitored if structural vibrations are utilized for spectral characteristics measurement due to wind and ground motion. The vision-based monitoring with the sources of errors are detailed and presented in this paper. Different parameters are observed for the different signals, unify the scale and can also be used to signals errors as compared with different levels of amplitudes. The PSNR and Structural Similarity are analyzed, the PSNR value is obtained in the range of 40 dB to 50 dB and the SSIM values are nearby to the 1 for all the signals. The MAPE and MAE values obtained by the presented technique are less for all the signal samples. The presented method outperforms the existed technique by 3.21 % to 44.02 % in form of MAPE. The percentage improvement of the presented method is 33.93 % and 42.43 % better in terms of MAE. The main drawback of this technique is its tendency for smooth spectral estimates production of the acquired data that make it almost impossible for location variation with respect to fault conditions. For the modern industry development, the mechanical vibration principles can also explored in the future.
References
-
G. Busca, A. Cigada, P. Mazzoleni, and E. Zappa, “Vibration monitoring of multiple bridge points by means of a unique vision-based measuring system,” Experimental Mechanics, Vol. 54, No. 2, pp. 255–271, Feb. 2014, https://doi.org/10.1007/s11340-013-9784-8
-
B. F. Spencer, V. Hoskere, and Y. Narazaki, “Advances in computer vision-based civil infrastructure inspection and monitoring,” Engineering, Vol. 5, No. 2, pp. 199–222, Apr. 2019, https://doi.org/10.1016/j.eng.2018.11.030
-
Y. Xu and J. M. W. Brownjohn, “Review of machine-vision based methodologies for displacement measurement in civil structures,” Journal of Civil Structural Health Monitoring, Vol. 8, No. 1, pp. 91–110, Jan. 2018, https://doi.org/10.1007/s13349-017-0261-4
-
G. L. Mariottini et al., “Vision-based localization for leader-follower formation control,” IEEE Transactions on Robotics, Vol. 25, No. 6, pp. 1431–1438, Dec. 2009, https://doi.org/10.1109/tro.2009.2032975
-
K. Gopalakrishnan, S. K. Khaitan, A. Choudhary, and A. Agrawal, “Deep convolutional neural networks with transfer learning for computer vision-based data-driven pavement distress detection,” Construction and Building Materials, Vol. 157, pp. 322–330, Dec. 2017, https://doi.org/10.1016/j.conbuildmat.2017.09.110
-
D. Feng, M. Feng, E. Ozer, and Y. Fukuda, “A vision-based sensor for noncontact structural displacement measurement,” Sensors, Vol. 15, No. 7, pp. 16557–16575, Jul. 2015, https://doi.org/10.3390/s150716557
-
C. Koch, K. Georgieva, V. Kasireddy, B. Akinci, and P. Fieguth, “A review on computer vision based defect detection and condition assessment of concrete and asphalt civil infrastructure,” Advanced Engineering Informatics, Vol. 29, No. 2, pp. 196–210, Apr. 2015, https://doi.org/10.1016/j.aei.2015.01.008
-
D. Zhang, J. Guo, X. Lei, and C. Zhu, “A high-speed vision-based sensor for dynamic vibration analysis using fast motion extraction algorithms,” Sensors, Vol. 16, No. 4, p. 572, Apr. 2016, https://doi.org/10.3390/s16040572
-
D. Lee and Y. Park, “Vision-based remote control system by motion detection and open finger counting,” IEEE Transactions on Consumer Electronics, Vol. 55, No. 4, pp. 2308–2313, Nov. 2009, https://doi.org/10.1109/tce.2009.5373803
-
M. El Hachemi Benbouzid, “A review of induction motors signature analysis as a medium for faults detection,” IEEE Transactions on Industrial Electronics, Vol. 47, No. 5, pp. 984–993, 2000, https://doi.org/10.1109/41.873206
-
A. K. S. Jardine, D. Lin, and D. Banjevic, “A review on machinery diagnostics and prognostics implementing condition-based maintenance,” Mechanical Systems and Signal Processing, Vol. 20, No. 7, pp. 1483–1510, Oct. 2006, https://doi.org/10.1016/j.ymssp.2005.09.012
-
A. Sharma and R. Kumar, “Service-level agreement-energy cooperative quickest ambulance routing for critical healthcare services,” Arabian Journal for Science and Engineering, Vol. 44, No. 4, pp. 3831–3848, Apr. 2019, https://doi.org/10.1007/s13369-018-3687-z
-
S. Goto, Y. Takahashi, and M. Tohyama, “Structural vibration monitoring using cumulative spectral analysis,” Advances in Acoustics and Vibration, Vol. 2013, pp. 1–7, Mar. 2013, https://doi.org/10.1155/2013/158329
-
M. J. Salami, A. Gani, and T. Pervez, “Machine condition monitors and fault diagnosis using spectral analysis techniques,” in First International Conference on Mechatronics, 2001.
-
N. Bessous, S. E. Zouzou, W. Bentrah, S. Sbaa, and M. Sahraoui, “Diagnosis of bearing defects in induction motors using discrete wavelet transform,” International Journal of System Assurance Engineering and Management, Vol. 9, No. 2, pp. 335–343, Apr. 2018, https://doi.org/10.1007/s13198-016-0459-6
-
A. Zona, “Vision-based vibration monitoring of structures and infrastructures: an overview of recent applications,” Infrastructures, Vol. 6, No. 1, Dec. 2020, https://doi.org/10.3390/infrastructures6010004
-
P. D. Mcfadden and J. D. Smith, “Vibration monitoring of rolling element bearings by the high-frequency resonance technique – a review,” Tribology International, Vol. 17, No. 1, pp. 3–10, Feb. 1984, https://doi.org/10.1016/0301-679x(84)90076-8
-
R. R. Schoen, T. G. Habetler, F. Kamran, and R. G. Bartfield, “Motor bearing damage detection using stator current monitoring,” IEEE Transactions on Industry Applications, Vol. 31, No. 6, pp. 1274–1279, 1995, https://doi.org/10.1109/28.475697
-
X. Lei and Y. Wu, “Research on mechanical vibration monitoring based on wireless sensor network and sparse Bayes,” EURASIP Journal on Wireless Communications and Networking, Vol. 2020, No. 1, pp. 1–13, Dec. 2020, https://doi.org/10.1186/s13638-020-01836-9
-
O. S. Salawu, “Detection of structural damage through changes in frequency: a review,” Engineering Structures, Vol. 19, No. 9, pp. 718–723, Sep. 1997, https://doi.org/10.1016/s0141-0296(96)00149-6
-
P. Zhang, Y. Du, T. G. Habetler, and B. Lu, “A survey of condition monitoring and protection methods for medium-voltage induction motors,” IEEE Transactions on Industry Applications, Vol. 47, No. 1, pp. 34–46, Jan. 2011, https://doi.org/10.1109/tia.2010.2090839
-
T. K. Saha, “Review of modern diagnostic techniques for assessing insulation condition in aged transformers,” IEEE Transactions on Dielectrics and Electrical Insulation, Vol. 10, No. 5, pp. 903–917, Oct. 2003, https://doi.org/10.1109/tdei.2003.1237337
-
A. Sabato, C. Niezrecki, and G. Fortino, “Wireless MEMS-based accelerometer sensor boards for structural vibration monitoring: a review,” IEEE Sensors Journal, Vol. 17, No. 2, pp. 226–235, Jan. 2017, https://doi.org/10.1109/jsen.2016.2630008
-
J. P. Amezquita-Sanchez and H. Adeli, “Signal processing techniques for vibration-based health monitoring of smart structures,” Archives of Computational Methods in Engineering, Vol. 23, No. 1, pp. 1–15, Mar. 2016, https://doi.org/10.1007/s11831-014-9135-7
-
M. D. Kohler, P. M. Davis, and E. Safak, “Earthquake and ambient vibration monitoring of the steel-frame UCLA Factor building,” Earthquake Spectra, Vol. 21, No. 3, pp. 715–736, Aug. 2005, https://doi.org/10.1193/1.1946707
-
R. D. Nayeri, S. F. Masri, R. G. Ghanem, and R. L. Nigbor, “A novel approach for the structural identification and monitoring of a full-scale 17-story building based on ambient vibration measurements,” Smart Materials and Structures, Vol. 17, No. 2, p. 025006, Apr. 2008, https://doi.org/10.1088/0964-1726/17/2/025006
-
N. Gebraeel, M. Lawley, R. Liu, and V. Parmeshwaran, “Residual life predictions from vibration-based degradation signals: a neural network approach,” IEEE Transactions on Industrial Electronics, Vol. 51, No. 3, pp. 694–700, Jun. 2004, https://doi.org/10.1109/tie.2004.824875
-
A. Sharma and R. Kumar, “Risk-energy aware service level agreement assessment for computing quickest path in computer networks,” International Journal of Reliability and Safety, Vol. 13, No. 1/2, p. 96, 2019, https://doi.org/10.1504/ijrs.2019.097019
-
D. Goyal and B. S. Pabla, “The Vibration Monitoring Methods and Signal Processing Techniques for Structural Health Monitoring: A Review,” Archives of Computational Methods in Engineering, Vol. 23, No. 4, pp. 585–594, Dec. 2016, https://doi.org/10.1007/s11831-015-9145-0
-
F. Vidal, M. Navarro, C. Aranda, and T. Enomoto, “Changes in dynamic characteristics of Lorca RC buildings from pre – and post-earthquake ambient vibration data,” Bulletin of Earthquake Engineering, Vol. 12, No. 5, pp. 2095–2110, Oct. 2014, https://doi.org/10.1007/s10518-013-9489-5
-
R. Kumar and H. Saini, “Secure, resilient and green computing in wireless sensor networks,” Recent Advances in Electrical and Electronic Engineering (Formerly Recent Patents on Electrical and Electronic Engineering), Vol. 13, No. 2, pp. 128–129, Apr. 2020, https://doi.org/10.2174/235209651302200224110206
-
C. Michel, A. Karbassi, and P. Lestuzzi, “Evaluation of the seismic retrofitting of an unreinforced masonry building using numerical modeling and ambient vibration measurements,” Engineering Structures, Vol. 158, pp. 124–135, Mar. 2018, https://doi.org/10.1016/j.engstruct.2017.12.016
-
H. Al-Nimry, M. Resheidat, and M. Al-Jamal, “Ambient vibration testing of low and medium rise infilled RC frame buildings in Jordan,” Soil Dynamics and Earthquake Engineering, Vol. 59, pp. 21–29, Apr. 2014, https://doi.org/10.1016/j.soildyn.2014.01.002

