Abstract
The loads acting on rapid maneuver aircrafts are characterized by high accelerations, high jerks and multiple directions in the space. The flight simulation tests for aircraft loads are usually carried out on a three-axis centrifuge. Due to the difference between flight and centrifugal environments, the loads in the simulation tests are not completely consistent with those in the actual flight environment. To verify that the dynamic responses of aircrafts in the three-axis centrifuge can be used to predict the responses in the flight environment, a beam installed in the three-axis centrifuge is considered. The velocity and acceleration models of the beam are established by the motion synthesis method. The rigid-flexible coupling dynamic equations of the beam are derived using the Kane’s method. Under different flight accelerations, the dynamic responses of beam in the three-axis centrifugal environment are simulated, which agree well with the responses in the flight environment. Besides, the influence of accelerations and jerks on the responses is analyzed. The results of this paper demonstrate that the present dynamic model can be used effectively to predict the experimental results in flight environments.
Highlights
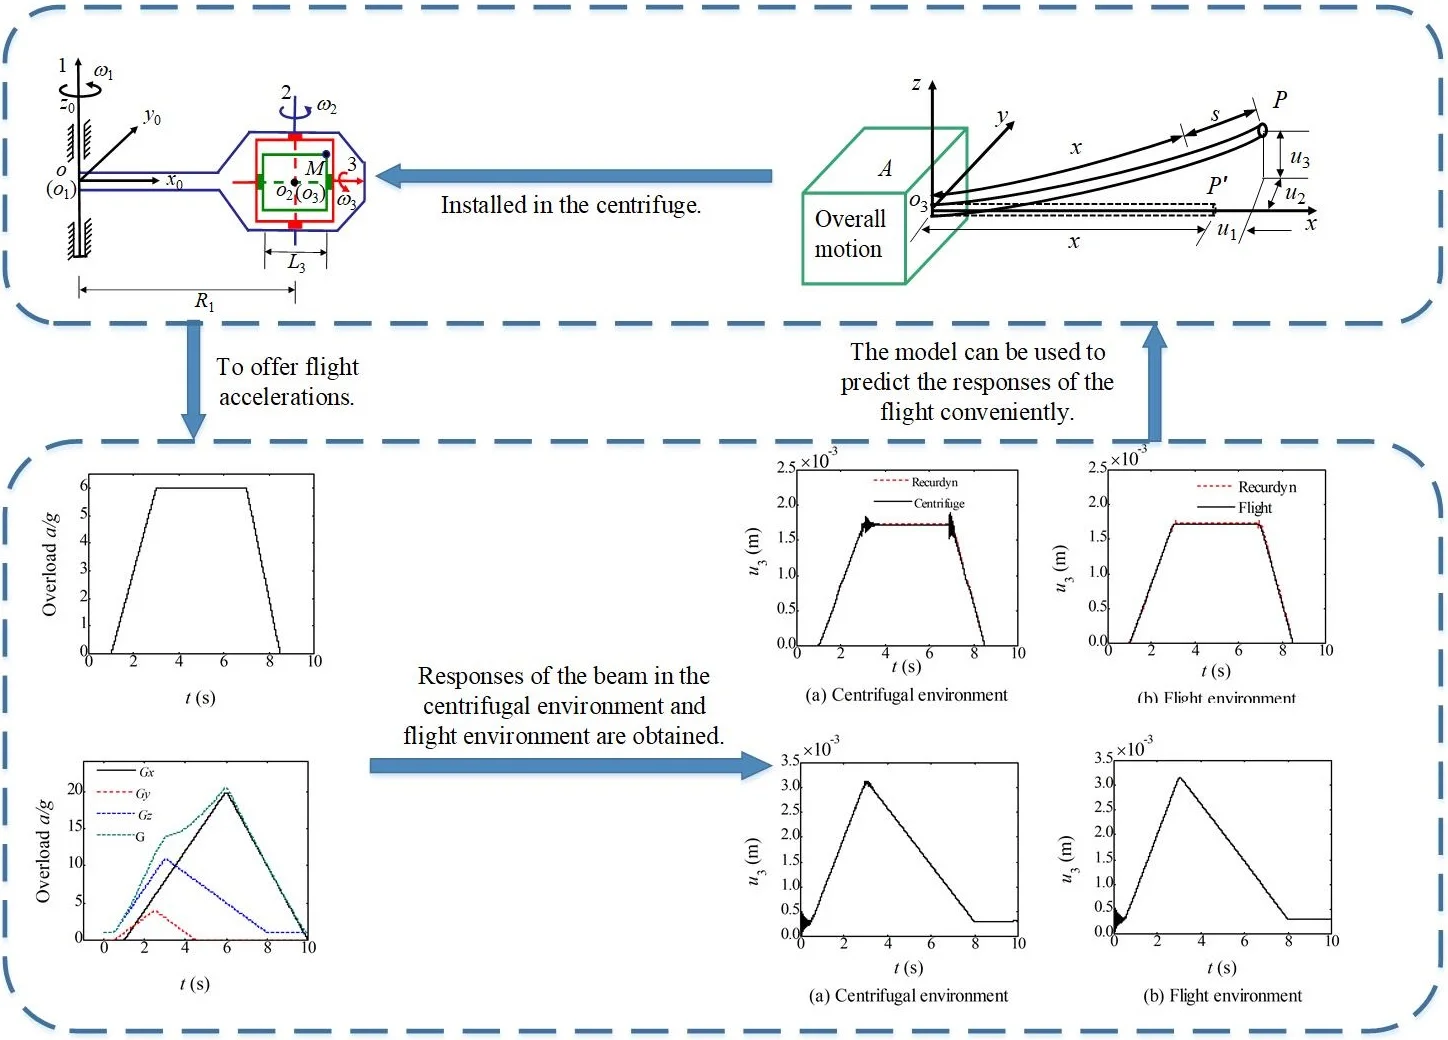
- A three-axis centrifuge is used to offer flight accelerations.
- The velocity and acceleration models of the beam are established.
- The rigid-flexible dynamic model of the beam installed in the three-axis centrifuge is established.
- The dynamic responses of beam in centrifugal and flight environments are simulated.
- The influence of jerks on the responses are discussed.
- The dynamic model can be used effectively to predict the experimental results in flight environments.
1. Introduction
With the rapid development of the aerospace technologies, greater maneuverability of aircrafts are required, which results in that aircrafts bear three-dimensional and high accelerations with high change rates (jerks). Some flight accelerations could reach as high as 20 g, and jerks could also reach 15 g/s [1]. This kind of load environment has a great impact on the performance of aircraft structures and airborne electronic equipment. In some cases, the loads induced by the accelerations could even cause fatal damage. To ensure the safety of aircrafts, the dynamic flight simulation (DFS) tests are indispensable and important for the aircraft design.
In the field of dynamic flight simulation tests, Sinapius [2] used modal force synthesis techniques to determine the test load to ensure that the test results reflect the actual flight conditions. Chen [3], Han [4] and Qiu [5, 6] et al. performed dynamic flight simulation tests on different vibration platforms that can provide accelerations in three directions. However, these vibration platforms are not able to provide sustained acceleration levels due to the stroke limitation of the prismatic actuation devices. Centrifuges can provide sustained forces to simulate the high-g flight accelerations [7-9]. Three-axis centrifuges with 3 degree-of-freedom not only have the advantages of providing sustained high-g accelerations, but also have the ability to provide abrupt accelerations. Kiefer [10], Jr [11], Glaser [12] and Dourado [13] et al. used centrifuges to simulate the flight environment, which demonstrated that the three-axis centrifuge can be used to simulate the three-dimensional flight environment with high fidelity.
Although the three-axis centrifuge can be used to offer flight accelerations, only the accelerations of key points are the same with that in the flight environment. It is because that the distribution of accelerations on the aircraft presents gradient change in the centrifuge test, while the distribution of accelerations in the flight environment is assumed to be uniform. This means that the simulation accelerations and the flight accelerations are not exactly the same. Hence the problem whether the dynamic responses of aircrafts obtained by the centrifugal test agree well with the responses in the flight environment arises, which is the precondition to carry out dynamic flight simulations using centrifuges and thus worth of further investigations.
In this paper, a beam in the flight environment is considered. The beam is installed in the three-axis centrifuge, and the rigid-flexible dynamic model of the beam is established using the Kane’s method [14, 15]. The dynamic responses of the beam in the centrifugal and flight environments are then calculated, and the consistency of which is discussed subsequently. The obtained results indicate that although only the accelerations of the key point in the centrifugal environment are the same with that in the flight environment, the dynamic flight simulation in the three-axis centrifuge can be used to predicate the flight responses effectively.
2. Kinematic analysis of a beam in the three-axis centrifuge
The schematic diagram of the three-axis centrifuge used in this research is shown in Fig. 1 [16]. The No. 1 axis is parallel to the No. 2 axis, and the axis of No. 2 and No. 3 are vertical. The angular velocity of the three axis are represented by ω1, ω2 and ω3, respectively.
The experiment module is fixed with the third axis. The beam is mounted in the experimental module along the No. 3 axis, and its geometry is shown in Fig. 2. Considering the flexibility of the beam, the rigid-flexible coupling kinematics model of the beam in the three-axis centrifugal environment is established. The coordinate O3xyz is consolidated on the third axis, and the corresponding base vectors are e1, e2 and e3, respectively. The motion of the point P' in the reference frame O3xyz is analyzed. After deformation, P' arrives at the position of P. u1, u2 and u3 respectively represent the deformation of P' in the direction of x, y, z, and a non-Cartesian variable s is adopted to denote the arc length stretch.
Fig. 1Schematic diagram of the three-axis centrifuge
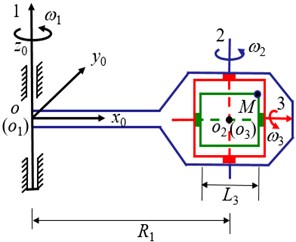
Fig. 2The geometry of a beam mounted in the experimental module
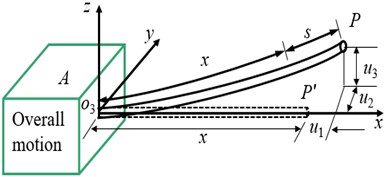
In the reference frame O3xyz, the position of the point P' in the beam without deformation is expressed as r=xe1. u1 denotes the displacement of the point P' in the axial direction of the undeformed configuration while u2 and u3 are used to express the lateral displacements of the point P'. The resultant displacement vector is given as:
The absolute velocity and acceleration of the reference point O3 are respectively expressed as:
The absolute angular velocity of the beam is expressed as:
According to the motion synthesis method, the absolute velocity and acceleration of the point P can be expressed as:
In Eq. (5), ω×(r+u)+ovPis the relative speed,ovP represents the velocity vector described in the reference frame O3xyz and it is caused by the elastic vibration of the beam. In Eq. (6), ˙ω×(r+u) and ω×(ω×(r+u)) are the tangential acceleration and normal acceleration of the point P, respectively. o˙vp is the vibration acceleration of the point P caused by the elastic vibration. 2ω×ovp is the Coriolis acceleration caused by the coupling of the elastic vibration and the rigid body rotation.
3. Dynamic model of the beam
For the beam shown in Fig. 2, the geometry relationship of the deformation is approximated as:
The deformation energy of the beam is:
According to the Kane’s method, for the beam in the centrifuge, the generalized active forces and generalized inertia forces form an equilibrium force system and thus:
where Fq expresses the generalized active force and F*q is the generalized inertia force. The subscripts q=1, 2 and 3 correspond to the direction of x, y and z, respectively:
In Eq. (10), the generalized coordinate Qq (q=1, 2, 3) is the modal coordinate of the beam, and ˙Qq is the generalized velocity. Substituting Eqs. (5-8) into Eqs. (10-11), we can obtain the expressions of Fq and F*q. Using the Rayleigh-Ritz method to describe the displacement caused by elastic deformation, we can then express s, u2, u3 as:
where Φ1i, Φ2i and Φ3i are the basis functions that can be determined according to the modes of the beam in the inertial system. Q1i, Q2i and Q3i are the modal coordinates. Subscripts 1, 2 and 3 correspond to the three directions of the beam respectively. Subscript i is the order of modal. And n1, n2 and n3 represent the truncation numbers of the three directions respectively.
For the cantilever beam in Fig. 2, the expressions of Φ1i, Φ2i and Φ3i are presented as:
where C2i and C3i are normalization coefficients which can be determined by the boundary conditions of the beam.
The modal orders selected in the subsequent calculation are n1=1, n2=3, n3=3. This means that three modes bending vibrations both in y and z directions are considered, and one mode vibration in the axial direction is considered.
Substituting the displacement functions expressed in Eqs. (12a-12c) into Eqs. (10-11), the generalized active forces corresponding to Q1i, Q2i and Q3i are derived as:
The generalized inertial forces of the three directions are given as:
˙Qqi (q= 1, 2, 3) represents the generalized velocity corresponding to the ith modal coordinate (generalized coordinate) in the q direction. The detailed expressions for F*q are given in Appendix A.
Substituting Eqs. (14-15) into Eq. (9), the dynamic equation of the system is obtained as:
In Eq. (16), M, G, K are n×n matrix, and F is a n×1 column, where n=n1+n2+n3. The detailed expressions of M, G and K in Eq. (16) are shown in Appendix B. The matrix G is the damping matrix caused by the gyroscopic action, which represents the mutual coupling of the rigid motion and the flexible vibration.
4. Dynamic simulations
In this part, the responses of the cantilever beam as shown in Fig. 2 are calculated. The geometric parameters and material parameters of the beam are listed in Table 1. According to the equivalence relationship of the accelerations between the centrifugal environment and the flight environment [17], the midpoint of the beam is selected as the control point, and the control point coincides with the intersection of the No. 1 and No. 2 axis. In the reference frame O3xyz, the coordinate of the control point is (0.5L, 0, 0). In the simulation, the accelerations of the control point are always consistent with the flight accelerations. Based on the dynamic model in Section 3, the Newmark method is employed to calculate the responses of the system when different accelerations are considered.
Table 1Material parameters of the cantilever beam
Density of the material ρ | 2700 kg/m³ | Length of the beam L | 0.3 m |
Young’s modulus E | 70×109 N/m2 | Width of the beam b | 0.02 m |
Poisson’s ratio υ | 0.3 | Thickness of the beam h | 0.004 m |
4.1. Example 1: under constant accelerations
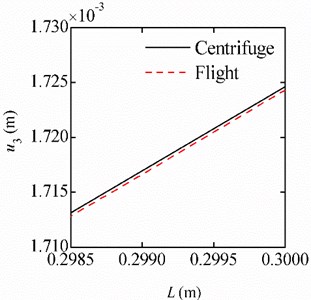
In this case, the flight accelerations are constant and the accelerations in the three directions are: az= 6 g, ax=ay= 0. The response of each point on the beam in the three-axis centrifugal environment is calculated and compared with the response in the flight environment. Due to the constant acceleration, the beam deforms statically. The deformation along the length of the beam is shown in Fig. 3(a), and the zoom in view for the range from 0.2985 m to 0.3 m is shown in Fig. 3(b).
Fig. 3Deformation of the beam in the different environments under the constant accelerations
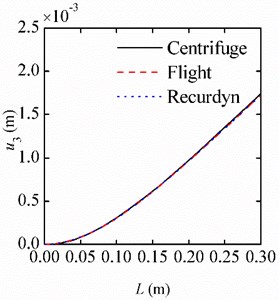
a)L=[0, 0.3]
b)L= [0.2985, 0.3]
The results show that the deformations in the two different environments agree well with each other. In the range near the free end of the beam, the deformation in the centrifugal environment is slightly larger than that in the flight environment. The reason is that although the acceleration of control point is consistent with the flight acceleration, the centrifugal environment cannot guarantee that the acceleration of every point exactly matches the acceleration in the flight environment. Fortunately, the error between the results is only 0.02 %. This indicates that for the beam under a constant acceleration load, the centrifuge test results can reflect the deformation of the beam in the flight environment precisely.
4.2. Example 2: under unidirectional variable accelerations
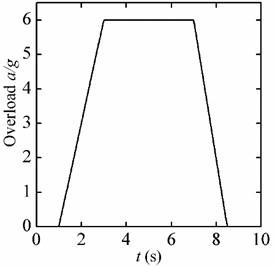
In this case the accelerations in z-direction of the beam change are shown in Fig. 4. The accelerations are unidirectional and the amplitudes change in trapezoid. The overload expressed in the vertical ordinate in Fig. 4 is the ratio of the acceleration to gravity acceleration g. This means that in the flight environment, the acceleration of each point on the beam is shown in Fig. 4, while in the centrifugal environment, only the acceleration of the control point is the same with the flight acceleration.
Fig. 4The unidirectional variable accelerations
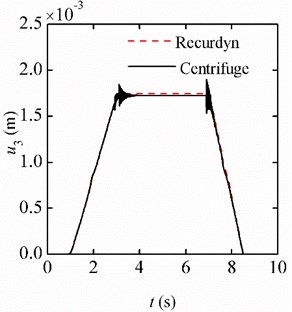
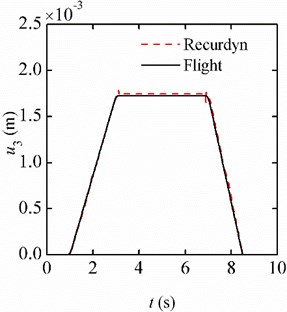
The displacement responses of the beam in the centrifugal and flight environments are simulated. Fig. 5(a) shows the displacement responses of the free end in the centrifugal environment. The responses in the flight environment are shown in Fig. 5(b). To verify the mechanical model and the calculation results, the commercial software Recurdyn is also employed to calculate the responses of the system.
Fig. 5Displacement responses of the free end under the unidirectional variable accelerations
a) Centrifugal environment
b) Flight environment
It can be seen that the simulation results based on the analytical model agree well with the results obtained by the software Recurdyn. The displacement responses consist of two parts: one part is the static deformation which has the same trend with the change of the acceleration (overload); the other part is caused by the jerk, which corresponds to the elastic vibration, and its amplitude is much smaller than the static deformation. During the stage of az=6 g, the amplitude of the deformation is approximately equal to the static deformation when the beam is under the acceleration of 6 g.
Comparing the results in Fig. 5(a) and Fig. 5(b), the trends of deformation under the two different environments are consistent and the deformations agree well with each other. But at the inflection point of the acceleration curve, the vibration amplitude of the beam in the centrifugal environment is larger than that in the flight environment. This phenomenon is caused by the difference between the accelerations along the beam in the two environments.
4.3. Example 3: under three-direction variable accelerations
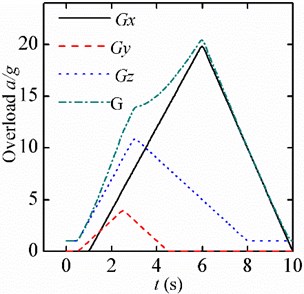
In this case, variable accelerations as shown in Fig. 6 are considered, where the overload Gx=ax/g,Gy=ay/g,Gz=az/g,G=√a2x+a2y+a2z/g. This means in the flight environment, the accelerations of every point on the beam varies with time as shown in Fig. 6, but in the centrifugal environment, only the control point has the accelerations as shown in Fig. 6.
Fig. 6Three-direction variable accelerations
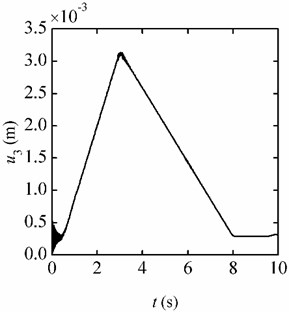
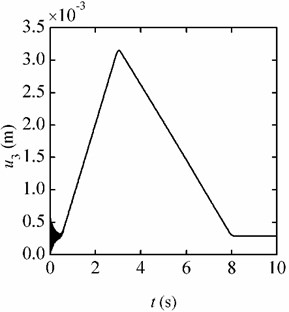
Because the beam is under accelerations in three directions, it deforms in three directions consequently. Due to the physical dimension of the beam, the deformations of the beam in length and width directions are small and negligible, only the responses in thickness direction (z-direction) of the beam are given. Fig. 7(a) shows the responses of the free end in the centrifugal environment and Fig. 7(b) gives the responses in the flight environment. The simulation results show that the maximum response in the centrifugal environment is 3.136 mm, and that in the flight environment is 3.148 mm. The response curves are almost the same under the two different environments.
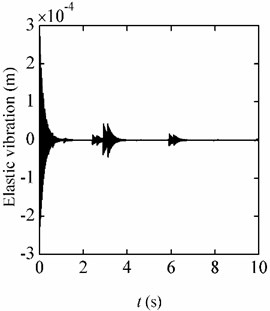
From Fig. 7(a) and 7(b), it can be seen that the response curves are not smooth. To eliminate the trend terms, the responses of the elastic vibrations caused by the jerks are shown in Fig. 8(a) and Fig. 8(b), respectively. It can be seen that in the centrifugal environment, the amplitude of the elastic vibration is larger than that in the flight environment. The reason for the differences lies in the fact that only the accelerations of the control point are consistent with the flight environment. The results in this example indicate that although there are differences between responses in the two environments, the simulation results of the centrifugal test can effectively reflect the responses in the flight environment.
4.4. Example 4: the influence of the jerk
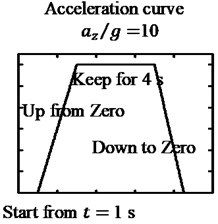
According to the results above, it can be seen that the jerk would result in elastic vibration of the beam. In this example, the influence of the jerk on the response is discussed. The unidirectional accelerations changed in the shape of trapezoid are considered. The acceleration curve is shown in Table 2, and three different jerks are considered: (1) The jerks for the up and down stages are 4 g/s and –4 g/s, respectively; (2) The jerks for the up and down stages are 8 g/s and –8 g/s, respectively; (3) The jerks for the up and down stages are 10 g/s and –10 g/s, respectively. For these three cases, the accelerations in the horizontal section on the trapezoid curves are 10 g.
Fig. 7Displacement responses of the free end under the three-direction variable accelerations
a) Centrifugal environment
b) Flight environment
Fig. 8Displacement responses caused by the jerks
a) Centrifugal environment
b) Flight environment
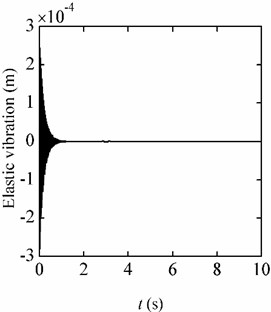
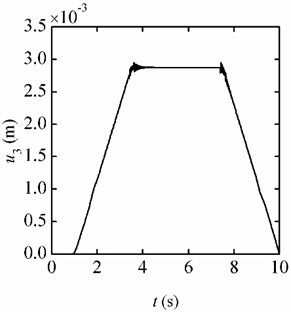
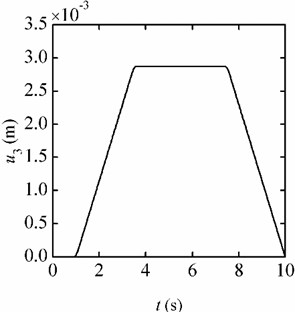
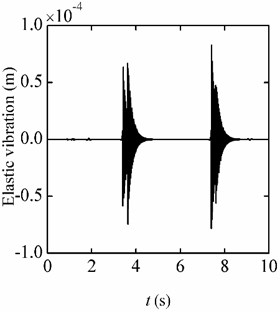
In Fig. 9(a) and Fig. 9(b), the responses of the beam are given out when the jerk in the up stage is 4 g/s and –4 g/s in the down stage. Separating the elastic vibration from the total responses, the results are given in Fig. 10(a) and Fig. 10(b), respectively. When the jerk is 8 g/s and 10 g/s, the responses are also calculated. And the responses trends are the same with that in Fig. 9 and Fig. 10. The amplitudes of the responses increase with the jerk increasing. The amplitudes of the static deformation and the elastic vibration are listed in Table 2. It can be seen that: (1) The trend items in the two environments are approximately equal. (2) When the accelerations keep 10 g, the static deformations of the beam are the same although the jerks are different. (3) At the inflection points on the acceleration curve, the elastic vibration would be induced, and the greater the jerk is, the greater amplitude of the elastic vibration is motivated. (4) Under the same jerk, the amplitude of the elastic vibration induced in the centrifugal environment is greater than that in the flight environment. The amplitude of the elastic vibration in the flight environment is much smaller than that in the centrifugal environment, which is thus not included in Table 2.
Fig. 9Displacement responses (jerk = 4 g/s)
a) Centrifugal environment
b) Flight environment
Fig. 10Elastic vibration responses (jerk = 4 g/s)
a) Centrifugal environment
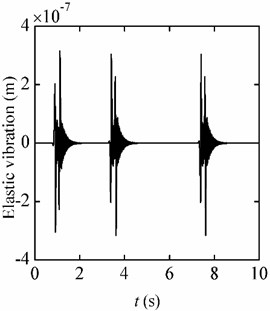
b) Flight environment
Table 2Displacement responses for different jerks
 | Jerk | Centrifuge (m) | Flight (m) | |
Static information | Elastic vibration | Static information | ||
4 g/s | 2.876×10⁻³ | 0.083×10⁻³ | 2.875×10⁻³ | |
8 g/s | 2.876×10⁻³ | 0.170×10⁻³ | 2.875×10⁻³ | |
10 g/s | 2.876×10⁻³ | 0.215×10⁻³ | 2.875×10⁻³ | |
5. Conclusions
In this paper, a three-axis centrifuge is used to simulate the flight environment. The kinematics model of the centrifuge is established firstly, and the velocity and acceleration of the beam installed in the centrifuge are achieved. The dynamic equations of the beam are then established with which the dynamic flight simulation is performed. For different accelerations, the displacement responses of the beam in the centrifugal environment and the flight environment are obtained, respectively. The influence of jerks on dynamic responses of the beam are discussed. The results indicate that when the intersection of No. 2 axis and No. 3 axis is set as the control point and its acceleration is equal to the flight acceleration, the response of the beam in the centrifugal environment is consistent with that in the flight environment. In addition, it is observed that the vibration amplitude of the beam in the centrifugal environment is larger than that in the flight environment. Moreover, the acceleration change rate, i.e. the jerks could influence the dynamic response of the beam and a larger jerk would lead to a larger vibration amplitude.
Overall, although there are differences between the flight environment and the centrifugal environment, the responses obtained using the dynamic model in these environments agree well with each other. The present model is appropriate for accurate simulation and it could be used conveniently to predict the responses of the flight and centrifugal environments conveniently.
References
-
Song Q., Hu R. H. Summarization of dynamic flight simulator and its development. Equipment Environ-mental Engineering, Vol. 12, Issue 5, 2015, p. 11-18.
-
Sinapius J. M. Experimental dynamic load simulation by means of modal force combination. Aerospace Science and Technology, Vol. 1, Issue 4, 1997, p. 267-275.
-
Chen L., Jin W., Shi S. Technology and application of identifying dynamic loads based on flight test data. Procedia Engineering, Vol. 99, 2015, p. 1339-1344.
-
Han L., Qin C. H., Zhang Z. Validation analysis of complex structure vibration experiments. Structure and Environment Engineering, Vol. 40, Issue 4, 2013, p. 1-6.
-
Qiu J. B., Zhang Z. P., Li H. B. The consistency of dynamic responses of a full scale spacecraft between ground tests and its space missions (Part I). Structure and Environment Engineering, Vol. 42, Issue 1, 2015, p. 1-11.
-
Qiu J. B., Zhang Z. P., Li H. B. The consistency of dynamic responses of a full scale spacecraft between ground tests and its space missions (Part Ⅱ). Structure and Environment Engineering, Vol. 42, Issue 2, 2015, p. 1-12.
-
Guan L. W., Liu H., Fu M. Real-time motion planning algorithm for dynamic flight simulators. Journal Tsinghua University, Vol. 55, Issue 7, 2015, p. 709-715.
-
Chang L., Liu Z. H., Wen N. Configuration and mathematical modeling for advanced three-axis centrifuge system. Journal of Beijing University of Aeronautics and Astronautics, Vol. 41, Issue 2, 2015, p. 283-288.
-
Spenny C. H., Liebst B. S., Chelette T. L., et al. Development of a sustainable-g dynamic flight simulator. AIAA Modelling and Simulation Technologies Conference and Exhibit, Dever, 2000.
-
Kiefer D. A., Calvert J. F. Development evaluation of a centrifuge flight simulator as an enhanced maneuverability flying qualities tool. Flight Simulation Technologies Conference, 1992.
-
Jr J. E., Heffer P. L. Design and performance of the centrifuge-based dynamic flight simulator. Flight Simulation Technologies Conference, 1992.
-
Glaser S. T., Newman Michael G-pointing: Articulated centrifuge for real-time G flight simulation. AIAA Modelling and Simulation Technologies Conference, Portland, Oregon, 2011.
-
Dourado A. O., Martin C. A. New concept of dynamic flight simulator (Part I). Aerospace Science and Technology, Vol. 30, 2013, p. 79-89.
-
Yoo H. H., Ryan R. R., Scott R. A. Dynamics of flexible beams undergoing overall motions. Journal of Sound and Vibration, Vol. 181, Issue 2, 1995, p. 261-278.
-
Zhang X., Huang Y. Y., Chen X. Q. Modeling of a space flexible probe–cone docking system based on the Kane method. Chinese Journal of Aeronautics, Vol. 27, Issue 2, 2014, p. 248-258.
-
Zhang Y. H., Zhang S., Chen S. L. General kinematic model and coupling movement analysis for a three-axis centrifuge motion simulator. Journal of Mechanical Engineering, Vol. 52, Issue 23, 2016, p. 135-140.
-
Liu G. G., Zhang Y. H., Zhang X. N. Equivalence relationship between a three - axis centrifugal test load and flight load. International Journal of Computational Materials Science and Engineering, Vol. 7, Issue 1, 2018, p. 1850011.
About this article
The financial support from the Joint Fund of the National Natural Science Foundation of China and the China Academy of Engineering Physics, NSAF (Grant No. U1630120) is gratefully acknowledged.

