Abstract
In order to meet the needs for aircraft vibration transducer and measurement equipment to be calibrated at the job site, it is necessary to design a compact, dynamic and functional vibration standard device. This paper introduces a vibration standard device based on random comparison method. The structure and working principle of software and hardware are described in detail. Unlike the calibration requirements under laboratory conditions, on-site calibration requires that the calibration process be more consistent with the actual operating conditions. A random vibration comparison calibration method using random signals as excitation sources is designed. The vibration standard device can be maneuvered from the laboratory environment to the aircraft maintenance site. It has been proved measurement uncertainty of the system is 1.0 % (k=2) by the method of control accuracy.
1. Introduction
In recent years, the research on vibration calibration in various countries mainly focuses on how to realize ISO16063-11 “one-time calibration of laser interference method” and ISO16063-13 “one-shot calibration of laser interference method”.
The lower limit of the frequency of the low frequency acceleration standard of Physikalisch-Technische Bundesanstalt (PTB) is 0.1 Hz (shake table 0.01 Hz), the maximum acceleration is 2 m/s2, and the maximum amplitude is 1 m [1].The high-frequency vibration standard established by the National Institute of Standards and Technology (NIST) in 1969 has reached an accuracy of 1 % in the frequency range of (10-500) Hz [2].The accelerometer calibration system frequency of the National Metrology Institute of Japan (NMIJ) was extended to 0.1 Hz [3]. This standard equipment is based on absolute methods and can only be used in the laboratory.
In order to ensure the performance of the vibration transducer, it is necessary to periodically calibrate the sensitivity of the transducer and other parameters. Many scholars in the world have studied the calibration method of vibration transducers and designed some calibration system [4-6]. Some vibration equipment in engineering, especially in the aerospace sector, needs to be calibrated in the field, in which case standard equipment based on absolute methods cannot be used. In order to meet the needs of on-site calibration of vibration transducer and measuring equipment, the DH11 vibration standard device was designed and developed based on random comparison method.
2. Systems design
2.1. Hardware architecture
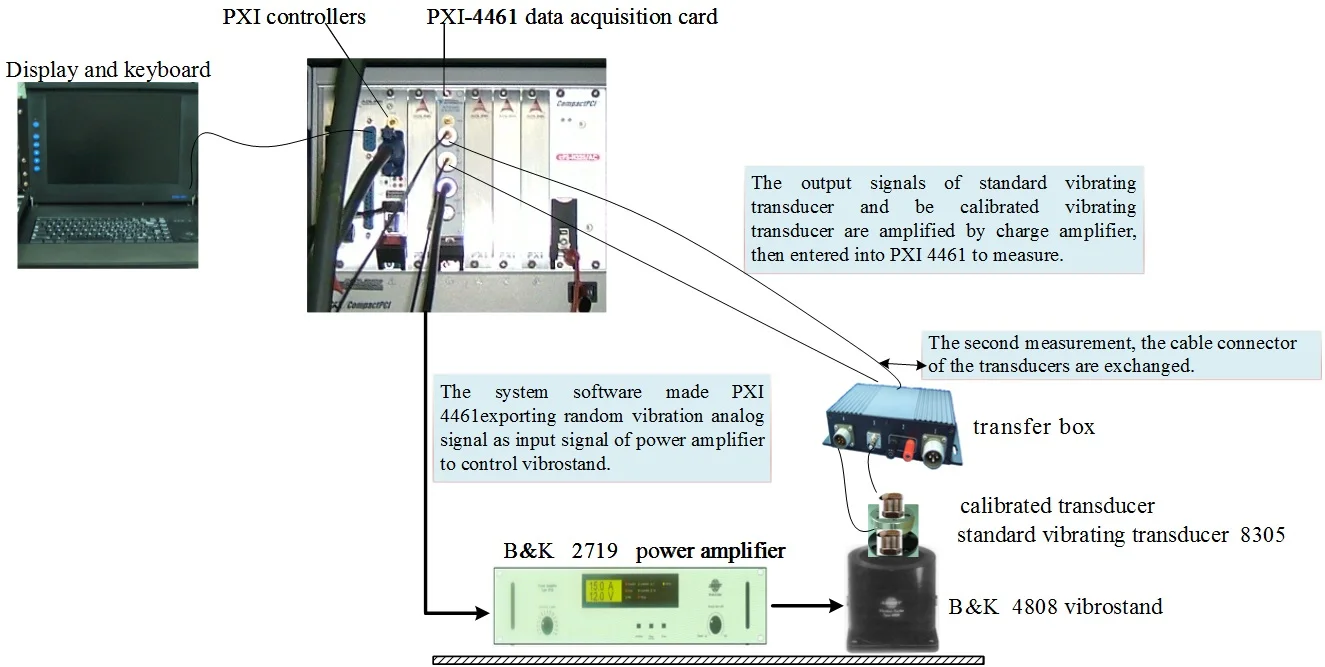
DH-11 vibration standard device was composed of PXI cage, PXI controllers, PXI-4461 data acquisition card, standard vibrating transducer, vibrostand, power amplifier, charge amplifier and measuring instruments, which is shown in Fig. 1.
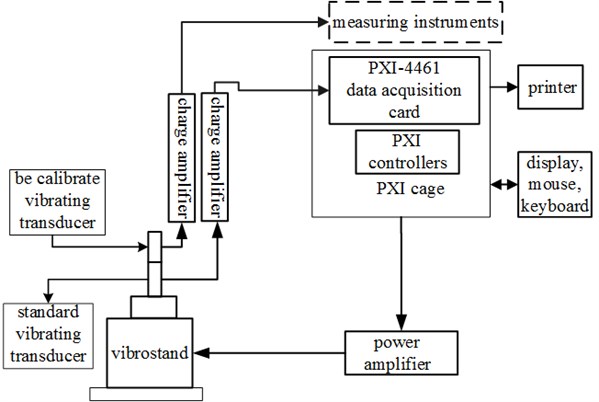
Fig. 1. Hardware architecture of vibration standard device
The dynamic data acquisition card PXI-4461 is a dedicated module for sound and vibration analysis. Its main functions are: 2 synchronous analog inputs, measuring range ±316 mV-42.4 V; 2 synchronous analog outputs; 24-bit resolution; 204.8 kS/s maximum sampling rate. The two synchronous analog inputs are used for the acquisition of the vibration signals of the standard vibration transducer and the calibrated transducer respectively; one synchronous analog output is used as the signal output of the power amplifier to control the vibration of the vibration table. Standard shakers (including signal generators and power amplifiers) produces motion with adjustable frequency and amplitude as the mechanical input to the transducer being calibrated. The vibration parameter measurement section and other supporting instrument combinations (including standard transducers, charge voltage converters, data acquisition units, and computers) are used to accurately measure vibration parameters such as amplitude peak, frequency, and period. The system software made PXI 4461exporting vibration analog signal as input signal of power amplifier to control vibrostand. The output signals of standard vibrating transducer and be calibrated vibrating transducer are amplified by charge amplifier, then entered into PXI 4461 and measuring instruments.
The standard transducer uses the 8305 vibration transducer of Danish B&K company. The standard vibrating transducer 8305 was made from ceramic material with high stability. Design with innovation can reduce environmental impact and have long-term stability. The calibrated transducer and the standard transducer “back to back” are mounted in the center of the vibrating table. The controller and the data acquisition card are integrated through the PXI chassis. The function is to acquire the signals of the standard transducer and the calibrated transducer. According to the input command, the control module outputs various signals required for transmission to the power amplifier. The power amplifier is used to amplify the signal generated by the controller to drive the shaker.
2.2. Software architecture
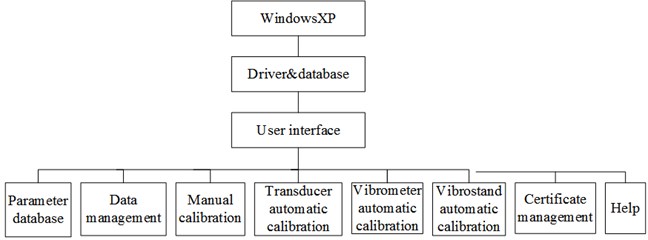
The system software includes OS and an application. OS adopts WindowsXP. The application was designed using LabVIEW 2013. The application includes self-checking module, management module and calibration module, which is shown in Fig. 2.
The calibration of the vibration transducer is mainly to calibrate the transducer's normalized sensitivity value, frequency response and nonlinearity.
The automatic measuring module of the vibrometer and vibrostand mainly includes the selection of the verification procedure, the parameter configuration of the working vibration meter, the test procedure, the configuration of the test process parameters, and the automatic verification of the working vibration meter.
In the software menu, select the “Data Management” menu to query the previous verification results of the transducer and the working vibration meter.
Fig. 2Software architecture of vibration standard device
3. Vibration transducer calibration
3.1. Work process
Comparative method calibration as shown in Fig. 1. This method is also suitable for calibrating speedometers or displacement meters.
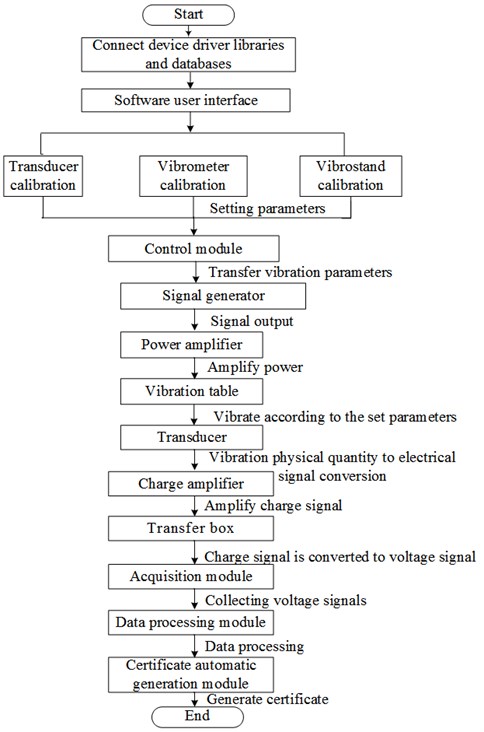
The workflow is shown in Fig. 3. First, select the verification mode (manual calibration, automatic transducer calibration, automatic vibration meter calibration and vibration table automatic calibration) through the software user interface. The system sets different vibration parameters according to different verification methods. The software system reads the amplitude and frequency of the vibration generated by the standard vibration table, sends it to the data control module to generate an exciting signal, and then sends the exciting signal to the power amplifier. After the signal is amplified, the standard vibration table vibration is driven. At the same time, the standard transducer and the calibrated transducer mounted on the standard vibration table transmit the signal of the test to the data acquisition module, and compare the signal collected by the standard transducer with the expected ideal signal. If the error requirement cannot be met, the signal output should be readjusted within the allowable range of the system according to the error level until the error requirement is met. If the error requirements are met, the "comparative method" calibration process can be entered. The standard transducer and the calibrated transducer transfer the test data to the data acquisition module. The software system reads the test data of the standard transducer and the calibrated transducer, and displays the calibration result in the form of curve and tabular data respectively. The curve includes the time domain curve, the amplitude frequency characteristic curve, the phase frequency characteristic curve and the amplitude nonlinear curve of the actual acquisition of the transducer. After the calibration is completed, the system prompts whether to save the result to the database. After the save operation is completed, the system continues to prompt whether to generate the calibration certificate. The system can automatically generate the calibration certificate according to the set parameters and test data. The calibration certificate format is the standard Microsoft Word format.
3.2. Random comparison calibration
In the actual engineering, the pure sinusoidal vibration is almost non-existent, and often it is the shock transient and random vibration which are large and small, fast and slow, and the vibration changes frequently. When these vibrations are measured with absolute vibration transducers, their response does not follow the amplitude-frequency characteristic law derived from steady-state sinusoidal vibration. That is to say, the transient response of the transducer is different from the steady state response. If a transducer calibrated in a sinusoidal steady state is used to measure transient and random vibrations, and the steady state calibration data is used to calculate transient values and random vibration values, a certain amount of error is inevitable.
Fig. 3Flow chart of the calibration
Because the transducer is used in a random vibration environment, it is more practical to use a random vibration method to calibrate the vibration transducer.
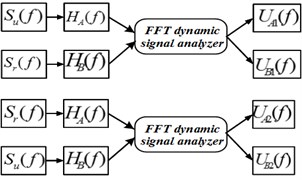
When the accelerometer is calibrated using the FFT random calibration method, both charge amplifiers have errors due to the dual-channel FFT dynamic signal analyzer. Therefore, using only one comparison method will result in a large calibration error. To reduce the effects of these systematic errors, a switching comparison method is used to eliminate these errors. The method is shown in Fig. 4. Where a is vibration acceleration, Su(f) is charge sensitivity of the calibrated transducer, Sr(f) is charge sensitivity of standard transducer, HA(f) is frequency response function of charge amplifier A, HB(f) is frequency response function of charge amplifier B, UA1(f) is the output voltage of charge amplifier A at the time of the first measurement, UB1(f) is the output voltage of charge amplifier B at the time of the first measurement, UA2(f) is the output voltage of charge amplifier A at the time of the first measurement, UB2(f) is the output voltage of charge amplifier B at the time of the first measurement.
At the first measurement, the calibrated transducer is mounted on the upper end of the bracket, the standard transducer is installed at the lower end, and the frequency response function between the two transducers is measured; after the first measurement, the cable connector of the transducer is exchanged, and then the second measurement is performed again as the first method.
Fig. 4Schematic diagram of FFT random switching method
It can be known from the principle of FFT random switching method:
From Eqs. (1) and (2), the following equation can be obtained:
After the second measurement, the following equation can be obtained:
From Eqs. (4) and (5), the following equation can be obtained:
By dividing the Eq. (3) by Eq. (6), the sensitivity of the calibrated transducer can be obtained:
The sensitivity of standard transducer Sr(f) can be obtained by point-by-point calibration on low frequency, intermediate frequency and high frequency vibration standards. The sensitivity of the calibrated transducer Su(f) can be obtained by Eq. (7).
4. Conclusions
The vibration standard device has reached the technical ability of the same type of measurement standards abroad, and the comparison results with the same type of measurement standards abroad are shown in the following Table 1.
Table 1Comparison results
Item | Type 3629 with type 5308 secondary calibration system of Bruel&Kjær | DH-11 vibration standard device |
Bus architecture | LAN-XI | PXI |
Frequency range | 0.1 Hz to 50 kHz, depending on shaker and reference transducer | 1 Hz to 50 kHz |
Uncertainty of measurement | Depending on reference transducer | 1.0 % (k=2) |
Calibration reference | ISO 16063–21 | ISO 16063–21, JJG 134, JJG 644, JJG 233 |
Calibration method | Random excitation or user-defined sine excitation | Sine comparison, frequency sweep, random comparison |
Calibration object | Transducer | Transducer, vibrostand, vibration meter |
Using site | Laboratory | Laboratory, field |
The FFT random switching method can eliminate the error very well. The vibration standard device has passed the measurement standard to evaluate the stability and repeatability, and it has proved that the uncertainty of measurement standard has reached 1.0 % in the whole working frequency range of 1 Hz-5×10⁴ Hz. The environmental temperature automatic adjustment technology and reliability design technology are adopted so that the vibration standard device can be moved out of the laboratory environment to the field. The random comparison method can better simulate the working conditions in the field and enable the transducer to obtain more realistic calibration results.
References
-
von Martens Hans Juergen, Link Alfred, JoachimSchlaak Hans Recent advance in vibration and shock measurements and calibrations using laser interferometry. 6th International Conference on Vibration Measurements by Laser Techniques: Advances and Applications, 2004.
-
American National Standard for the selection of Calibration and Tests for Electrical transducers used for Measuring Shock and Vibration. 2nd Edition, American National Standard Institute, 1969.
-
Ueda Kazunaga, Usuda Takashi, Lshigami Tamio, et al. The current status of measurement standards for vibration and shock in NRLM. 4th International Conference on Vibration Measurements by Laser Techniques: Advances and Applications, 2000.
-
Klaus Leonard, Hannig Stephan, Bothe Harald Vibration testing to assess the transport behaviour of reference standards and mobile scientific devices. Journal of Physics: Conference Series, Vol. 1065, 2018, p. 222015.
-
Ferreira C. D., Ripper G. P., Dias R. S., Teixeira D. B. Primary calibration system for vibration transducers from 0.4 Hz to 160 Hz. Journal of Physics: Conference Series, Vol. 575, 2015, p. 012003.
-
Usuda T., Kurosawa T. Calibration methods for vibration transducers and their uncertainties. Metrologia, Vol. 36, Issue 4, 1999, p. 375-383.

