Abstract
Following a patented solution, a seat which is possible to change its stiffness was created. The seat contains an actively controlled pneumatic spring element (the PSE). For the requirement of working faster and more precisely, an improvement was applied. This article focuses on a comparison of the effect of the improved system and the original system on regulation of pressure inside a PSE. For comparison, two system characteristics were used, the response time and the transmission of acceleration. The original and improved system were thoroughly studied and compared experimentally. The behavior of both systems is analyzed and evaluated. The function of pressure regulation is investigated under static conditions (without excitation) and the transmission of acceleration is performed under dynamic conditions (with excitation). The results describe the behavior of the system in two modes of controller setup: constant pressure and constant stiffness both under static and dynamic conditions.
1. Introduction
The seat with adjustable pressure profile is shown in Fig. 1(a). A PSE inserted inside the cushion allows changing the stiffness of cushion by a system of pneumatic actuator and a controller [1].
Fig. 1The seat with a PSE inserted inside

a) The seat in reality
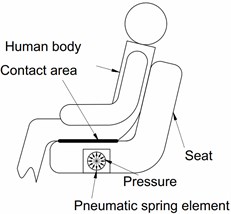
b) A simplified scheme
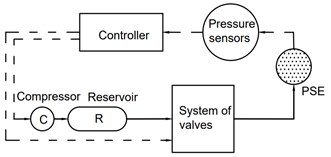
In the original system, the PSE is inserted inside the car seat cushion (as shown in Fig. 1(b)). The PSE (as shown in Fig. 2) is made of materials: foam, latex, and tape. When the PSE is supplied with compressed air the latex tube stretches and bulge at both ends while a cover tape layer keeps the tube’s shape and limits the deformation. From the point of view that the PSE affects the human body locally (in contact with buttock), the investigation focuses on analysis of the corresponding part of the system comprising a brick of foam (100×100×50 mm3) and the PSE inserted inside. The pressure inside the PSE is controlled by an electro-pnuematic system. A simplified scheme of the control system is in Fig. 3. The pressure inside the PSE can be changed in the range [0, 25] kPa. The original system can work with inlet air pressure up to 110 kPa and outlet pressure equal to atmospheric pressure [2].
Fig. 2The brick of foam with a PSE inserted inside
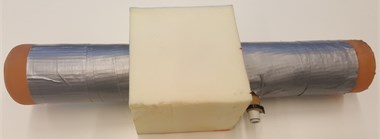
Fig. 3A simplified scheme of original system
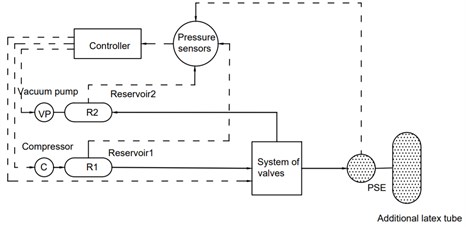
In case of the improved system, an additional latex tube is connected to the PSE (Fig. 4). Thus, it can be considered that the PSE does not cause volume change when supplied by compressed air and this function is implemented with the additional latex tube. A vacuum pump is connected to the outlet valves (Fig. 5). It has the function of generating the output pressure less than 0 kPa, thereby increasing the flow rate through the outlet valves. The improved system can work with inlet air pressure up to 250 kPa and vacuum pressure at the output up to –60 kPa.
Fig. 4The PSE connected to an additional latex tube
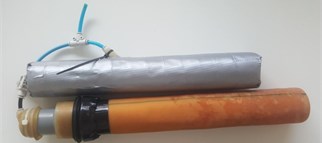
Fig. 5A simplified scheme of the improved system
2. The effect of original and improved system on pressure regulation
2.1. Experimental setup
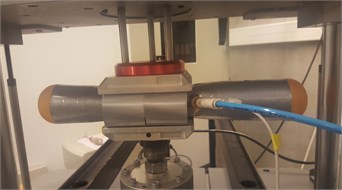
In practice, a PSE is connected to the electro-pneumatic system by hoses for air filling. This system is connected to a controller, interface, and control software made in Labview. Labview controller with programmed user interface is connected to the circuit system for setting control parameters and control pressure inside the PSE to meet the desired pressure. There are two types of experiment, the first one for measurement of pressure feedback in the PSE without external load (Fig. 6) and the second one for measurement of pressure feedback in the PSE with dynamic external load (shown in Fig. 7). The experiments are carried out by the Instron E3000 machine. The brick of foam with a PSE inserted at the middle is placed on a platform square base.
The brick of foam is compressed by a top square platform. Its motion is given by a sine function:
Exciting frequency f is designed in range [0, 3] Hz with values of 0.1, 0.3, 0.5, 0.7, 1, 1.5, 2, 2.5, 3 Hz (Fig. 8). In case of the original system, the supply pressure is set in the range [90, 110] kPa. In case of the improved system, supply pressure is set in the range of [190, 210] kPa, a vacuum pump is used to create PSE output environment with pressure set in the range of [–60, –40] kPa.
Fig. 6Experimental setup of measurement of pressure feedback without load
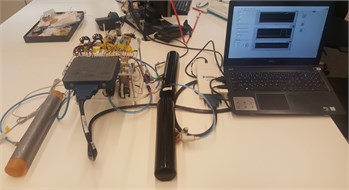
Fig. 7Experimental setup under static condition
2.2. Results
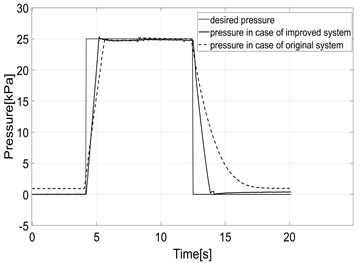
In case of measurement of pressure feedback without external load, the result of the pressure meeting a desired pressure is shown in Fig. 9.
Fig. 8Motion of the top square platform
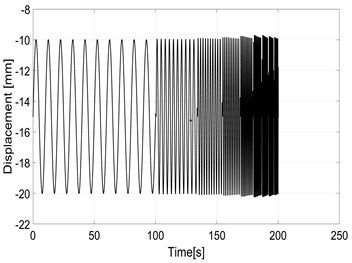
Fig. 9Experimental pressure response under static condition
In case of measurement of pressure feedback with dynamic external load, data is collected and calculated by Matlab software and the pressure error is evaluated (e=ps-pd where pd is desired pressure and ps is measured pressure inside the PSE), Finally we get the result in form of pressure error depending on the exciting frequency, as shown in Fig. 10.
3. Effect of original and improved system on the transmission of acceleration
3.1. Experimental setup
Under consideration of dynamic conditions, the experiments for determination of acceleration transfer functions were performed. The mass (10 kg) is placed at the top of the foam brick. The brick of foam is located in a cage attached to the upper movable platform of the Instron E3000 (Fig. 11). The motion of this cage determines the excitation of the system. Two accelerometers (acc1 and acc2) are attached to the cage and to the mass.
Numerous human vibration studies conducted over the past several decades have shown that the human body is sensitive to low-frequency vibration occurring below 10 Hz [3]. The excitation function [4] used for dynamic experiments is in the form:
with desired frequency changing in the range [1, 11] Hz and a constant acceleration amplitude of 0.1 g. With this function, the frequency variation is slow enough to sufficiently excite response of the system close to the resonance frequency. The advantage of this function is the quick calculation of the transmission of acceleration in the frequency range.
Fig. 10Dependence of pressure error on frequency
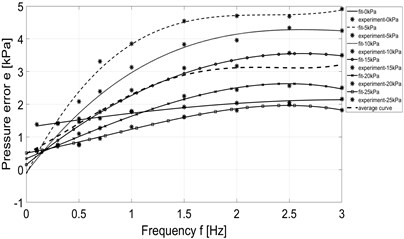
a) Original system - constant pressure mode
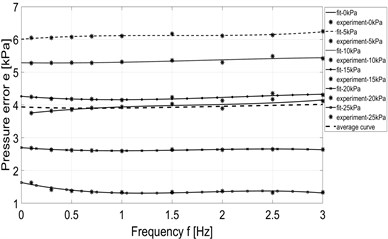
b) Original system - constant stiffness mode
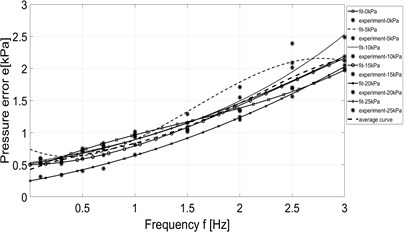
c) Improved system-constant pressure mode
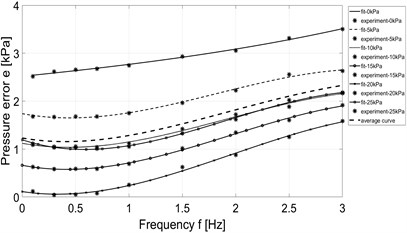
d) Improved system-constant stiffness mode
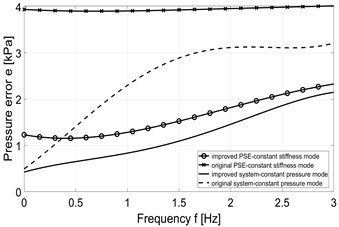
e) Average pressure error
Fig. 11Setup of the experiment performed under dynamic conditions
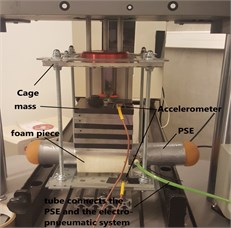
a) The setup in reality
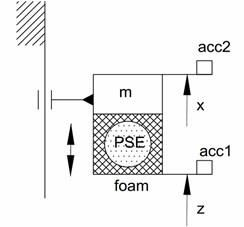
b) Scheme of experimental setup
3.2. Results
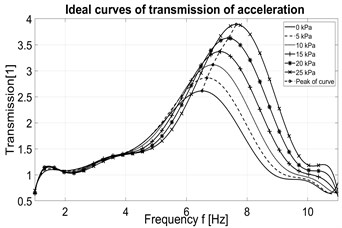
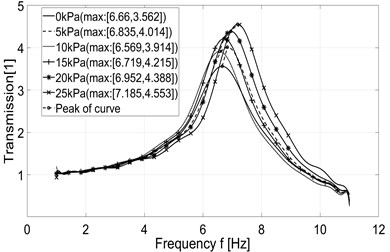
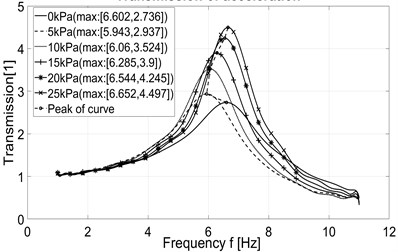
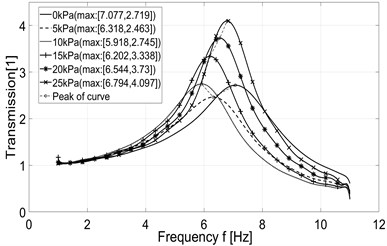
The transmission of acceleration is calculated as a ratio of output and input acceleration (acc2, acc1). According to [5], the ideal curves of transmission of acceleration obtained from a numerical simulations are shown in Fig. 12. The experimental results are shown in Fig. 13.
Fig. 12Ideal transmission of acceleration
In case of using the original system in constant pressure mode, the transmission curve corresponding to the desired pressure 5 kPa has a peak higher than the transmission curve corresponding to the desired pressure 10 kPa (Fig. 13(a)). In case the system works in constant stiffness mode, the transmission curve corresponding to the desired pressure 0 kPa has a peak at a slightly farther frequency than the transmission curve corresponding to the desired pressure 5 kPa (Fig. 13(b)). For the improved system, a deviation also occurs in transmission lines of two cases where the desired pressure is 0 and 5 kPa respectively (Fig. 13(c) and Fig. 13(d)). However, despite these irregularities the general trend can be observed. We can see that the behavior of transmission curves shows the shift of the peak position toward the higher frequency when the desired pressure increases while the peak value increases as well. With a load of 10 kg, these peaks are positioned in the range of [6, 8] Hz. Peak values are in range [3.6, 4.6] for original system in constant pressure mode and in range [2.4, 4.1] for improved system in the same mode. Peak values are in range [2.7, 4.5] for original system in constant stiffness mode and in range [2.5, 4.1] for improved system in the same mode (see Fig. 13). So, the results show that the peak values of the transmission curves are smaller when the improved system is used.
Fig. 13Measured transmission of acceleration
a) Original system – constant pressure mode
b) Original system – constant stiffness mode
c) Improved system – constant pressure mode
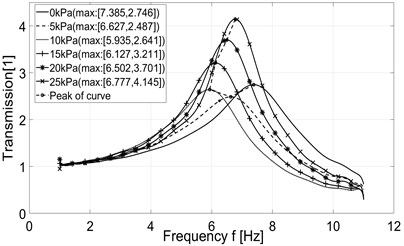
d) Improved system – constant stiffness mode
4. Conclusions
The system improvements presented in the article bring obviously positive effects. Under the static conditions, the regulation quality is assessed by pressure error. the pressure error is considered in the time domain (without external load) and in the frequency domain of the dynamic load (with dynamic external load). Improved system always shows a higher regulation performance than original system in both constant pressure and the constant stiffness mode. Under the dynamic conditions, the regulation performance is assessed by transmission of acceleration. In case of both systems, original and improved one, the transmission of acceleration shows the same tendency to shift the peak position toward the higher frequency when the desired pressure increases. This frequency shift is followed by simultaneous increase of peak value. However, the improved system brings the reduction of the peak values. This is an important implication of improvement considering the comfort of a sitting person.
References
-
David Cirkl, Seat. Patent No. 303163, 2012.
-
David Cirkl,Tien Tran Xuan Simulation model of seat with implemented pneumatic spring. Vibroengineering Procedia, Vol. 7, 2016, p. 154-159.
-
Griffin M. J. Handbook of Human Vibration. Academic Press, London,1990.
-
Sivčák M. Dynamics of the vibration isolation system with more degrees of freedom. Ph.D. Thesis, Technical University of Liberec, Liberec, 2009.
-
David Cirkl, Tien Tran Xuan Modelling of dynamical behavior of pneumatic spring – mass system. 24th International Conference Engineering Mechanics, Vol. 24, 2018, p. 865-868.
About this article
This article was written at the Technical University of Liberec, Faculty of Mechanical Engineering with the support of the Institutional Endowment for the Long Term Conceptual Development of Research Institutes, as provided by the Ministry of Education, Youth and Sports of the Czech Republic in the year 2019.

