Abstract
Although ultrasonic wind meter is widely used in wind speed measurement, the disadvantages of the ultrasonic wind meter structure by its measurement way still exist. The ultrasonic probe will stop on the way of the wind, which in turn produces a shadow area at the back of the probe, probe produce turbulence ahead. Therefore, it will result in error during the process of our normal wind speed measurement. At present, the ultrasonic wind speed Angle compensation formula is deduced by using the wind speed compensation formula on the path. The measurement data and the compensation formula are used for fitting comparison. It is observed that the Angle compensation function of wind and ultrasonic path fits well with the measured data, and the wind speed error after compensation is reduced from 14.65 % to 1.74 %. The modified measurement of accuracy of wind speed and direction can be used in two-dimensional ultrasonic orthogonal wind array model.
1. Introduction
Ultrasonic anemometers have a wide range of applications in wind engineering and industrial aerodynamics. Ultrasonic wind meters often have errors in measurement due to various factors, and the measurement errors caused by the shadow effect especially. Thus, overcoming the effects of shadow effects in the design of ultrasonic anemometers is also a top priority [1].
Transducer of deterministic prediction is still in the shaded area of the existing knowledge gap. According to different equipment of the so-called shadow effect of the specific effect also has many differences. So, discussed in the actual project to reduce the shadow effect of error is more valuable than the shadow effect itself [2].
Coppin and Taylor have concerns about shadow effects, ‘Deficiencies in the horizontal response appear to be a major limiting factor in the field use of ultrasonic wind meters’ [3]. Cuerva A., and Sanz-Andres A., designed a classical ultrasonic wind meter model based on the time of flight of ultrasonic pulses between two ultrasonic transducers. The research in which shadow effect of such ultrasonic wind meter models is the main object. Each transducer operates alternately as a transmitter and receiver, sending ultrasonic pulses between them [4].
In 1973, Kaimal study of such ultrasonic anemometer and wind shadow effects found by the instrument sensor and affect the ratio of the diameter of the receiving distance (/) of the transmitting end [5, 6]. John C. Wyngaard advocated that the wind meter array design prefers to reduce the measurement error. By carefully aerodynamic design, not only the size of the sensor can be reduced but also the influence of the wake on the signal path can be reduced. However, this method cannot eliminate the shadow effect of the transducer completely [7]. John C. Wyngaard and Zhang proposed an empirical model to correct for the transducer shadow effect in which two constants must be determined from the best fit of the model with experimental data [8, 9]. Ghaemi-Nasab M. fits the compensation function for the path wind speed through a large number of tested data [10]. While in the actual ultrasonic wind speed measurement, the wind speed compensation on the path cannot solve the error of the actual wind speed direction [11]. To figure out the errors in the measurement of actual wind speed and direction, the dual paper path model was adopted to deduct the wind direction compensation arithmetic.
2. Shadow effect wind direction compensation algorithm
2.1. Time difference method for measuring wind speed
The ultrasonic wind gauge uses the classic model structure proposed by Cuerva A. and Sanz-Andres A. [4]. Four transducers are used to form two mutually perpendicular path models.
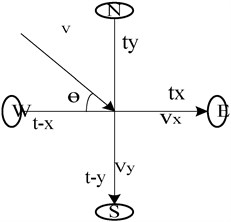
In the actual use of the ultrasonic wind meter, the time difference method is mainly used to detect the wind speed. As shown in Fig. 1, the time of ultrasonic transmission to reception in the four directions of southeast and northwest is , , , . By the time difference method to measure the two east-west and north-south paths wind speed (, ):
Measuring wind speed :
Assuming that the angle between the wind speed and the -axis is , the wind direction is:
The wind speed does not change during normal wind advancement. When the wind passes the sensor, the sensor blocking the shadow behind the sensor, and the other end of the sensor generates turbulence. Therefore, the wind speed and on the path must change accordingly. (The above variables represent the measured values of wind speed and angle).
Fig. 1Schematic diagram of time difference wind speed measurement
2.2. Path wind speed compensation algorithm
Data fitting is the most effective way to reduce the shadow effect by fitting a large amount of measured data to a specific ultrasonic wind meter model and fitting a curve close to the actual value [12].
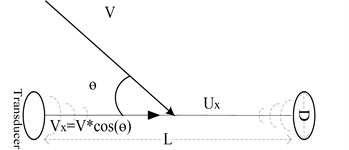
Firstly, some measuring values are defined: is the real wind speed, is the measured wind speed, is the projection of wind speed on the path, is the time difference method to measure the path wind speed, the is the actual Angle between the wind and the path, and the is the measurement Angle between the wind and the path.
Eq. (5) represents the actual wind speed and the projection relationship on the path, and Eq. (6) represents the correspondence between the measured projection and the measured wind speed.
Fig. 3Single-path wind velocity measurement model
The actual wind speed and the measured wind speed and wind direction are fitted to the data. Simply using the data to fit the relationship between and is not accurate enough, and the relationship between the two is more complex according with the variety of angle. The calculation of the wind direction will be more difficult. It will bring errors while using the general fitting function. The linear relationship was observed while and data at the same angle, it is worth to fit the polynomial relationship between and :
Ghaemi-Nasab M. proposed a fitting scheme of and in the /= 20 orthogonal path wind model (Eq. (7)). In which the measurement bias of is derived from the deviation of the projection angle of on the path:
Obtained by Eq. (7) and (5):
Below is Ghaemi-Nasab M. according to the Eq. (7) by using the experimental data fitting the Ф third-order function in the form of expression:
2.3. Angle compensation method of wind and ultrasonic path
In the single-path experiment, as shown in Fig. 3, we cannot derive the values of and from . In an commercial used two-dimensional wind gauge system, data on two paths is required to obtain complete wind speed information.
The experiment used the most common orthogonal dual path model as shown in Fig. 1. The wind speed and direction in the two-dimensional direction are calculated by measuring the data through two paths. Comparing the sizes of , , , can determine which direction (quadrant) the wind is blowing. In the application, you can firstly determine the quadrant where the blow is located, and then calculate the angle between the wind and the -axis. From anticlockwise, the wind direction is when blows from the first quardrant, the second quadrant blows the wind direction to 90° + , the third quadrant blows the wind direction to 180° + , and the fourth quadrant blows the wind direction to 270° + .
is the actual angle between the wind and the path () is the measured angle between the wind and the path (). , and , corresponding to the measured and actual wind speeds on the -axis and -axis paths.
The actual wind speed on the two paths of the -axis and the -axis is derived from Eq. (8). The relationship between the actual wind speed and the measured wind speed is given by Eq. (10) and Eq. (11). Eq. (14) is the relation between and .
axis:
axis:
The path is deduced from Eq. (9) as follows:
Obtained by Eqs. (11) and (10):
3. Data fitting verification algorithm accuracy
The residual modulus was used to measure the fitting effect of the compensation function on the data fit and the accuracy of the compensation function. The smaller the residual modulus, the better the fitting effect of the model [12].
The sum of squared residuals is shown in Eq. (15): represents the measured value and represents the actual value [13]:
3.1. The fitting relation between the angle measurement data and the angle compensation method of wind and ultrasonic path
The ultrasonic measurement data of the ultrasonic wind meter was obtained at 13 angles of 9 wind speeds [6].
The relationship between the actual angle and the measured angle in the case of measuring nine wind speeds is shown in Fig. 4. The wind angles measured under different wind speeds at the same wind speed angle are basically coincident. The sum of squared residuals is 0.0049, this two fit well.
3.2. The difference between the angle measurement and the actual value after the algorithm compensation
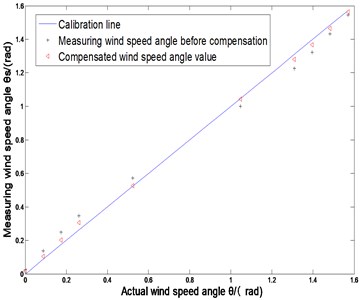
In fact, the actual projected wind speed on the path at the same angle is proportional to the measured wind speed deducted from Eq. (8). In Fig. 5, the measurement angle of the wind speed 16.73 m/s is compensated, and the measurement error is found to be the largest when the angle between the wind speed angle and the sensor measurement path is between 5.73° and 22.9°. The compensation wind speed angle represented by “△” is closer to the actual calibration line than “+” which represents the measured value before compensation, and the compensated data has smaller error.
By calculation, the residual square sum of the measured angle and the actual value before compensation is 0.0366, and the squared sum of the measured angle and the actual value after compensation is 0.0052.
Fig. 4Wind angle compensation function and measurement angle
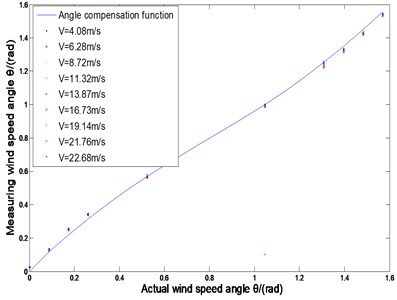
Fig. 5Comparison before and after measuring wind angle compensation
3.3. Error changes before and after wind speed compensation
In Fig. 6, comparing the values of the wind speed U before and after compensation, the error caused by the shadow effect is significantly reduced. Among them, the measurement error of wind speed is 14.65 %, and the error after algorithm compensation is 1.74 %.
The squared sum of the residual wind velocity U and the actual value before compensation is 34.4620. While after the compensation, the value is 0.0943.
Fig. 6Comparison before and after measurement of wind speed compensation
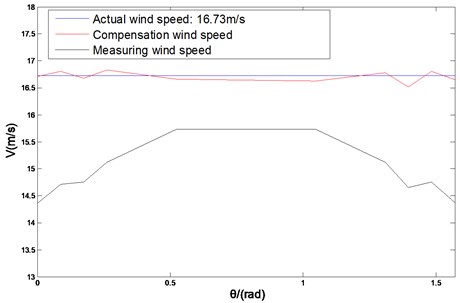
It is found that the sum of the squares of the residuals of the data after the algorithm compensation is reduced obviously. It indicates that the compensation value is well fitted to the actual measured value.
4. Conclusions
In experiment, found shadowing effect caused by specific measurement error is very obvious by fitting the data, the deviation of the wind speed even reached to 14.65 %.
We do specific data compensation for the specific model of the ultrasonic wind gauge to improve measurement accuracy. Also, we establish a good ultrasonic anemometer model experiment and the path selection algorithm for calculating the compensation is lower complexity. The verification fitting degree angle correction function thus obtained, the accuracy of the wind speed calculated direction as well.
The fitting effect is fine, and the wind speed error is reduced to 1.74 %. The algorithm reduces the error caused by the shadow effect and improves the accuracy of the ultrasonic wind measurement, which has practical value.
References
-
Zhang Jiahong, Sun Linfeng, Li Min, Mao Xiaoli, Ge Yixian Study on shadow effect compensation of ultrasonic wind meter based on CFD and BP neural network. Journal of Sensing Technology, Vol. 31, Issue 8, 2012, p. 1201-1210.
-
Huang Min, Lu Huiguo, Wang Baqiang Measurement of ultrasonic wind sensor in loop wind tunnel. Journal of Meteorological Science and Technology, Vol. 44, Issue 1, 2016, p. 14-18.
-
Kaimal J. C. Sonic anemometer measurement of atmospheric turbulence. Dynamic Flow Conference, Denmark, 1979.
-
Taylor J. R. Introduction to Error Analysis: the Study of Uncertainties in Physical Measurements. 2nd Ed., University Science Books, 1997.
-
Cuerva A., Sanz-Andres A. On soic anemometer measurement theory. Journal of Wind Engineering and Industrial Aerodynamics, Vol. 88, Issue 1, 2000, p. 25-55.
-
John Wyngaard C. Cup, propeller, vane, and sonic anemometers in turbulence research. Annual Review of Fluid Mechanics, Vol. 13, 1981, p. 399-423.
-
Franchini S. A., Sanz Andrés, Cuerva A. Effect of the pulse trajectory on ultrasonic fluid velocity measurement. Experiments in Fluids, Vol. 43, Issue 6, 2007, p. 969-978.
-
Xing Hongyan, Wu Hongjun, Xu Wei, Wei Jiajia Study on three-dimensional ultrasonic transducer wind array. Chinese Journal of Instrumentation, Vol. 38, Issue 12, 2017, p. 2943-2951.
-
Wyngaard John C., Zhang S. F. Transducer shadow effects on turbulence spectra measured by sonic anemometers. Journal of Atmospheric and Oceanic Technology, Vol. 2, 1985, p. 548-558.
-
Ghaemi-Nasab M., Franchini S., Sorribes Palmer F., et al. A calibration procedure to correct the shadow effect in ultrasonic wind sensors. Journal of Wind Engineering and Industrial Aerodynamics, Vol. 179, 2018, p. 475-482.
-
Ghaemi-Nasab M., Franchini S., Davari A. R. A procedure for calibrating the spinning ultrasonic wind sensors. Measurement, Vol. 114, 2018, p. 365-371.
-
Fang Zhongxing Mathematical inference of multivariate nonlinear data fitting model and computer fitting of regression equation. Data Acquisition and Processing, Vol. 4, 1992, p. 246-252.
-
Li Yu Application of computer curve fitting in nonlinear regression analysis. Journal of Henan University (Natural Science Edition), Vol. 29, Issue 3, 1999, p. 51-54.
