Abstract
Closed-cell aluminum foam has been widely used in aerospace, rail transit and mechanical for its outstanding performance. But for a long time, the research on its vibration damping performance is only limited to the material damping test, there are relatively few studies on its dynamic characteristics. In this paper, we studied the relationship between dynamic characteristic and feature parameters. Modal assurance criterion and Finite element method were used to verify the accuracy of experimental model. It turned out that the average pore diameter of closed-cell aluminum foam conforms to Gaussian distribution. The modal analysis method can be used in the research of dynamic characteristic of closed-cell aluminum foam. Its damping ratio showed increasing trend with the increase of porosity, natural frequency and the decrease of mean pore size. Each order natural frequency increases along with the increase of porosity.
Highlights
- Modal analysis method can effectively analyze the dynamic characteristics of closed-cell aluminum foam.
- The natural frequency of closed-cell aluminum foam is negatively correlated to porosity and it increases with the increase of sample height when the axial dimension smaller than the radial dimension.
- FEM can be used to study the dynamic characteristic of closed-cell aluminum foam and compared with experiment it has some advantages.
1. Introduction
Closed-cell aluminum foam is a new kind of multifunctional metal porous material, which has the characteristics of both metal and bubbles. It’s becoming one of the hot research topics in the current metal material field for its excellent mechanical and physical properties [1], such as low density, high specific strength, high specific stiffness, high energy absorption, high damping vibration, phonics, electromagnetic shielding and its multi-function compatible [2]. One of its main uses is as damping material; it can effectively reduce the vibration and noise that has a great significance to improve the accuracy and life of equipment as well as the working environment.
Now, some aspects of closed-cell aluminum foam have been deeply researched by experiment and FEM, such as the production process [3], dynamic and static compression [4] and energy absorption [5]. For its dynamic characteristics, especially the vibration damping performance mainly concentrated in the damping test referenced the standard of ASTM E756-05. Han et al. [6] and Liu et al. [7] have researched the factors influencing the damping property of closed-cell aluminum foam and damping mechanism. Golovin and Sinning [8] have researched its mechanical damping in a wide range of deformation amplitude. L. Dahil et al. [9] have studied the relationship between density and damping ratio of foamed aluminum using modal analysis method.
In this article, first, describe the analysis of feature parameters, adopted a new and simple method to analyze the porosity, characteristics of pore. Then using the modal analysis method to research the relationship between dynamic characteristic and feature parameters. Modal assurance criterion (MAC) and coherence function were used to verify the correctness of the model. We also compared the results by Finite element method (FEM). Last, the conclusions.
2. Experimental procedures
2.1. Feature parameters
The samples were made by melt foaming method and incised by wire-electrode cutting method. The sample size, outside diameter is Ø440 mm, inside diameter is Ø280 mm and the height is unequal.
Porosity is an important parameter to describe the closed-cell aluminum foam. The measurement method of porosity is divided into weighing method and microscopic method. For its simple and high precision, weighing method is commonly used. According to the dimension and weight of the sample, using the Eq. (1) to calculate the porosity:
In which, m and V are the mass and volume of the sample, respectively, ρs is the density of matrix material.
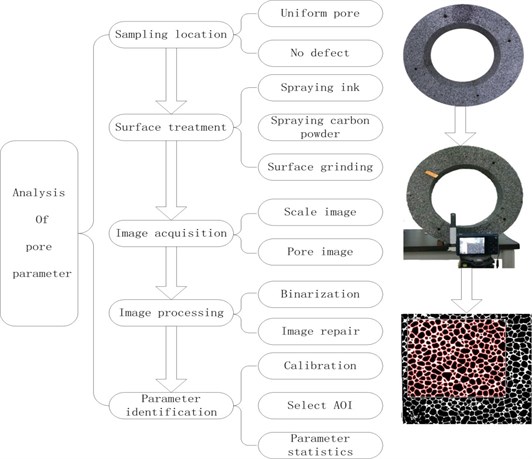
The measurement of pore parameters mainly includes direct method and indirect method that using the software to analysis the surface topography of the sample [19]. In this article, we applied a new and simple method to measure the pore parameters. It has the advantages of low cost and high precision. The main equipment is digital camera and the main software is Photoshop, Matlab and Image-Pro Plus. The basic procession is shown in Fig. 1.
Fig. 1The basic procession
2.2. Dynamic characteristic test
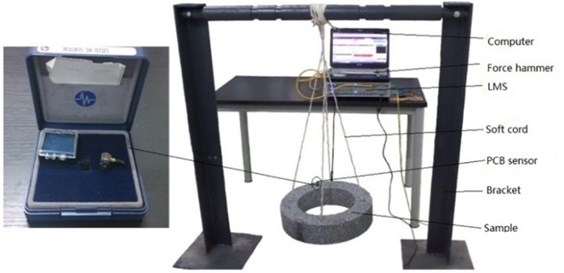
The dynamic characteristic was performed by experimental modal analysis and FEM. As shown in Fig. 2, the whole testing system composed by four parts; suspension part, shaking part, testing part and software analysis part. The suspension part includes rigid bracket and elastic soft cord to simulate the free boundary condition. The shaking part is impact hammer which is commonly used in the single-input single-output (SISO) modal analysis to produce pulse signal. The testing part is PCB accelerometer and high-speed data acquisition system. The software analysis part is Virtual lab/Modal Analysis software.
Fig. 2The testing system
In the modeling process, the model is simplified to octagon with 48 nodes and ignores the mounting holes, as shown in Fig. 3. In which point 1:1 to 1:24 is the master node and the rest is the slave node. The PCB acceleration sensor is installed in the 1:3 points. During the experiment, using the force hammer which installed rigid head to beat the other master node, every node beats at least three times. The related experimental parameters as shown in Table 1.
Fig. 3The geometric model
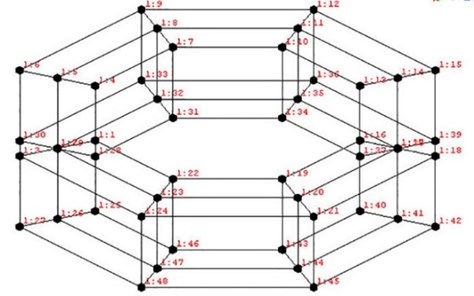
Table 1Related experimental parameters
Force sensor sensitivity | PCB sensor sensitivity | Bandwidth | Resolution | Averages | Response windowing |
4 PC/N | 101.7 mv/g | 4096 Hz | 1 Hz | 3 | Exponential |
MAC was used to test the linear independence of each order. MAC is a good tool to evaluate the modal vector space angle. It can be expressed as follows:
where φiand φj are the corresponding freedom of the i and j order calculation mode, respectively. The smaller of the off-diagonal matrix is the better of the independence of each calculation mode.
In this article, we also used the ABAQUS software to give a modal analysis in order to better verify the testing results. The basic steps of modal analysis in ABAQUS include modeling, select the analysis type, set the corresponding parameters, applying the boundary conditions, solve and results post processing. The parameters used in the simulation are shown in Table 2.
Table 2Parameters used in FEM
Height | Porosity | Density (kg/m3) | Young’s modulus × 106(Pa) | Poisson’s ratio |
50 | 85.8 % | 380 | 428.61 | 0.28 |
50 | 86.4 % | 370 | 401.14 | 0.28 |
80 | 81.9 % | 490 | 603.07 | 0.28 |
80 | 85.0 % | 400 | 484 | 0.28 |
120 | 83.9 % | 430 | 524.36 | 0.28 |
120 | 85.2 % | 400 | 454.67 | 0.28 |
150 | 84.6 % | 420 | 502.18 | 0.28 |
150 | 86.0 % | 380 | 451.43 | 0.28 |
3. Results and discussion
3.1. Feature parameters analysis
Table 3 shows the feature parameters of aluminum foam. It can be found that the porosity is among 81.9 % to 86.42 %, the relative density is among 0.136 to 0.181, the average diameter is among 2.42 to 3.23 mm.
Table 3Parameters of aluminum foam
No. | Height / mm | Mass / g | Porosity | Diameter / mm | Relative density |
1 | 50 | 1761 | 85.79 % | 3.23 | 0.142 |
2 | 50 | 1665 | 86.42 % | 2.65 | 0.136 |
3 | 80 | 2930 | 85.01 % | 2.77 | 0.150 |
4 | 80 | 3540 | 81.90 % | 2.42 | 0.181 |
5 | 120 | 4694 | 83.92 % | 2.44 | 0.161 |
6 | 120 | 4334 | 85.21 % | 2.72 | 0.148 |
7 | 150 | 5629 | 84.61 % | 2.70 | 0.154 |
8 | 150 | 5132 | 85.95 % | 3.09 | 0.140 |
3.2. Experimental modal analysis
3.2.1. Results and validation
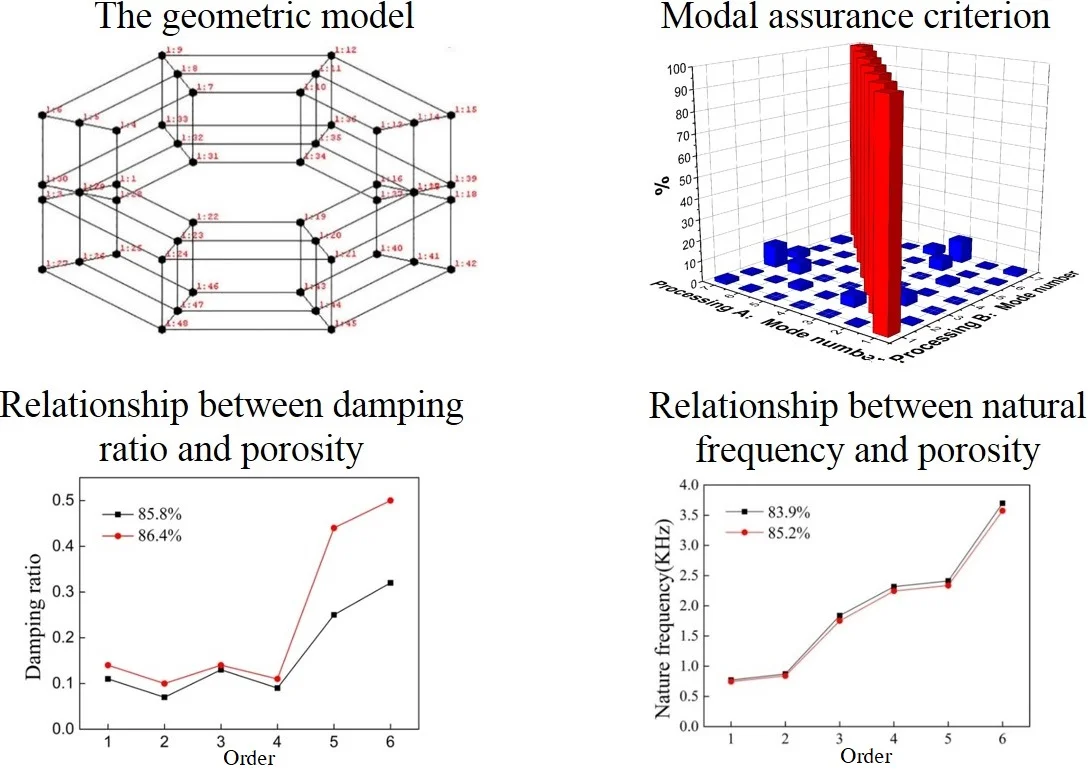
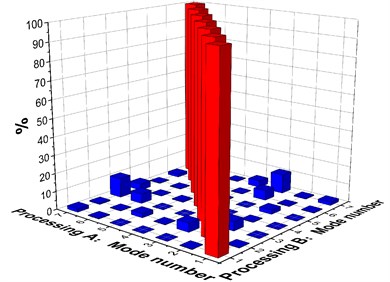
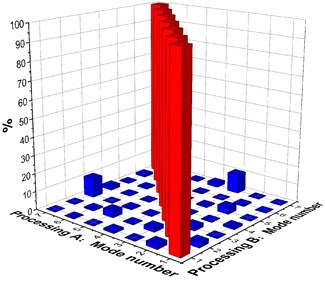
In this article, we analyzed the first six orders. As shown in Fig. 4 is the MAC of each sample. Through the MAC it can be found that except the diagonal correlation is 100 %, the other off-diagonal correlation is fewer than 10 % and mostly fewer than 5 %. According the above criteria of MAC, it can be found that the node configuration is reasonable, and each order modal has higher orthogonality.
Fig. 4Modal assurance criterion
a) Sample one
b) Sample two
3.2.2. Discussion of experimental modal results
(1) Relationship between damping ratio and porosity.
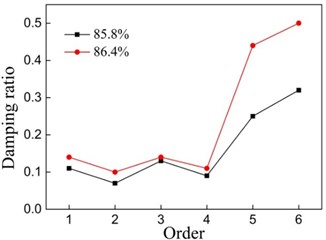
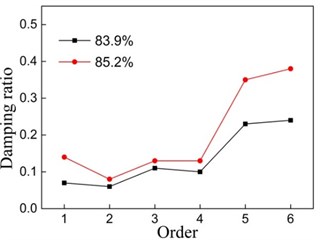
As shown in Fig. 5 is the result of damping ratio of each sample. It can be seen from Fig. 5 each order damping ratio increases with the increase of porosity, the damping ratio and porosity is positively correlated. But in some orders the damping ratio decreases with the increase of porosity for the manufacturing defect.
Fig. 5Relationship between damping ratio and porosity
a) Sample one
b) Sample two
(2) Relationship between natural frequency and porosity.
Material’s vibration damping performance and damping ratio are closely related, but there is another important factor that affects the vibration damping performance is the natural frequency of the sample. As shown in Fig. 6, it can be found that the natural frequency of each order decreases with the increase of porosity and increases with the increase of height of the sample. In this experiment, the sample’s axial dimension is less than the radial dimension, the stiffness of axial increases greater than the increase of mass, its natural frequency is increased with the increase of height.
Fig. 6Relationship between natural frequency and porosity
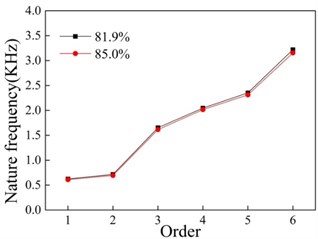
a) Sample one
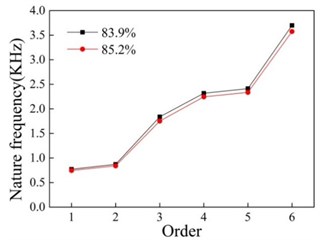
b) Sample two
3.3. Comparison between experiment and FEM
By comparing the simulation results and experimental results can make a mutual authentication between the two methods. The results are shown in the Table 4. As it can be seen the simulation results can be good fit with the testing results. So, in the next study, we can use the FEM to study its dynamic characteristic.
4. Conclusions
First, modal analysis method can effectively analyze the dynamic characteristics of closed-cell aluminum foam. Second, the natural frequency of closed-cell aluminum foam is negatively correlated to porosity and it increases with the increase of sample height when the axial dimension smaller than the radial dimension.
Third, FEM can be used to study the dynamic characteristic of closed-cell aluminum foam and compared with experiment it has some advantages; it can make a further optimization analysis of the sample shape by FEM.
Table 4Comparison between FEM and experiment
Height | Porosity | Item | First order frequency | Second order frequency | Third order frequency | Forth order frequency | Fifth order frequency | Sixth order frequency |
50 | 0.8579 | Test value | 412.521 | 467.224 | 1156.314 | 1569.274 | 1991.156 | 2275.407 |
FEM value | 441.43 | 464.18 | 1172 | 1558.6 | 2041 | 2259.5 | ||
Error | 0.07 | –0.0065 | 0.014 | –0.0068 | 0.025 | –0.0069 | ||
50 | 0.8642 | Test value | 403.873 | 465.858 | 1147.42 | 1550.125 | 1924.597 | 2261.659 |
FEM value | 432.93 | 445.16 | 1144.3 | 1572.7 | 1957.4 | 2166.9 | ||
Error | 0.072 | –0.044 | –0.0027 | 0.015 | 0.017 | –0.042 | ||
80 | 0.819 | Test value | 624.184 | 715.786 | 1652.535 | 2046.163 | 2352.014 | 3219.411 |
FEM value | 627.88 | 712.81 | 1855.4 | 2084.4 | 2312.3 | 3259.3 | ||
Error | 0.0059 | –0.0042 | 0.123 | 0.019 | –0.0017 | 0.012 | ||
80 | 0.8501 | Test value | 611.275 | 694.411 | 1614.625 | 2016.47 | 2312.069 | 3153.054 |
FEM value | 635.52 | 649.99 | 1607.7 | 2109.8 | 2314.9 | 3123.4 | ||
Error | 0.04 | –0.064 | –0.0043 | 0.046 | 0.0012 | –0.0094 | ||
120 | 0.8392 | Test value | 771.856 | 871.648 | 1838.794 | 2316.829 | 2412.699 | 3698.126 |
FEM value | 784.96 | 869.53 | 1871 | 2407.3 | 2423.7 | 3701.1 | ||
Error | 0.017 | –0.0024 | 0.018 | 0.039 | 0.0046 | 0.001 | ||
120 | 0.8521 | Test value | 745.5 | 839.099 | 1751.82 | 2244.576 | 2335.451 | 3574.857 |
FEM value | 767.51 | 849.5 | 1806.4 | 2324.2 | 2340 | 3598.4 | ||
Error | 0.03 | 0.013 | 0.03 | 0.035 | 0.002 | 0.007 | ||
150 | 0.8461 | Test value | 805.083 | 918.122 | 1790.455 | 2343.469 | 2972.636 | 3238.733 |
FEM value | 789.37 | 914.77 | 1770 | 2298.6 | 3034.9 | 3203.2 | ||
Error | –0.02 | –0.004 | –0.01 | 0.019 | 0.021 | –0.011 | ||
150 | 0.8595 | Test value | 794.044 | 895.565 | 1766.027 | 2315.208 | 2931.719 | 3118.055 |
FEM value | 786.83 | 911.79 | 1764.3 | 2291.2 | 3025.1 | 3137.9 | ||
Error | –0.01 | 0.018 | –0.001 | –0.01 | 0.032 | 0.007 |
References
-
Banhart J. Manufacture, characterization and application of cellular metals and metal foams. Progress in Materials Science, Vol. 46, 2001, p. 559-632.
-
Yao G. C. Aluminum Foam. Science Press, Beijing, 2013, p. 8-15.
-
Liu J. F., Liu R. P. Study on new preparation process of aluminum foam. Materials Review, Vol. 17, Issue 6, 1998, p. 11-45.
-
Yang Z., Yang Y. S. The finite element simulation of compression behavior of closed-cell aluminum foam. Ordnance Materials Science and Engineering, Vol. 36, Issue 5, 2013, p. 33-36.
-
Zeng F., Pan Y., Hu S. S. Evaluation of cushioning properties and energy-absorption capability of foam aluminum. Explosion and Impact, Vol. 22, Issue 4, 2002, p. 358-362.
-
Han F. S., Zhu Z. G., Shi C. Y. Study on the damping characteristics of foamed aluminum. Acta Physica Sinica, Vol. 47, 1998, p. 1161-1170.
-
Liu C. S., Zhu Z. G., Han F. S. Internal friction of foamed aluminum in the range of acoustic frequencies. Journal of Materials Science, Vol. 33, 1998, p. 1769-1775.
-
Golovin I. S., Sining H. R. Damping in some cellular metallic materials. Journal of Alloys and Compounds, Vol. 335, 2003, p. 2-9.
-
Dahil L., Karabulut A., Baspinar S. Damping properties of open pore aluminum foams produced by vacuum casting and NaCL dissolution process. Metalugijia, Vol. 52, Issue 4, 2013, p. 489-492.

