Abstract
In recent years, industrial applications have been based on the use of intrinsic material properties that improve designs, processes, qualities and product controls. To get to those intrinsic parameters, various appropriate techniques are required. In this paper, a new technique has been developed and presented. It essentially puts the emphasis on the dielectric relative permittivity extraction from the principle of a movable short-circuit through the coaxial transmission-line cell. This technique is aimed at drastically reducing the discontinuity impacts at the interface feed line (connector) and ideal line, solving the phase constant frequency limit, stopping the constraints bound to the higher mode propagations and improving the accuracy level when the frequency range has increased. The technique is based on the use of the sum of two different lengths of the cell by removing the first value of the phase constant in the frequency range of interest when it is negative. This new technique can be easily implemented; its focus is not on iterative principles, but on the use of the constant propagation of a Quasi-TEM mode of the transmission-line. The bio-food industry (semolina), environmental field (palm tree) and building trade (aquarium sand) were used to test the validity of the technique in 2-20 GHz.
1. Introduction
The material characterization has a wide variety of techniques [1-3], depending on the application domain [4]. These domains help to reveal why different materials show different properties and behaviors [5-7]. A large panel of material characterization techniques is described in the literature. Most of accurate techniques are developed in relation to the fixture’s geometry, the precise measurement apparatus and the kind and shape of the material to be tested [8]. The transmission-line technique is the well-known and popular in the literature. That technique can be used in transmission [7-9] and/or in reflection with open-end configuration [10, 11] or short-circuit [12]. All structures terminated by an open circuit and/or short-circuit use the iterative procedure [13]. Probe technique which is used for liquid through Cole-Cole theory [14], but also through combination of cavity mixed with probe [1] and [6] has a good accuracy according to the material thickness. For thick material, the free-space technique is quite often used [15, 16]. But the resonator technique, through the use of cavity is the best and is well-developed in [17]. The sample to be characterized defines the technique through its state and sharp [18]. All techniques have advantages and inconveniences. One of them is discontinuity that stops the scanned frequency range, promotes the spread of high-order modes [19] and increases measurement errors through the intrinsic material complex parameters [20]. In order to contribute to the techniques improvement, we have developed a new technique called Movable Short-Circuited Line (MSCL). This technique is broadband and belongs to the reflection transmission-line technique [12]. The use of two transmission-lines is a good way to reduce discontinuities instead of choosing an equivalent electric circuit as their representation [21]. Those discontinuities exist at the junction of connector and the ideal test cell interface. Discontinuity represents imperfections of the entire test cell. From the two transmission-line technique using the wave cascade matrix principal [7, 22], we have developed the mathematic formulation for the MSCL. It is based upon the sum of measurements when using two different lengths of the test cell, but in inserting the first value of the studied band. That has allowed sorting out the discontinuity impacts on the extraction of the relative permittivity. Both circular coaxial line fixtures are differentiated only by their lengths while diameters and conductors are identical. The material under test is trapped inside the fixture, and s-parameter measurements are done in two configurations: in presence and absence of the sample under test (SUT). The use of the propagation constant parameter through measurement of the reflection coefficient is the foundation of the technique. This is a quick, simple and highly reliable technique when the fixture is completely full of the material under test (MUT). The technique is suitable for destructive (wafer, etc.) as well as non-destructive (liquid, powder, etc.) samples.
2. Theory and mathematic model
2.1. Propagation constant determination
The propagation constant γ is the unique parameter we can extract, and it must be applied in this technique. The short-circuit reflection coefficient Ssc11 is given in Eq. (1) as:
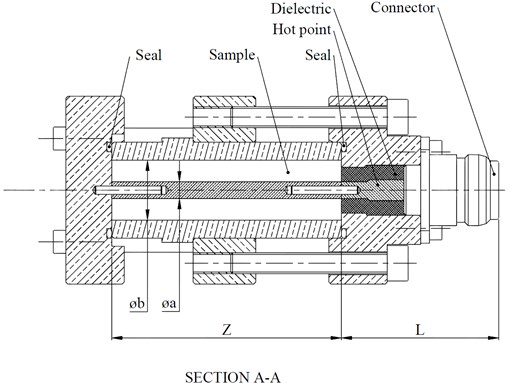
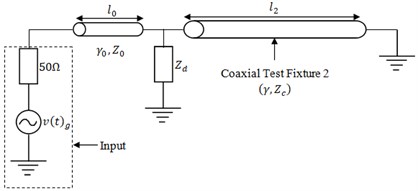
Fig. 1 describes the test fixture, where Z and L are respectively the cell and the connector lengths.
Fig. 1A coaxial test fixture design
The propagation constant is determined from the reflection coefficient through the following expression:
The propagation constant is a complex parameter as defined below.
where θ=βl is the electric length and αl the attenuation constant. We assume that only a Quasi-TEM mode propagates in and the vacuum configuration is linked to the filled structure by:
where βd and βvac are respectively the phase constants of the sample under test (SUT) and vacuum filled coaxial. In that case, the material relative parameters (permittivity and/or permeability) are obtained from equation (4) as:
We have easily filled up the circular coaxial test fixture with the non-destructive material, the one we used to validate the technique implementation.
2.2. De-embedding technique
The work requires the good knowledge of the connector propagation constant γ0 as it is shown in the Fig. 2. and l0 the connector length.
Fig. 2A simplified fixture roadmap
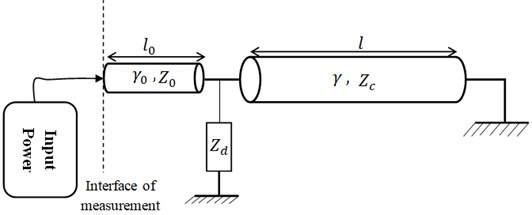
The discontinuity impedance Zd appears at the connector-fixture interface. From Zscin and Zocin, respectively, the input impedance of the connector when the connector is in short-circuit and in open-circuit configurations. The connector propagation constant is as follows:
If we call by Sg11 the entire reflection coefficient and Γ the input cell reflection coefficient, both are linked by Eq. (7) as:
Because the main and only goal of this technique is to determine the relative permittivity εr of the material as mentioned in introduction, the focus of our work is to get that parameters by using the phase constant of the structure filled of vacuum and/or material under test (MUT).Whereas it is necessary to neglect the material losses, we have come with a mathematic equation to solve the negative number of the phase constant and discontinuities as in imperfection between the contact interface and ideal connector line as follows:
where (βl)mes is the phase constant of the test cell, measured in any aforementioned configurations, and (βl)ivmes its initial value once measured in the work frequency range. (βl)id is the ideal phase constant as βl>0.
3. Technique description
Due to the high order mode propagations in the test cell (at interface of connector – ideal cell that leads imperfections) and the phase constant behavior which is the high order mode propagation consequence, the frequency range of study is limited [7-9]. On the other hand, the use of the short-circuit configuration involves the use of iterative method [12] and [21]; we have put forward this new technique. There are two methodologies we have developed for the relative permittivity εr or permeability μr determination. Both of them are concerned with a model based on the transmission-line propagation constant. The determination can be based on a variety of criteria.
3.1. Use of one transmission-line technique
Let us consider a transmission-line cell, terminated by a short circuit in the end of the line. From the input impedance as illustrated below:
Fig. 3Ideal transmission-line ended by short-circuit
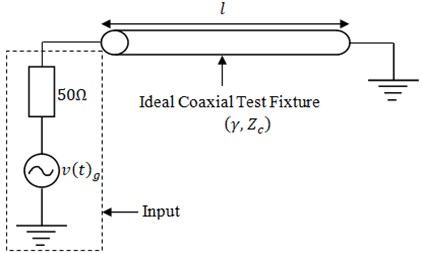
Eq. (9) is provided to calculate the input impedance once the line propagation constant is known.
Taking into account the reflection coefficient after de-embedding the entire structure, the input impedance is given by:
If we suppose that the transmission line is lossless, in that case, γl≈jθ, Eq. (9) will be rewritten. At the same time, we respectively named by (Zscin)v and (Zscin)MUT the input impedances in absence and presence of the MUT, which are linked to Eq. (9) by:
In this context, the iterative technique may be used. This solution can be watered down by its complexity through time taken to get to the aim. That’s why we have started by using a technique based on the average of two different extracted relative permittivity from two different lengths of a transmission line. If the test cell is homogenous like the one we manufactured and use to validate the technique process, then Eq. (11) becomes
and for the second transmission-line, we used the following equation in Eq. (12b),
We have noticed that the real relative permittivity or relative permeability is obtained once the average operation is done, as follows Eq. (13a):
We have named (βklk)xmes and ((βklk)xmes)iv the phase constants when the test cell is filled up of MUT or not and measured (x is MUT or vacuum and, k=1 or 2, the number of the cell that we used). If the sample to characterize is not magnetic, the final Eq. (13a) will approximately be reduced to:
The combination of both transmission lines can be done in another way. This is the technique we have named “Movable Short-Circuit Line” (MSCL).
3.2. Movable short-circuit transmission-line technique
In this section, we combined two transmission lines, having the same characteristic impedance, geometry and dimensions (inner and outer diameters), but different lengths. The short-circuit position is considered movable because of the fixture’s length as shown in Fig. 4.
Fig. 4Two transmission-lines with short-circuit at the bottom
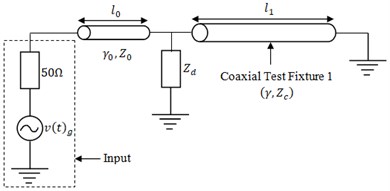
In this situation, discontinuities are the same and, we assume that higher propagation modes cannot spread or propagate in. The ideal line, which is the length’s difference, ∆, has a propagation constant given in Eq. (14).
From Eq. (8) and supposing that , which are the initial values of the phase constant when using the test cell corresponding to length and in each configuration (with or without MUT), we can write:
Associating Eqs. (12) and (15), the relative permittivity or permeability can be estimated through Eq. (16), given below as:
4. Technique improvement
This technique presents the peculiarity to behave according to the resonances of the waveguide. Electromagnetic simulations allowed us during the de-embedding steps, to redefine the reflection coefficient of Eq. (7) by adding “” as given in the following equation:
So, all equations that we got previously are combined to the new formulation of the reflection coefficient. In that case, Eq. (5) will be written as:
where ““ is a constant to be determined. We note by and the linearised phase constants when the test cell is in filled up with vacuum and MUT before correction, respectively, and by and once having corrected. By the way, we defined two elements and such as and . In that case, Eq. (18) is written as:
Eq. (19) says that changes according to the material under test and the study frequency range. In addition, the fixture dimensions limit the study’s bandwidth, especially in frequencies lower than GHz. In other words, as long as the gap between the inner diameter “” of the outer conductor and the outer diameter “” of the inner conductor is small, low frequencies than 2 GHz are reachable. That is the main reason in the choice of the test cell in terms of shape and dimensions. In point of fact, we validated the technique implementation with aquarium sand, semolina and palm trees with two species: vinifera and laurentiis. Further reasons to be sure that the results are right, we compared them with those obtained by using the two transmission-line technique (2TL) when the test cells are exactly the same. We have named by and the linearised phase constant when the technique is used without improvement and by and once improved. In that case:
5. Technique validation
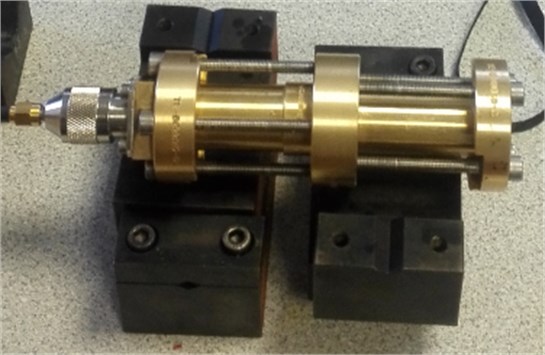
Measurements have been done from 20 MHz to 20 GHz with a particular attention on the frequency range 2-20 GHz. We have validated the technique with experiment on non-magnetic materials such as: palm tree raffia, semolina and aquarium sand. A vector network analyzer (VNA), connected to two circular coaxial test cells, which are manufactured in brass, where = 14.38 mm and = 4 mm as it is shown in Fig. 4, with 80 mm and 100 mm of lengths, is the RF measurement equipment we used.
Fig. 5The test cell design
5.1. Electromagnetic simulations
We have evaluated the technique relative error from the phase constant when the structure is filled up with vacuum. Using the circular coaxial dimensions that we have designed and manufactured, we compared both in good situation (absence of connector) and the real situation (there is a connector placed at a tip of the test cell).
Fig. 6Phase constants of ideal line after extraction from electromagnetic simulations: use of Eq. (20a)
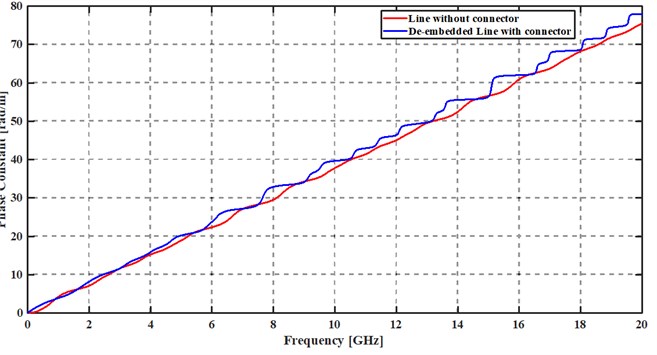
We have extracted the phase constants in both cases and can notice that both sketch curves are nearly the same and negatives from 20 MHz up to 1 GHz. In that case, we have applied Eq. (8) to solve that.
Fig. 7Relative error’s curve from ideal and de-embedded phase constants
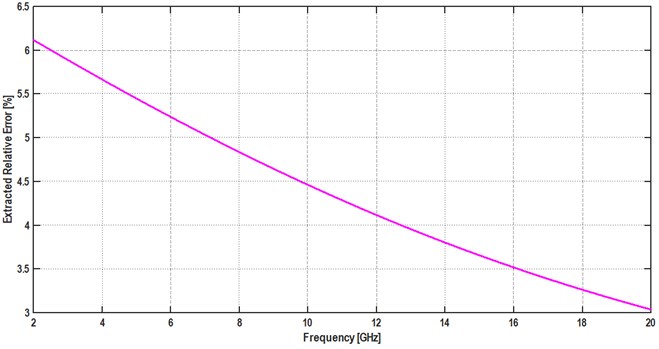
Once the incertitude of the error was evaluated, we observed, as the following figure shows that the relative error decreases when frequency increases. Our main goal is to have a technique with an error of less than 10 % in the frequency range 2-20 GHz. The limits generated by the propagation modes now are stopped up to 20 GHz in our case when the MUT is vacuum.
5.2. Experimental validation
To validate the movable short-circuit line technique implementation, we applied the extraction procedure to the biotechnology food such as semolina in frequency up to 5 GHz as it shown below.
Fig. 8Relative permittivity result comparisons using two different equations
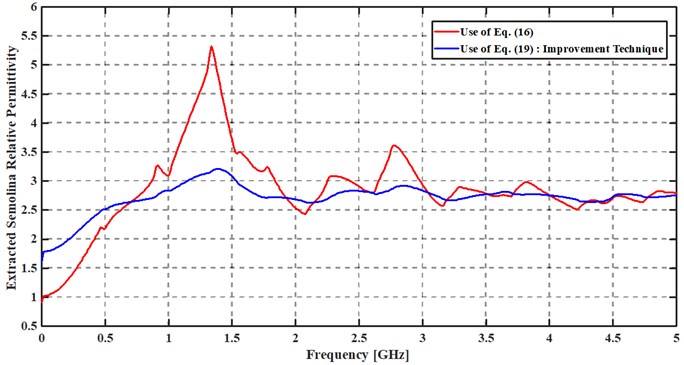
The use of Eq. (19) gives good results from 1.7 GHz while both techniques (basic and improvement ones) start to approach each another from 3 GHz. We have compared the improvement technique results to those obtained with the use of two transmission-lines in reflection/transmission [9].
Fig. 9Relative permittivity result comparisons using two different techniques
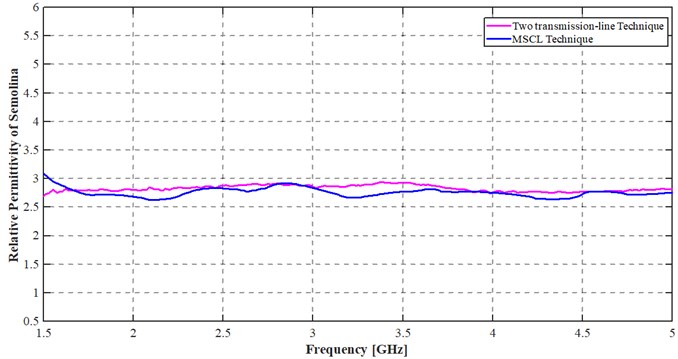
These results are closes to each another and prove that the movable short-circuit line technique, in its improvement version, is suitable for material relative permittivity extraction. The appropriateness or suitability of the low frequency where the technique can be acceptable is around 1.6 GHz. Because of that, we have extracted other material relative permittivities such as aquarium sand and palm raffia in order to certify that assertion.
Fig. 10Relative permittivity results using the MSCL technique from Eq. (19)
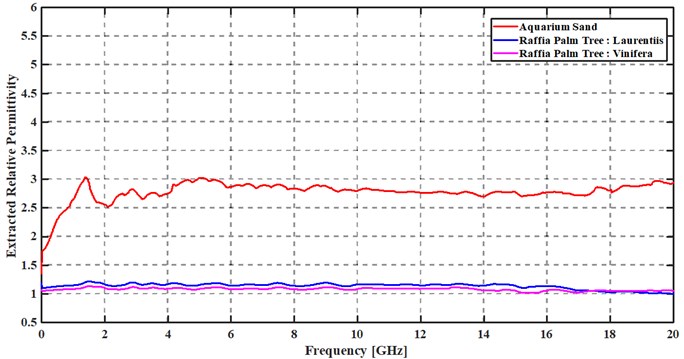
As we focused on frequency range 2-20 GHz, it is observed that the movable short-circuit technique has allowed covering frequencies upper than 10.4 GHz. Theoretically, when only vacuum is inside of this fixture, high order modes are generated from 10.4 GHz. Eq. (20), given in [21] is satisfied.
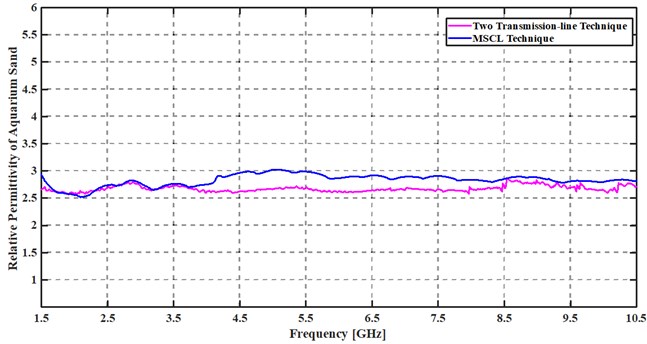
where “” and “”, inner diameter of the outer conductor and outer diameter of inner conductor, respectively, are in mm. The next sketched curves are used to compare results between two different techniques: the two transmission-lines (2TL) and MSCL.
Fig. 11Comparison of relative permittivity of a) aquarium sand from MSCL and 2TL techniques and b) Laurentiis from MSCL and 2TL techniques
a)
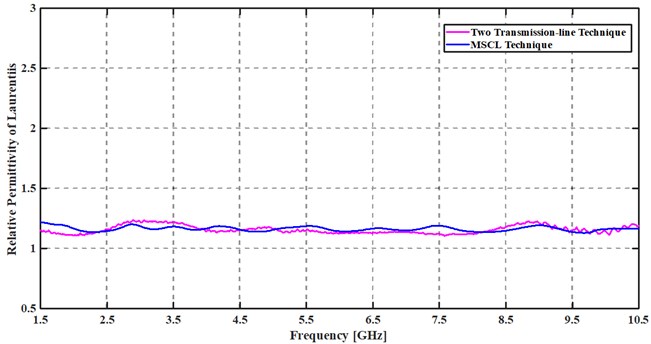
b)
The two transmission-line results are obtained with 4-6 % of relative error in the entire frequency range. The results are in conformity with those from electromagnetic simulation ones. The correction on the return loss coefficient allowed improving the extraction process and the technique implementation to cover frequencies 1.7-3.5 GHz.
6. Conclusions
In spite of the multitude of techniques which suffer from frequency limits because of the high order mode propagations that are generated by the test cell discontinuities, we have presented in this paper how to overcome that difficulty through the movable broadband short-circuit technique. This new way to extract the relative permittivity and/or permeability parameter is well adapted for industrial applications. We avoided using iterative solutions and suggested how to calculate automatically the correction factor according to the MUT and the scanned frequency range. The electromagnetic simulations have proved that the error rate is inversely proportional to frequency. It means that the more the covered frequencies increase, the better is the accuracy, which covers 7% to 3% when using homogenous configuration. We validated the technique implementation with some biotechnology materials: two palm tree species (vinifera and laurentiis), aquarium sand and semolina in the frequency range 2-18 GHz with a good accuracy. We have proved that the technique result can be repeated as long as the calibration of the connector is well made, especially its short circuit in microwave domains. Nevertheless, despite the progress we have made, the technique is not suitable for frequencies lower than 1.7 GHz, due to the test cell (dimensions or shape) and/or the mathematical formulation. This means that developing a new fixture or a new technique in order to reach low frequencies will be suitable.
References
-
Zarral L., Djahli F., Ndagijimana F. Technique of coaxial frame in reflection for the characterization of single and multilayer materials with correction of air gap. International Journal of Antennas and Propagation, Vol. 15, Issue 5, 2014, p. 1-9.
-
Peyman A. Holden S. J., Watts S., Perrott R., Gabriel C. Dielectric properties of porcine cerebrospinal tissues at microwave frequencies: in vivo, in vitro and systematic variation with age. Physics in Medicine and Biology, Vol. 52, Issue 8, 2007, p. 2229-2245.
-
Hand J. W. Modelling the interaction of electromagnetic fields (10 MHz – 10 GHz) with the human body. Physics in Medicine and Biology, Vol. 53, Issue 16, 2008, p. 243-286.
-
Cabanes-Sempere M., et al. Characterization method of dielectric properties of free falling drops in a microwave processing cavity and its application in microwave internal gelation. Measurement Science and Technology, Vol. 24, Issue 9, 2013.
-
La Gioia A., O’Halloran M., Porter E. Modelling the sensing radius of a coaxial probe for dielectric characterization of biological tissues. IEEE Access, Vol. 6, 2018, p. 46516-46526.
-
Moukanda M., Ndagijimana F., Chilo J., Saguet P. Coaxial probe fixture used for complex permittivity measurement of thin layers. African Physical Review, Vol. 2, Issue 31, 2008, p. 65-67.
-
Reynoso-Hernandez J. A. Unified method for determining the complex propagation constant of reflecting and non-reflecting transmission lines. IEEE Microwave and Wireless Components Letters, Vol. 13, Issue 8, 2003, p. 351-353.
-
Takach A. A., Moukanda M. F., Ndagijimana F., Al-Husseini M., Jomaa J. Two-line technique for dielectric material characterization with application in 3D-printing filament electrical parameters extraction. Progress in Electromagnetic Research M., Vol. 85, 2019, p. 195-207.
-
Moukanda Mbango F., Al Takach A., Ndagijimana F. Complex relative permittivity extraction technique of biotechnology materials in microwave domains. International Journal of Electronics, Communication and Instrumentation Engineering Research and Development, Vol. 9, Issue 1, 2019, p. 33-42.
-
Mosig J. R., Besson J. C. E., Gex-Farby M., Gardiol F. E. Reflection of an open-ended coaxial line and application to non-destructive measurement of materials. IEEE Transaction on Instrumentation and Measurement, Vol. 30, 1981, p. 46-51.
-
Seaman R., Burdete E., Dehaan R. Open-ended coaxial exposure device for applying RF/microwave fields to very small biological preparations. IEEE Transaction on Microwave Theory and Techniques, Vol. 37, 1989, p. 102-111.
-
James Baker-Jarvis Transmission/reflection and short-circuit line permittivity measurements. National Institute of Standards and Technology, 1990, p. 68-76.
-
Wolfson B. J., Wentworth S. M. Complex permittivity and permeability measurement using a rectangular waveguide. Microwave and Optical Technology Letters, Vol. 27, Issue 3, 2000, p. 180-182.
-
Marsland T., Evans E. Dielectric measurements with an open-ended coaxial probe. IEEE Proceeding, Vol. 134, 1987, p. 341-349.
-
Ghodgaonkar D. K., Varadan V. V., Varadan V. K. Free-space measurement of complex permittivity and complex permeability of magnetic materials at microwave frequencies. IEEE Transaction on Instrumentation and Measurement, Vol. 39, Issue 2, 1990, p. 387-394.
-
Sagnard F., Bentabet F., Vignat C. In situ measurements of the complex permittivity of materials using reflection ellipsometry in the microwave band: Experiments (Part II). IEEE Transaction on Instrumentation and Measurement, Vol. 54, Issue 3, 2005, p. 1274-1282.
-
Salahum E., Queffelec P., Le Floch M., Gelin Ph. A Broadband Permeameter for in Situ Measurements of Rectangular Samples. IEEE Transactions on Magnetics. Vol. 37, Issue 4, 2001, p. 2743-2745.
-
Pozar D. M. Microwave Engineering, 3rd Edition. John Wiley and Sons, Inc., Hoboken, 2005.
-
Aleksandrov N. L., et al. Selective excitation of high order modes in circular waveguides. International Journal of Infrared and Millimeter Waves, Vol. 13, Issue 9, 1992, p. 1369-1385.
-
Moukanda Mbango F, Ndagijimana F. Electric parameter extractions using a broadband technique from coaxial line discontinuities. International Journal of Scientific Research and Management, Vol. 7, Issue 5, 2019, p. 248-253.
-
Moukanda Mbango F. Contribution à la Caractérisation Electrique de Matériaux Utilisés en Microélectronique Radiofréquence. Thesis of Université Joseph Fourier, Grenoble, 2008.
-
Janezic M. D., Jargon J. A. Complex permittivity determination from propagation constant measurements. IEEE Microwave and Guided Wave Letters. Vol. 9, Issue 2, 1999, p. 76-78.
Cited by
About this article
Authors would like to thank in a particular way F. Kuhlman for helpful suggestions and given samples to validate the new technique, also the anonymous reviewers for their attentive revision and thorough assessment.

