Abstract
Proposed method based on fuzzy logic, including the operation of calculating the 36 key parameters of the R, G, B, RG, RB, GB color components of the original RGB color space images of plant leaves and the GLCM adjacency matrix, forming fuzzy conclusions about the type of plant disease, defusing using threshold binarization and majority voting on 6 parameters.
1. Introduction
Most plant diseases cause changes in the appearance of the leaves in the visible spectrum. Digital processing of plant leaf images can be used to diagnose plant diseases.
To solve the problem of identifying features in images are used various methods of forming a set of features to classify them and refer them to a particular class. More often to solve the problem of identifying features in images of plant leaves are used textural attributes of leaf images to determine the type of plant disease.
Texture attributes are most often obtained using Gray Level Co-occurrence Matrix (GLCM matrices gray-scale images and CCM for color images), features based on measuring spatial frequencies, features using statistical characteristics of images (average, energy, variation, homogeneity, contrast, correlation coefficient, entropy, differential dispersion), features based on the description of structural elements [1-4]. When using an approach based on the use of statistical features of leaf images the effectiveness of the classification algorithm depends on the choice of a system of key features of images.
The original set of classification characteristics for the description of the texture may consist of 16 names of the signs of the adjacency matrix method of brightness levels (GLCM, Gray-Level Co-occurrence Matrix), 8 brightness difference vectors (GLDV, Gray-Level Difference Vector), the sum of 15 difference histograms (SADH, Sum and Difference Histograms) and 8 features that take into account the brightness values of individual image pixels (ODSH, One-Dimensional Signal Histogram). The values of TS are calculated for four angular directions α (α = 0; 45; 90; 135°) with a shift equal to one between the adjacent pixels of the image.
Various techniques have been used for recognition and classification diseases as color clustering, convolutional neural network [5]. By using neural network, the system can detect and classify the diseases, to reach acceptable accuracy it must provide big training time and big amount of resources, digital picture, infected and uninfected. Other methods are using feature extractions methods like Grey Level Occurrences Matrix (GLCM) [6], which provide many features for every phase (contrast, homogeneity, etc.), then training neural network or using fuzzy logic as a classifiers, using GLCM needs to use HSV or other color transformer then using filters for features, and used many far and different pictures from the same disease to get various features, to get acceptable accuracy. This system can recognize disease, which has big shape on the leaf, it cannot recognize small spots. It is difficult for the system to separate between, soil color and dry leaves in the pictures (for wheat diseases) and it will minimize the accuracy.
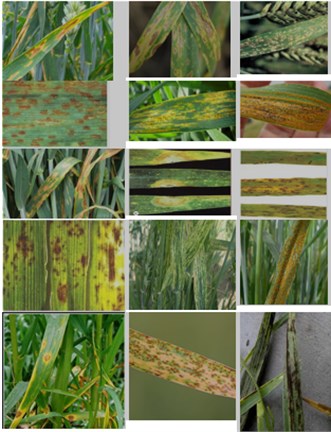
Fig. 1Leaves images of wheat in various diseases. 1 – Septoria Leaf Spot (Septoria), 2 – pirenoforoz (Pyrenophora tritici-repentis), 3 – Powdery mildew (Erysiphe graminis), 4 – brown rust (Puccinia recondita), 5, 6 – yellow rust (Puccinia striiformis), 7 – leaves Septoria Leaf Spot (Septoria tritici), 8 – Snow mold (Fusarium nivale), 9 – blotch (Helminthosporium sativum), 10 – Root rot, 11 – Stripe Mosaic (Wheat streake mosaic virus), 12 – Brown (sheet), rust (Fungal diseases (Puccinia triticina)), 13 – blotch (Pyrenophora tritici-repentis), 14 – Linear (stem) rust (Puccinia graminis), 15 – Head smut (Ustilago tritica)

2. The use of an extended set of key texture features Haralick in the diagnosis of plant diseases on leaf images
A characteristic feature of the distribution functions of key features of images is significant overlapping which excludes the possibility of forming recognition thresholds by the criteria of an ideal observer or Neumann-Pearson and unique identification of the type of disease. This predetermines the need to use fuzzy logic when using which the result of analyzing a particular image will be one or several outcomes for each of which the probability of its realization will be determinate. The clearly conclusion that an image belongs to one of the N possible types can be made according to the maximum probability. However, the probabilities of two outcomes may be the same.
To overcome this drawback we propose the calculation of 6 sets of Haralick indicators for the color components R, G, B, RG, RB, GB for calculation of the sets of N membership functions for each of the 6 sets of color indicators of image components and making a final decision on whether the image belongs to one of the N possible types by majority voting.
This well-known approach to solving the problem is the comparison of image textures based on an adjacency matrix (GLCM matrices for half-tone images and CCM for color images [7, 8]). In this case, the object of the analysis is not the image matrix, but the normalized adjacency matrices R, G, B, RG, RB, GB, on the basis of which the main features of the images are calculated, known as the Haralick signs [9, 10]: homogeneity, entropy, inverse difference moment, etc. The maximum number of signs is 14.
Earlier in [11], we proposed an approach to solving the classification problem based on fuzzy logic, which is used the classification of leaf images according to an set of features: contrast (CN), correlation (CR), energy (EN), homogeneity (HM) [11]:
where u, v – are the coordinates of the adjacency matrix, G – is the number of gray levels, μu, μv, σu and σv – are the mean values and standard deviations of the u-th row and the v-th column of the match matrix, respectively.
Our studies have shown the feasibility of using two more attributes for the diagnosis of plant diseases from the leaf image: entropy (f5) and inverse difference moment (f6):
However, the direct use of these parameters for identifying the type of disease does not lead to an unambiguously correct recognition result. To generate unambiguous recognition results is applied defuzzification.
The feasibility of its use in solving the problem of diagnosing plant diseases from leaf images was considered in [12]. A distinctive feature of our solution to this problem is that it involves calculating the membership functions for each of the 6 sets of R, G, B, RG, RB, GB, binarizing the results and making the final decision about the image belonging to one of the N possible types by majority voting.
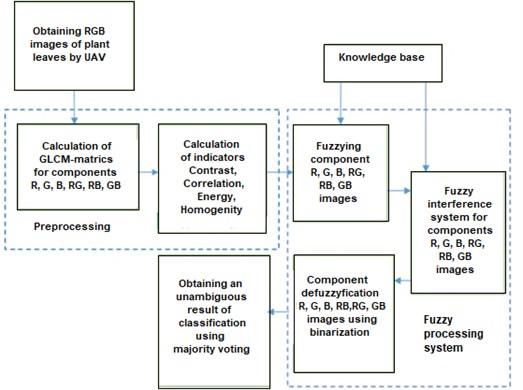
In Fig. 2 shows the proposed structure of the system for diagnosing plant diseases from leaf images.
Fig. 2Structure of the system for diagnosing plant diseases from leaf images

The proposed method for diagnosing the type of plant diseases from leaf images is based on the use of parameters of the adjacency matrix and majority voting and includes two stages.
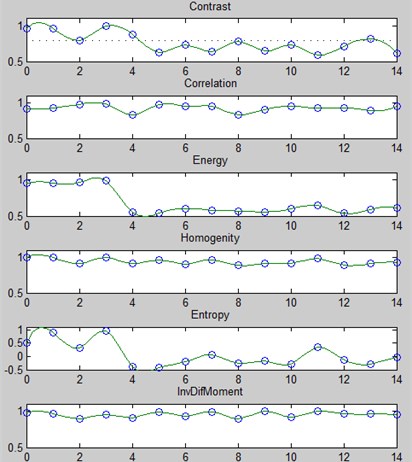
At the first stage, the parameters Contrast, correlation, energy, homogeneity, entropy, inverse difference moment are calculated and compared with reference descriptions by the method of maximum membership functions [7] for all N diseases (Fig. 3).
The mean values and confidence intervals of the reference descriptions should be obtained as a result of processing the training samples of leaf images for various diseases. However, for an unambiguous correct recognition of N plant diseases, the confidence intervals of the reference descriptions β should not exceed 1/2N. Considering this, when performing diagnostics it is necessary to analyze the values of Contrast, Correlation, Energy, Homogeneity, Entropy, Inverse Difference Moment parameters for several images of leaves, i.e. produce averaging. This is possible because in the area affected by the disease is always a several plants.
The number of averaged values of the parameters to choose from the condition that the confidence interval of the expectation of the averaged values of the parameters Contrast, Correlation, Energy, Homogeneity, Entropy, Inverse Difference Moment is not more than 1/2N. In order to minimize the number of averaged values of parameters, the range of values of parameters of the reference description should be determined individually for all 36 parameters.
Fig. 3An example of the membership functions for the image R component

Table 1Averaged values of the parameters
1 | 2 | 3 | 4 | 5 | 6 | 7 | 8 | 9 | 10 | 11 | 12 | 13 | 14 | 15 | |
GLCM recognition parameter | |||||||||||||||
Contrast | 1 | 1 | 0 | 1 | 0 | 0 | 0 | 0 | 0 | 0 | 0 | 0 | 0 | 0 | 0 |
Correlation | 0 | 1 | 1 | 1 | 0 | 1 | 1 | 1 | 0 | 0 | 1 | 1 | 1 | 0 | 1 |
Energy | 1 | 1 | 1 | 1 | 0 | 0 | 0 | 0 | 0 | 0 | 0 | 0 | 0 | 0 | 0 |
Homogenity | 1 | 1 | 0 | 1 | 0 | 1 | 0 | 1 | 0 | 0 | 0 | 1 | 0 | 0 | 0 |
Entropy | 0 | 0 | 0 | 1 | 0 | 0 | 0 | 0 | 0 | 0 | 0 | 0 | 0 | 0 | 0 |
Inverse difference moment | 1 | 1 | 1 | 1 | 1 | 1 | 1 | 1 | 1 | 1 | 1 | 1 | 1 | 1 | 1 |
Diagnostic results after the voting | 4 | 5 | 3 | 6 | 1 | 3 | 2 | 3 | 1 | 1 | 2 | 3 | 2 | 1 | 2 |
Binarization results | 0 | 1 | 0 | 1 | 0 | 0 | 0 | 0 | 0 | 0 | 0 | 0 | 0 | 0 | 0 |
Then, the diagnostic results are binarized (the value of the binarized comparison result is set to 1 if the parameter value falls within the reference description range or, equivalently, corresponds to the maximum membership function for a given disease, and 0 if it does not fall). But, even in this case, an unambiguous recognition result does not obtained (see Table 1).
At the second stage, we propose to use the binarization of results obtained at the first stage for the R, G, B, RG, RB, GB components, and then calculate the final diagnostic result by majority voting.
The results of the second stage of diagnosis obtained by modeling at a given level of confidence probability of 0.95 are given in Table 2 as an example, show that the results of binarization determine the type of disease with a given level of confidence.
The initial data for the diagnostic algorithm are reference descriptions of leaf images for all diseases: mean values of Uref(i,k,j) and values of confidence intervals β(i,j) for the distribution functions of these parameters. When conducting a model experiment, the mean values of Uref(i,k,j) were taken equal to the values of the parameters obtained during image processing for N diseases, and the confidence intervals were taken equal 0.04. Statistical evaluations of the diagnostic results by the proposed method were carried out for each of N diseases. As a result of N*1000 model experiments conducted (1000 experiments for each of N diseases), the correct diagnosis was 93.6-96.
Table 2The results of the second stage of diagnosis
1 | 2 | 3 | 4 | 5 | 6 | 7 | 8 | 9 | 10 | 11 | 12 | 13 | 14 | 15 | |
GLCM recognition parameter | |||||||||||||||
R | 0 | 1 | 0 | 1 | 0 | 0 | 0 | 0 | 0 | 0 | 0 | 0 | 0 | 0 | 0 |
G | 1 | 0 | 0 | 1 | 0 | 0 | 0 | 1 | 0 | 0 | 0 | 0 | 0 | 0 | 0 |
B | 0 | 0 | 0 | 1 | 0 | 0 | 0 | 0 | 0 | 0 | 0 | 0 | 0 | 0 | 0 |
RG | 0 | 0 | 0 | 1 | 0 | 0 | 0 | 0 | 0 | 0 | 0 | 0 | 0 | 0 | 0 |
RB | 1 | 1 | 0 | 1 | 0 | 1 | 1 | 1 | 1 | 0 | 0 | 0 | 1 | 0 | 0 |
GB | 0 | 1 | 1 | 1 | 0 | 0 | 0 | 1 | 0 | 0 | 0 | 1 | 1 | 0 | 1 |
Diagnostic results after majority voting | 2 | 3 | 1 | 6 | 0 | 1 | 1 | 3 | 1 | 0 | 0 | 1 | 2 | 0 | 1 |
Binarization results | 0 | 0 | 0 | 1 | 0 | 0 | 0 | 0 | 0 | 0 | 0 | 0 | 0 | 0 | 0 |
3. Algorithm description
The parent data for the diagnostic algorithm are reference descriptions of leaf images for all diseases: expected values Uref(i,k,j) of contrast, correlation, energy, homogeneity, entropy, inverse difference moment parameters and values of confidence intervals β(i,j) for functions distribution of values of these parameters.
The main stages of the algorithm:
1) Calculating the values of contrast, correlation, energy, homogeneity, entropy, inverse difference moment for all image components: R, G, B, RG, RB, GB (component number j= 1, …, 6) and calculating the membership functions MF(i,k,j) (indicators of comparison of key parameters of the original image with reference descriptions) for all components and all diseases:
where Uref(i,k,j) – array of reference descriptions; U(i,k) – array of measured parameter values; β(i,j) – reference interval confidence intervals.
2) Primary binarization of indicators on the threshold P:
3) Summation of binarized indicators and secondary binarization:
4) Summation of secondary binarization results, final majority voting and binarization:
4. Conclusions
1) To diagnose the type of plant disease using RGB images of leaves with a significant number of possible diseases, reliable results are obtained by calculating 36 indicators of contrast, correlation, energy, homogeneity, entropy, inverse difference moment of the GLCM matrix for the R, G, B, RG components, RB, GB of leaf images, use of fuzzy logic, at the stage of defuzzification – binarization and majority voting. As a result of N*1000 model experiments conducted under the condition that the standard deviation value of random variation of textural parameters does not exceed A/2N, where A – is the range of possible parameter values for N wheat diseases the proportion of correct diagnosis of the disease was about 95 %.
2) The reliability of the diagnostic results can be increased by diagnosing the type of plant disease by the average values of the key parameters of contrast, correlation, energy, homogeneity, entropy, inverse difference moment for several leaves.
3) It is recommended to clarify the values of the key parameters of the reference description during operation, which will ensure increased reliability of diagnostics.
References
-
Denisjuk V. S. Algoritmy vydelenija osobennostej na izobrazhenijah s cel'ju klassifikacii zabolevanij rastenij. iis.nsk.su/files/articles/sbor_kas_16_denisyuk.pdf.
-
Xu Kuan Man Using the Bootstrap Method for a Statistical Significance Test of Differences between Summary Histograms. NASA Langley Research Center, Hampton, VA, 2005. ntrs.nasa.gov/archive/nasa/casi.ntrs.nasa.gov/20080015431.pdf.
-
Bianconi Francesco, Harvey Richard, Southam Paul, Fernandez Antonio Theoretical and Experimental Comparison of Different Approaches for Colour Texture Classification. 2011, pdfs.semanticscholar.org/31a0/cf98ca459ab6e4676ac45700cc2485358347.pdf.
-
Kojshibaev M. Bolezni pshenicy. Prodovol’stvennaja i Sel’skohozjajstvennaja Organizacija OON (FAO), Ankara, 2018.
-
Sladojevic Srdjan, Arsenovic Marko, Anderla Andras, Culibrk Dubravko, Stefanovic Darko Deep neural networks based recognition of plant diseases by leaf image classification. Computational Intelligence and Neuroscience, Vol. 2016, 2016, p. 3289801.
-
Kiran A. Leaf disease recognition system. National Conference on Digital Image and Signal Processing, 2016.
-
Shtovba S. D. Vvedenie v Teoriju Nechetkih Mnozhestv i Nechetkuju Logiku. 2014, matlab.exponenta.ru/fuzzylogic/index.php.
-
Aung Ch H., Tant Z. P., Fedorov A. R., Fedorov P. A. Razrabotka algoritmov obrabotki izobrazhenij intellektual’nymi mobil’nymi robotami na osnove nechjotkoj logiki i nejronnyh setej. Sovremennye Problemy Nauki I Obrazovanija, Vol. 6, 2014.
-
Haralick R. M. Statistical and structural approaches to texture. Proceedings of the IEEE, Vol. 67, Issue 5, 1979, p. 768-804.
-
Haralick R. M., Shanmugam K., Dinstein I. Textural features for image classification. IEEE Transactions on Systems, Man and Cybernetics, Vol. 3, 1973, p. 610-621.
-
Tutygin V. S., Al Vindi Basim Halid Mohammed Ali Sistema klassifikacii teksturnyh izobrazhenij na osnove nechjotkoj logiki. Sovremennaja nauka: aktual’nye problemy teorii i praktiki. Serija Estestvennye i Tehnicheskie Nauki, Vol. 3, 2019, p. 99-106.
-
Astafurov V. G., Evsjutkin T. V., Kur'janovich K. V., Skorohodov A. V. Klassifikacija tekstur osnovnyh tipov oblachnosti po dannym MODIS s pomoshh’ju nechjotkih system. Sovremennye Problemy Distancionnogo Zondirovanija Zemli Iz Kosmosa, Vol. 14, Issue 5, 2017, p. 9-18.
-
Stancheva Jordanka Atlas Boleznej Sel'skohozjajstvennyh Kul'tur. T. 3, Bolezni Polevyh Kul’tur. Sofija, Moskva, 2003.
-
Barbedo Jayme Garcia Arnal Digital image processing techniques for detecting, quantifying and classifying plant diseases. SpringerPlus, Vol. 2, 2013, p. 660.
