Abstract
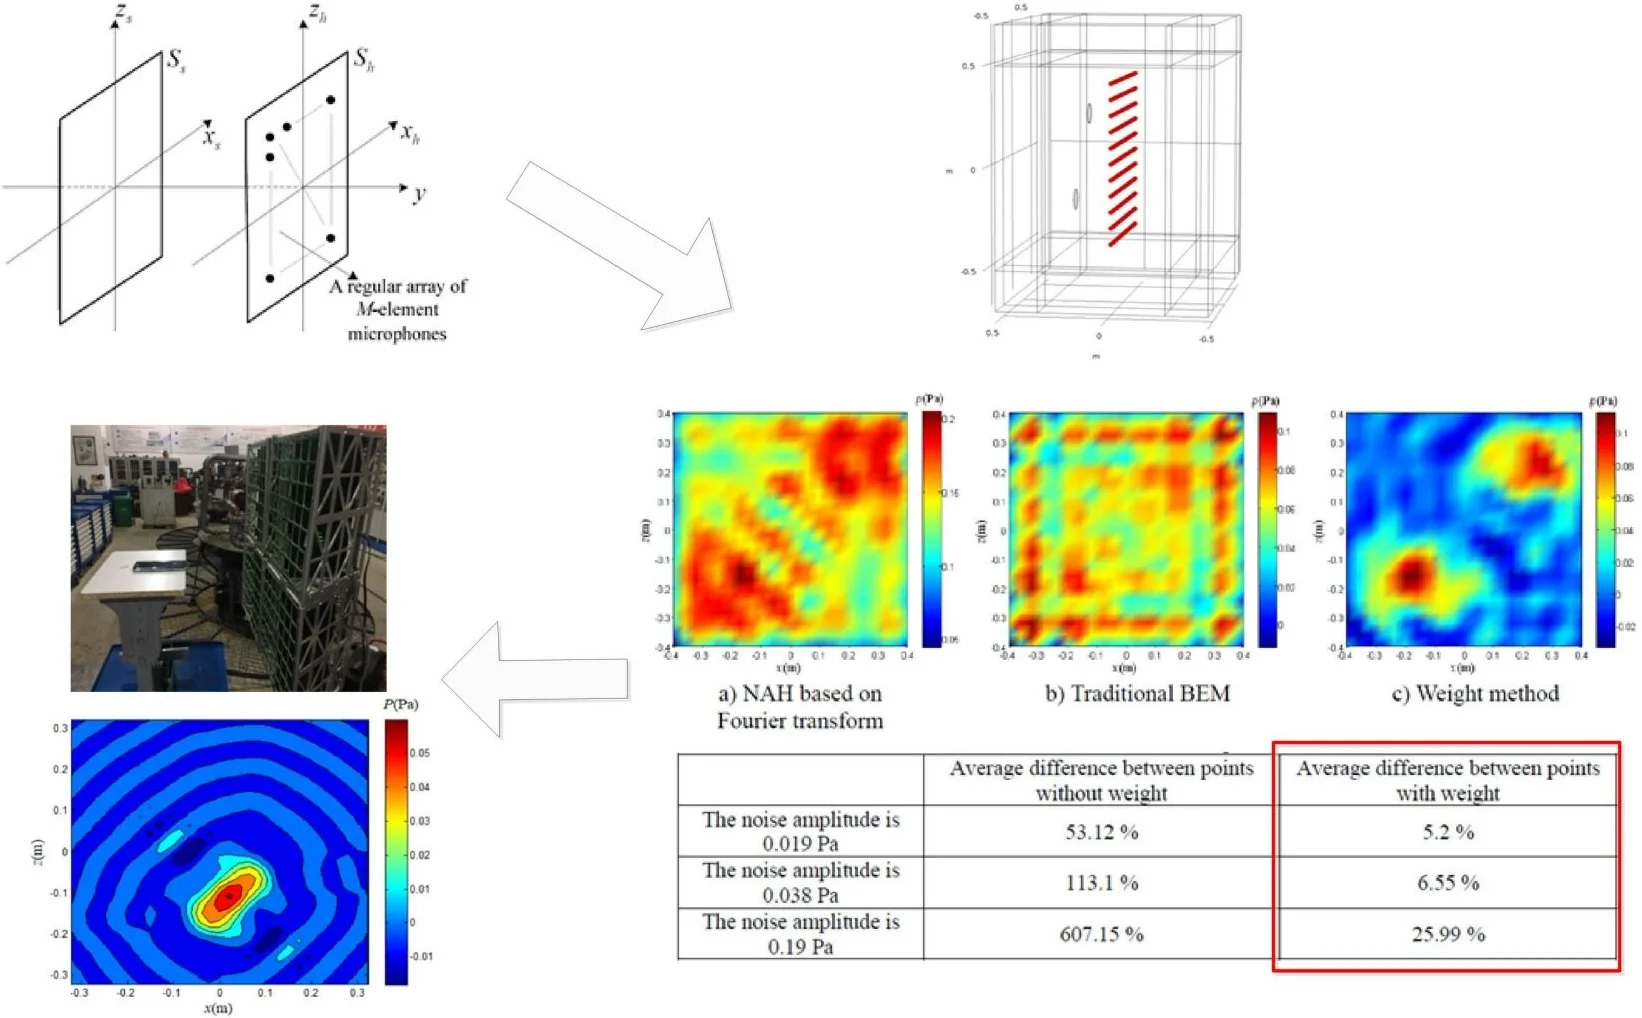
The mechanical noise in the cabin of the ship is so large that the leakage of high-pressure fluid is not easily noticed. In view of this situation, a near-field acoustic holography for high-frequency weak sound source under low signal-to-noise ratio is proposed. The method uses the empirical mode decomposition method to add weights to the time-domain sampling signals of each array element, and then uses the plane equivalent source near-field acoustic holography combined with compressive sensing to find the holographic surface acoustic pressure distribution. The simulation and experiment show that this method has certain feasibility under low signal-to-noise ratio, and the results are better than the method based on Fourier transform and the traditional boundary element method. It is of positive significance to apply it to engineering practice.
1. Introduction
In the cabin, the noise generated by high-pressure fluid leakage has high frequency, low sound pressure level, strong directionality, and rapid attenuation with the propagation distance, which is in line with the characteristics of high-frequency weak sound sources. The noise generated by other power devices and cabin vibrations in the cabin is very large. As a result, staff members often cannot perceive the appearance of high frequency and weak sound sources in time. Through acoustic imaging technology, we can know the distribution of sound field in a certain space and visually locate the noise sources. We can also monitor the operation status of the corresponding equipment and system. The existing acoustic imaging technology is mainly implemented by near-field acoustical holography (NAH) [1, 2].
Maynard et al. [3, 4]used spatial two-dimensional Fourier transform to realize sound field reconstruction and mature the acoustic holographic theory. Koopmann et al. [5, 6] proposed in 1989 that multiple equivalent sound sources could be used to replace the sound field generated by vibrating objects by wave superposition. In 2005, Jeon and Ih [7] further proposed the equivalent source method (ESM) to reconstruct the vibration sound field. With equivalent reconstruction accuracy, the ESM required fewer measurement points than the boundary element method (BEM). Yang Diange et al. [8] proposed a dynamic wave superposition method. This method effectively suppresses the side lobe effect in sound field reconstruction and solves the problem of false sound sources in moving sound source recognition. Candes [9] and Donoho et al. [10] formally put forward the concept of compressive sensing in 2006, and its application in various fields has continued to emerge [11, 12]. Gilles Chardon [13] first introduced compressive sensing theory into planar NAH in 2012, which verified the feasibility of this method. Matteo Kirchner [14] applied compressive sensing to NAH of cylindrical sound sources. Compared with traditional methods, this method could still obtain good imaging results while reducing the number of microphones used for measurement. However, the high-frequency weak sound source is still a problem in the field of noise source identification. The high-frequency weak sound source generally has a high frequency, a low sound pressure level, and has a low signal-to-noise ratio (SNR) and strong directivity. The traditional NAH that directly uses the microphone array cannot obtain effective recognition results.
In this paper, based on the characteristics of high-frequency weak sound sources and the distribution of sound sources in the plane, a NAH method for high-frequency weak sound sources under low SNR is proposed. This method combines empirical mode decomposition (EMD) method [15] and compressive sensing. The method has no strict restrictions on the shape of the measurement surface and the distribution of the measurement points. It can directly achieve sound pressure inversion of the sound source surface of a planar structure and has strong anti-noise capability. Perform simulation experiments and compare this method with NAH based on Fourier transform and traditional BEM. The obtained results show that this method can be used as an effective complement to the NAH for high-frequency weak sound sources under low SNR and has great application value.
2. Theoretical model and algorithm implementation
2.1. Plane equivalent source method near-field acoustic radiation calculation model
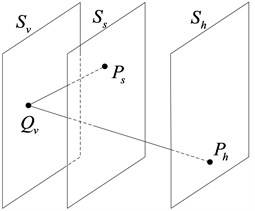
Setting the virtual sound sources on a plane, which has better convenience and versatility [16]. As shown in Fig. 1, Sh represents the measurement plane, Ss represents the sound source plane, Sv represents the virtual sound source plane, n represents the normal direction of the sound source outside the plane, Ph is the sound pressure distribution on the measurement plane, and Ps is the sound source plane Sound pressure distribution, Qv is the sound intensity of the virtual sound source.
Fig. 1A schematic diagram of plane ESM
The sound pressure distribution on the measurement surface can be represented by the following integral equation:
where rh is the position vector of a point on the measurement plane, rv is the position vector of a point on the virtual sound source plane, g(rh,rv) is the free space Green's function from the virtual point source to the measurement point, q(rv) is the virtual point sound source intensity, ρ is the medium density, c is the sound speed, and k is the wave number.
The sound pressure on the actual sound source surface can be expressed in the following form after being discretized:
where Ps is the sound source surface acoustic pressure column vector, Qv is the source strong column vector of the equivalent source sequence, and Gsv is the sound pressure matching matrix between the equivalent source sequence and the sound source surface:
where rs is the position vector of a point on the sound source plane.
Similarly, after the sound pressure on the measurement surface is discretized, it can be expressed as:
where Ph is the sound pressure column vector on the measurement surface, Qv is the source strong column vector of the equivalent source sequence, and Ghv is the sound pressure matching matrix between the equivalent source sequence and the measurement surface:
The inversion formula for the virtual source strength is:
Further, the sound pressure of the actual sound source surface can be expressed as:
The sound pressure transfer matrix from the sound source surface to the measurement surface is expressed as:
Get the sound pressure PS on the sound source surface:
Knowing L and Ph, the sound pressure distribution on any plane in the sound field can be reconstructed.
2.2. Array signal weight calculation
The definition of SNR is generally two kinds: one uses the energy or effective power of the original signal and the noise signal; the other is to use the effective values of the sound pressure of the original signal and the noise signal.
When the SNR of the sound array sampling signal is extremely low, not only the distribution of the sound field cannot be effectively obtained through the conventional NAH methods, but even misleading. In actual situations, the energy or sound pressure effective value of the original signal and the noise signal is often unknown, the SNR of the signal cannot be obtained, and the required weight value cannot be obtained. The EMD is used to analyze the signal obtained from each element sampling. The key to this method is the empirical mode decomposition. It can decompose the complex signal into a finite number of intrinsic mode functions (IMFs). Each IMF component contains characteristic signal of different time scales of the original signal. The basic idea can be summarized as: original waveform = ∑IMFs + after wave.
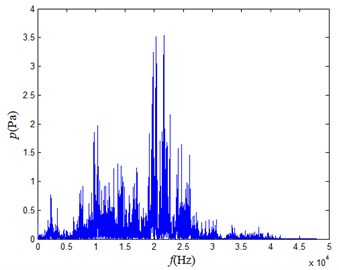
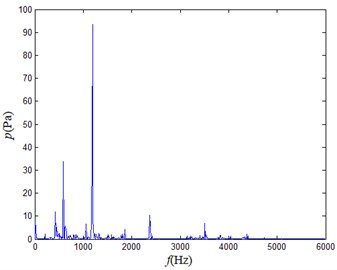
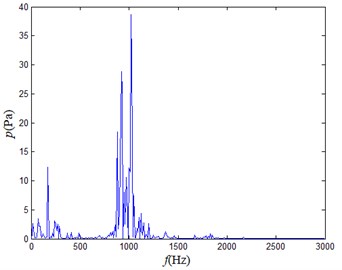
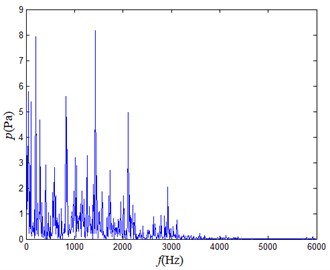
Take the example of the high-frequency acoustic signal generated by the gas leakage in an open building. The noise is generated by the motor gearbox pump system, the air compressor and the lathe operation. Perform spectrum analysis on the above audio signals to obtain the following figures.
Fig. 2Frequency domain diagram of each signal
a) Gas leakage
b) Motor gearbox pump system
c) Air compressor
d) Lathe
When the above audio signals are mixed and sampled, the gas leakage sound is assumed to be the original signal, and the audio signals generated by the motor gearbox pump system, the air compressor and the lathe can be regarded as the noises. The mixed signal is analyzed to obtain the following frequency domain diagram.
Fig. 3Frequency domain diagram of mixed signal
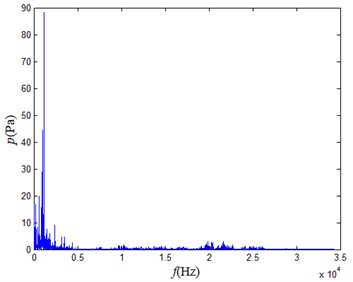
It can be seen from each frequency domain diagram that only the frequency of the main component of the noise generated by the gas leakage is higher than 5 kHz, so the high-frequency noise in the mixed noise greater than 5 kHz can be regarded as the noise generated by the gas leakage. The high frequency part only occupies a part of the mixed signal. If the mixed signal is not preprocessed, the signal obtained by the array element measurement will have a lower SNR. Therefore, the signal can be pre-processed and multiplied by a weight α, which takes a value between 0 and 1, which is proportional to the proportion of the high-frequency portion in this signal. This process can improve the resolving power of the array and improve the positioning accuracy of high frequency weak sound sources [17].
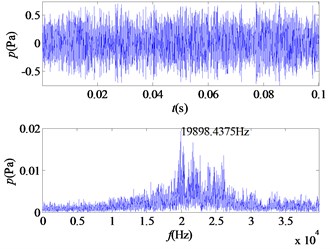
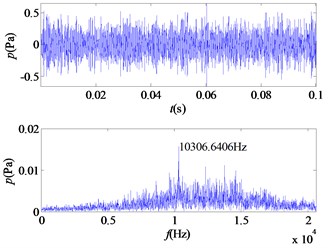
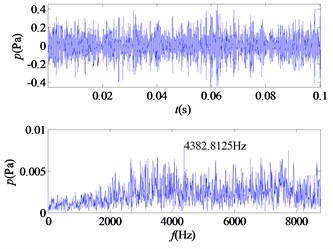
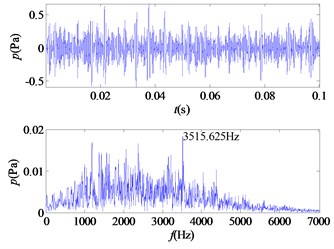
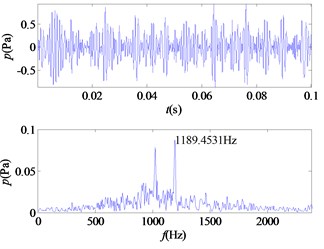
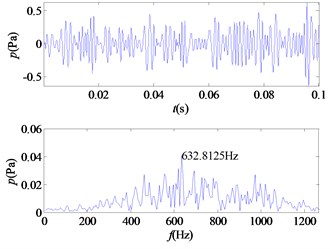
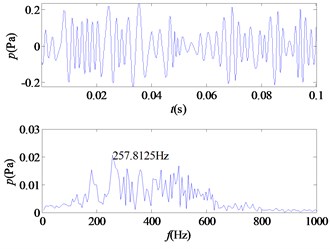
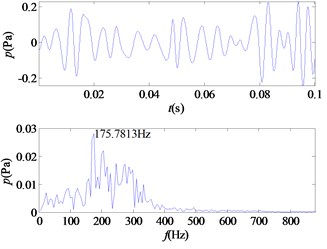
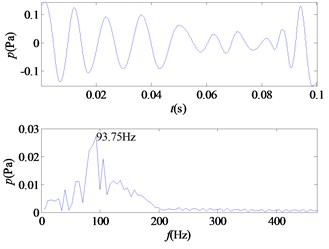
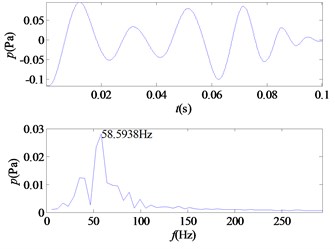
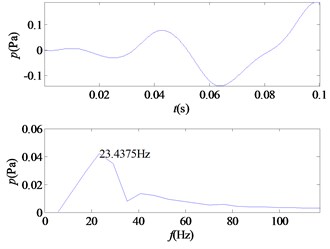
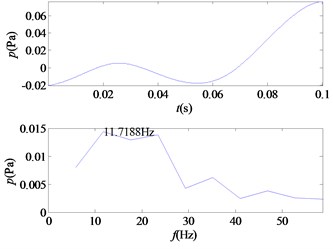
Using the EMD for this mixed signal, a limited number of IMF components are obtained. The result is shown in the following diagrams.
Fig. 4The time-frequency diagrams of IMF components
a) IMF1
b) IMF2
c) IMF3
d) IMF4
e) IMF5
f) IMF6
g) IMF7
h) IMF8
i) IMF9
j) IMF10
k) IMF11
l) IMF12
From the time-frequency diagrams of each IMF component, it can be known that the high-frequency part of the mixed signal (f> 5 kHz) is mainly distributed in IMF1 and IMF2. In the frequency domain diagram, the larger the ordinate value, the greater the contribution of the signal portion representing this frequency in the component. The amplitude corresponding to each frequency point on the frequency domain diagram corresponding to each IMF component is accumulated, and a total of 12 values are obtained, and then it is determined whether the corresponding frequency of the main component of each component is greater than 5 kHz. In this signal, the main component of IMF1 and IMF2 corresponds to a frequency greater than 5 kHz. The 12 values obtained are accumulated as denominators, and the corresponding values of IMF1 and IMF2 are accumulated as molecules. The weight value required for the mixed signal is obtained, α= 0.5529, and the sound pressure value of the high frequency portion of the signal is obtained.
2.3. Sparse representation model of acoustic pressure array signals
Fig. 5 shows the microphone array signal sampling model. On the measurement plane Sh, there is a regular array of M-element microphones. The number of sound source points is usually limited, so the sound source points are sparsely distributed on the sound source surface Ss. The sound source surface Ss can be evenly divided into grid points so that the sound source points can be sparsely represented on the sound source surface [18].
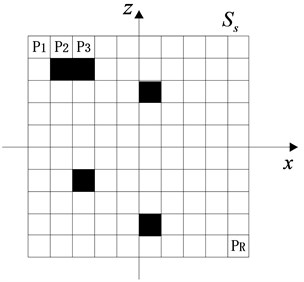
As shown in Fig. 6, the sound source surface Ss is divided into R areas. A solid area indicates that there is a sound source at that location, and a hollow area indicates that there is no sound source at that location.
The sound pressure signals received by the regularly distributed M-element microphone array are sparsely represented as:
In the formula, v is an M×1 dimensional matrix, which represents the signal received by the measuring surface microphone array. A is an M×R dimensional matrix that represents the sensing matrix. u is an R×1 dimensional matrix and represents a sound source signal containing position information, of which there are only N(N≪R) non-zero values. θ is the received noise signal.
Fig. 5Microphone array signal sampling model
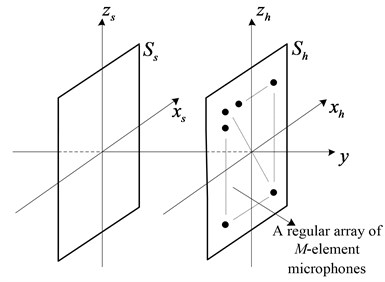
Fig. 6Sound source surface sparse representation
2.4. A plane equivalent source near-field acoustic holography combining compressive sensing
The actual number and distribution of sound sources are often sparse relative to the space plane to be measured, which is in accordance with the requirements for signal sparsity in compressive sensing theory. Choosing the appropriate observation matrix can achieve sound source location under the condition of few measurement values [19]. In the planar equivalent source near-field acoustic radiation model, the virtual sound source surface Sv is discretized and is similar to the sparse representation model of the sound pressure matrix signal, so the two can be combined. The virtual sound source points are sparsely distributed on the virtual sound source plane. The transfer matrix in the plane ESM is directly used as a sensing matrix, and the matrix conforms to the Restricted Isometry Property (RIP) [20]. Firstly, the position of the virtual sound source on the virtual sound source surface is obtained by orthogonal matching pursuit (OMP) algorithm based on compressive sensing theory, and then the holographic surface sound pressure distribution is reconstructed in combination with the known transfer matrix. Due to the inconvenient calculation of the area of the small polygons of the non-uniform grid, a uniform grid is generally taken. In the plane rectangular coordinate system, the virtual sound source plane may be discretized into I×I uniform squares, and the microphones on the measurement surface may also be evenly spaced to facilitate calculation.
The sound pressure transfer matrix L from the virtual sound source plane to the holographic plane has been given by Eq. (8). This is the sensing matrix. Substituting it into Eq. (10) yields:
The presence of a noise signal will affect the accuracy of sound source localization, where θ is the noise signal, which is directly recorded by the measurement array, so Eq. (11) can be written as:
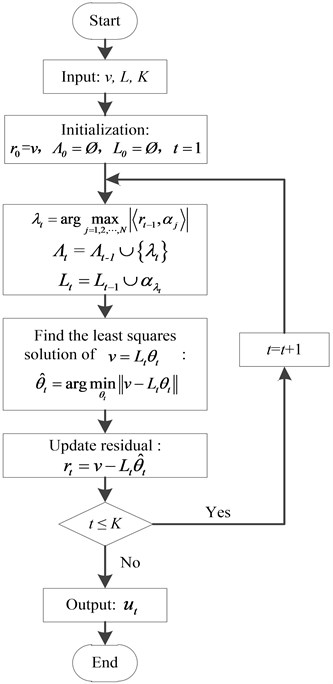
In the flow of the OMP reconstruction algorithm [21, 22]: rt indicates residual, t indicates the number of iterations, Ø indicates an empty set, Λt indicates the index (column number) found by the tth iteration, aj indicates the jth column of the matrix L, Lt represents the set of columns of the matrix L selected by the index Λt (as a matrix of M×t), θt is a column vector of t×1, K is the sparsity of the signal. The process is shown in Fig. 7.
The specific flow is as follows:
(1) Initialization: r0=v, Λ0=Ø, L0=Ø, t= 1.
(2) Find the index λt so that: λt=argmaxj=1,2,⋯,N|⟨rt-1,αj⟩|.
(3) Order: Λt=Λt-1∪{λt}, Lt=Lt-1∪αλt.
(4) Find the least squares solution of v=Ltθt: ˆθt=argminθt‖v-Ltθt‖.
(5) Update residual: rt=v-Ltˆθt.
(6) If t≤K, returns to step (2), t=t+1, otherwise stop iterating into step (7).
(7) Obtain the estimated value of the original signal ut.
After finding the sound source plane information u' with sparse information and knowing the transfer matrix L, the holographic plane sound pressure distribution map of any near-field plane with the distance d can be obtained from Eq. (13):
Fig. 7The process of OMP reconstruction algorithm
3. Simulation analysis
3.1. Discs vibration model
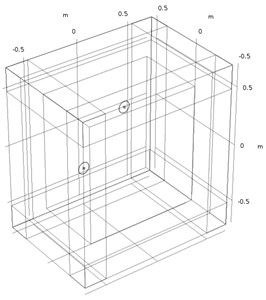
Using Comsol simulation software, two metal discs excited by high-frequency points were set up to simulate the sound field distribution caused by high-frequency vibration. Both discs have a radius of 0.05 m and a thickness of 0.005 m. Both materials are alloy structural steels. The central axis of the two discs is parallel to the y-axis, and the two discs are equally distributed along the y-axis. The coordinates of the center of the discs distributed on the x-z plane are (0.2, 0.2) and (–0.2, –0.2), as shown in Fig. 8(a). A sinusoidal excitation force of F=5sin(6000πt)+5 is applied at the same time in the center of the two metal discs and the unit is Newton. A fixed constraint is applied around the two metal discs to simulate the sound field distribution produced by the high frequency sound source.
A cuboid free sound field space of 0.6 m×1 m×1 m is established, and a perfect matching layer with a thickness of 0.2 m is added around. The presence of a perfect matching layer allows incident sound waves to pass through the interface without reflection, so that no reflected wave interference occurs. The airspace is divided by using a more refined free-splitting tetrahedral mesh, and the two metal discs are divided by a regular free-splitting tetrahedral mesh. Matlab is used to write related programs, and the data obtained by simulation is used to perform operations.
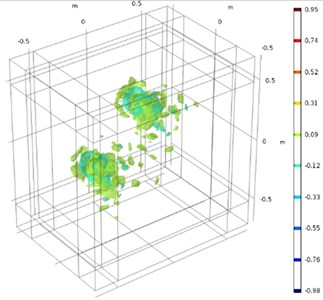
The frequency of the sound source for this simulation is set at 3 kHz. Fig. 8(b) shows the distribution of sound pressure isosurfaces in the space at time t= 0.2 s.
Fig. 8Sound field
a) Sound field three-dimensional model
b) Sound pressure isosurface distribution (t= 0.2 s)
3.2. Sound field holographic simulation imaging analysis
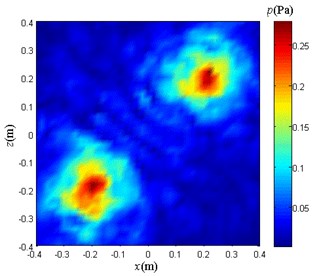
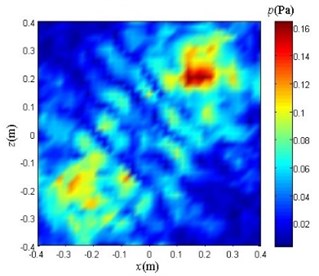
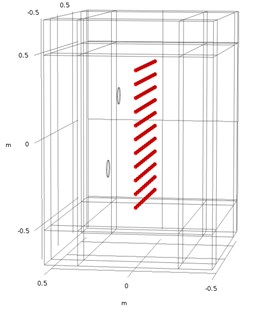
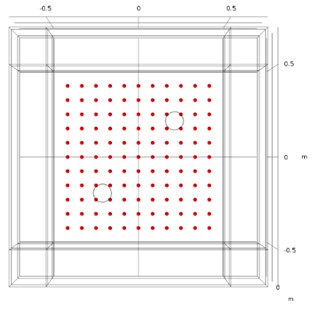
Set two planes, 0.1 m and 0.2 m away from the metal discs. The sound array samples a signal of 0.005 s duration. Calculate the obtained data to obtain the ideal sound pressure distribution of the two planes as shown in Fig. 9(a) and Fig. 9(b). Using an acoustic array formed by 11×11 uniformly arrayed elements, the sound pressure distribution shown in Fig. 9(b) is sampled, as shown in Fig. 10(a) and Fig. 10(b).
Fig. 9Sound pressure distribution maps
a) Distance 0.1 m
b) Distance 0.2 m
Fig. 10Microphones arrangement diagram
a)
b)
Acoustic array sampling is performed in the time domain. Each microphone samples a signal for a certain period of time. Selecting a microphone in the sound array, the sound pressure changes of the signal sampled in the time domain is shown in Fig. 11. It can be seen from the figure that the change in sound pressure at this point tends to be stable after 0.4 s. Therefore, the following are selected after the 0.4 s data calculation.
Fig. 11Time-domain map of a single element signal
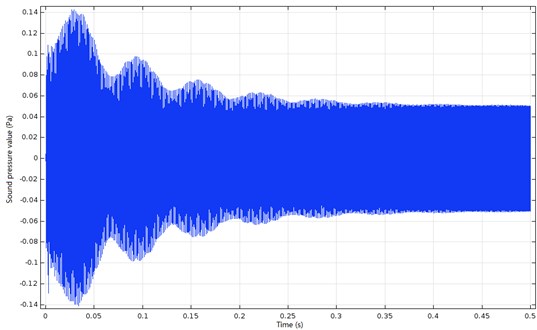
The acoustic array is used to sample the sound pressure in the 0.2 m plane from the metal discs in the time domain. The signal durations of all microphones are 0.005 s. The time domain signals obtained by sampling are calculated to obtain the sound pressure values of 121 points.
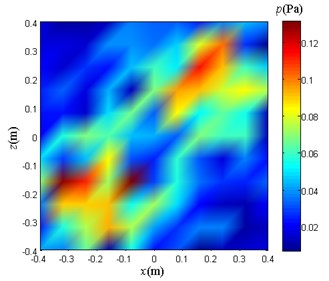
Set the virtual sound source plane on the actual sound source plane and evenly divide it into 11×11 grids. Uniformly divide the holographic surface into 21×21 grids for sound pressure reconstruction. The acoustic array on the measuring plane 0.2 m from the discs. The sound pressure distribution obtained by sampling is shown in Fig. 12(a).
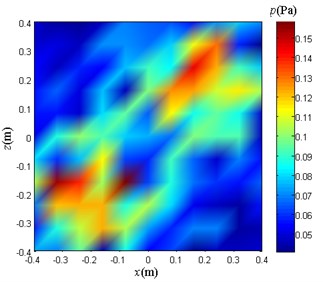
In the actual ship cabin, most of the noises come from low-frequency noises generated by regular vibrations of other types of equipment or systems, and the noise sources that emit noise are relatively far away from the measurement surface and can be regarded as far-field sound sources. When the noise reaches the measurement plane, it can be approximated as a plane wave, so the noise on the acoustic array plane can be regarded as evenly distributed on each sampling point. Analog noise interference requires the addition of 0.005 s duration noise to the data at each sample point. The sampled values on the measurement surface are calculated, and the average sound pressure amplitude of each sampling point is 0.038 Pa.
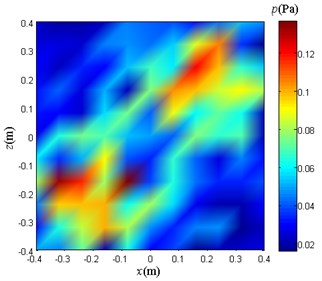
Fig. 12Sound pressure sampling data with different noise in the measurement plane
a) Noiseless
b) The noise amplitude is 0.019 Pa
c) The noise amplitude is 0.038 Pa
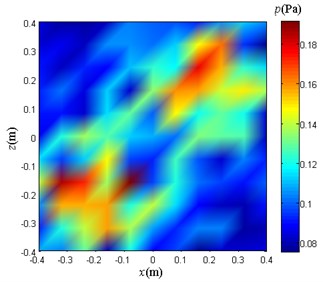
d) The noise amplitude is 0.19 Pa
The experiment is divided into three groups and each group is added with different noise signals. The specific conditions are:
(1) The adding duration is 0.005 s, and the expression is the noise signal of:
(2) The adding duration is 0.005 s, and the expression is the noise signal of:
(3) The adding duration is 0.005 s, and the expression is the noise signal of:
On the measuring surface of 0.2 m from the discs, three sampled sound pressure distribution diagrams as shown in Fig. 12(b), Fig. 12(c) and Fig. 12(d) are obtained. From the comparison of the above diagrams, it can be seen that there is no significant difference in the visual comparison of the graphs. The main difference is that the range of sound pressure values is different.
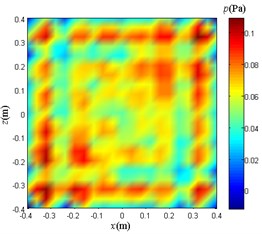
When the noise is added to the case (1), the 0.1 m plane sound pressure reconstruction is performed using the NAH based on Fourier transform, the traditional BEM, and the method proposed in this paper. In the following text, the method proposed in this paper is simply referred to as weight method. The results obtained are as follows.
Fig. 13Sound pressure reconstruction maps
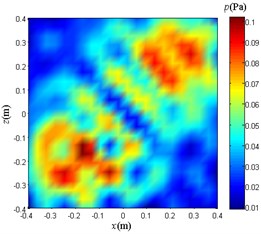
a) NAH based on Fourier transform
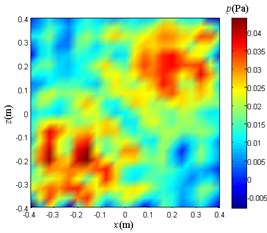
b) Traditional BEM
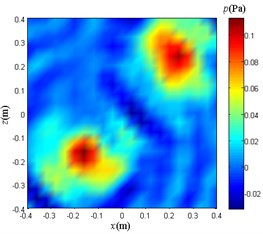
c) Weight method
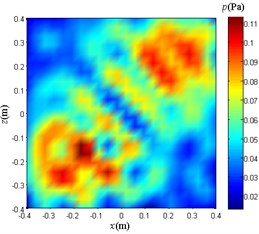
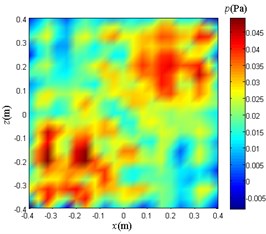
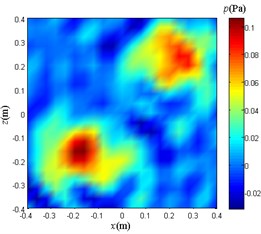
When the noise is added to the case (2), the 0.1 m plane sound pressure reconstruction is performed using the NAH based on Fourier transform, the traditional BEM, and the weight method. The results obtained are as follows.
Fig. 14Sound pressure reconstruction maps
a) NAH based on Fourier transform
b) Traditional BEM
c) Weight method
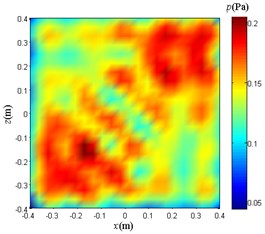
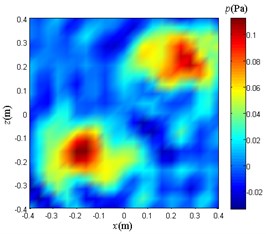
When the noise is added to the case (3), the 0.1 m plane sound pressure reconstruction is performed using the NAH based on Fourier transform, the traditional BEM, and the weight method. The results obtained are as follows.
Fig. 15Sound pressure reconstruction maps.
a) NAH based on Fourier transform
b) Traditional BEM
c) Weight method
3.3. Results and discussion
In this simulation experiment, three groups of experiments are performed, and each group uses three different sound pressure reconstruction methods. In the three groups of experiments, the average SNR of the sampled signals is 6.02 dB, 0 dB, and –13.98 dB, respectively. When the SNR is zero or negative, it indicates that the signal power is less than the noise power, and the noise is so large that the original signal is submerged.
Under the condition that the noise signal expression is added as:
Compare and analyze Fig. 13. The reconstruction sound pressure distribution obtained by using only the weight method is in good agreement with Fig. 9(a), and the number and location of sound sources can be clearly distinguished. The effect of the reconstruction sound pressure distribution map obtained by the NAH based on Fourier transform and the traditional BEM is not ideal, and only the area where the sound source point is located can be roughly determined, and the number of sound sources cannot be clearly distinguished.
Under the condition that the noise signal expression is added as:
Compare and analyze Fig. 14. The reconstruction sound pressure distribution of each method is basically the same as when the noise signal expression is added as:
Under the condition that the noise signal expression is added as:
Compare and analyze Fig. 15. The reconstruction sound pressure distribution obtained by using only the weight method is in good agreement with Fig. 9(a), and the number and location of sound sources can be clearly distinguished. The reconstructed sound pressure distribution map obtained by adopting the NAH based on Fourier transform and the traditional BEM is greatly affected by the noise at this time, and no longer has a reference value for locating the sound source.
The reason for obtaining the above results is that the NAH based on Fourier transform and the traditional BEM do not perform the high-frequency signal extraction processing on the sampled signals, so that the data used for the subsequent operations contain strong noise interference. The weight method uses the EMD to analyze and process the signals of each sample point. In order to extract the high frequency part of the sampled signal, the weight multiplied by each point is calculated. Therefore, under the same conditions, the weight method is more effective than the NAH based on Fourier transform and the traditional BEM in the localization and sound pressure distribution reconstruction of high-frequency weak sound sources.
Compared with the non-weighted value, the sampled signal multiplied by the weight is closer to the ideal situation without noise. When the noise is added, the weighted value of the sampling signal and the non-weighted sampling signal are respectively compared with the ideal value without noise, and the calculation formula is as follows:
Ph(i) is the actual sound pressure value measured at each measurement point on the measurement plane 0.2 m away from the plane where the sound source is located. Pf(i) is the theoretical sound pressure value when no interference noise is added on the corresponding plane. Ph(i) and Pf(i) each have 121 values. Eq. (14) is now used to quantify the difference in weighting power. Three sets of simulation experiments are performed. The results of the calculations are shown in the following table:
Table 1Difference comparison
Average difference between points without weight | Average difference between points with weight | |
The noise amplitude is 0.019 Pa | 53.12 % | 5.2 % |
The noise amplitude is 0.038 Pa | 113.1 % | 6.55 % |
The noise amplitude is 0.19 Pa | 607.15 % | 25.99 % |
It can be seen from Table 1. After multiplying the weights, the data at each measurement point is closer to the ideal sound pressure value when there is no interference noise. Therefore, the sound pressure reconstruction map obtained by the weight method under low SNR conditions is closer to the actual situation.
From Fig. 13(c), Fig. 14(c), and Fig. 15(c), it can also be seen that the distribution of the sound source by the weight method is close to the actual situation, but there is a certain gap between the sound pressure distribution value and the actual situation. The reason for this situation is that the modal aliasing phenomenon exists in the EMD itself. This phenomenon can lead to the inability to separate out different modality components according to the feature scale, and the existing IMF contains different time scale components. Therefore, the weights calculated by the EMD are not accurate enough, so that the sound pressure data at each sampling point after multiplying the weights still has a certain gap with the ideal noise-free noise, and the larger the interference noise, the more obvious the gap. Ultimately, the sound pressure values at the points on the resulting sound pressure distribution reconstruction map are not accurate enough.
4. Experimental verification
4.1. Composition of the experimental system
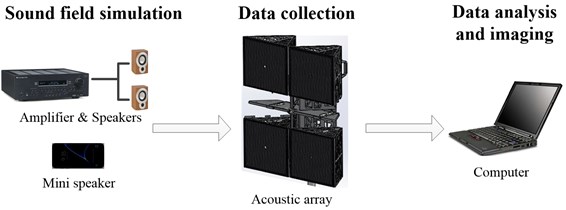
The specific composition of the experimental system is shown in Fig. 16. The power amplifier and the speakers produce a sound field environment with a low signal-to-noise ratio, the sound array performs data acquisition, and the computer calculates and analyzes the data to finally obtain an imaging result.
Fig. 16Experimental system composition
4.2. Experiment procedure
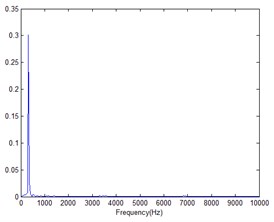
The experimental site is located in an empty, quiet room. The two speakers are placed 3 m in front of the sound array. The spectrum of the noise played by the speakers is shown in Fig. 18(a). The main frequency is around 320 Hz. r is the measurement distance, d is the sound array aperture, f is the sound source frequency, and c is the sound speed. When f>cr/2d2, the sound source can be studied as a near-field sound source. For the two speakers, it is known that r= 3 m, d= 0.635 m, c= 340 m/s, then the sound source frequency needs to satisfy f > 1265 Hz, which can be used as a near-field sound source. Obviously 320 Hz is not in this range. Therefore, the two speakers playing audio can be regarded as far-field noise with respect to the microphone elements on the sound array. The microphone at the center of the array measures the noise level of the noise produced by the two speakers at a certain moment of 62 dB.
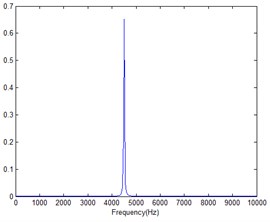
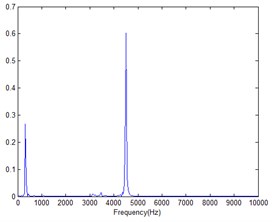
The mini speaker is used as the target sound source, and the position is 0.2 m from the sound array. The specific placement is shown in Fig. 17. It plays 4500 Hz noise audio. The spectrum of the audio is shown in Fig. 18(b). At this time, the sound pressure level of the audio played by the mini speaker is 53.2 dB at the center of the array. The signal-to-noise ratio of the signal sampled by the microphone at the center of the array is calculated as a negative value, which can be regarded as a low SNR condition.
Fig. 17Equipments placement
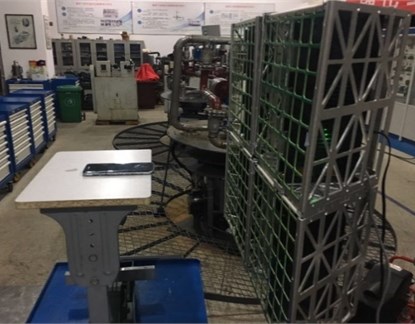
Fig. 18Spectrograms
a) Speaker
b) Mini speaker
c) Mixed noise
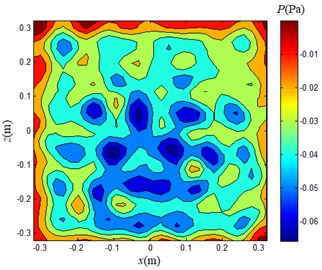
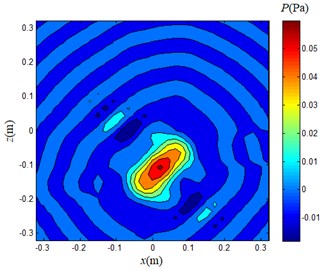
Considering that the traditional BEM is not effective in the simulation, it is not verified here. The array acquisition data was calculated by Fourier transform method and weight method respectively, and the sound pressure inversion is performed on a plane with a frequency of 4500 Hz at a distance of 0.1 m from the array. Considering that the mini speaker aperture is small, it is better to select the smaller value of the sparsity K in the weight method, so K= 4 is selected.
Fig. 19Inversion sound pressure distribution map (d= 0.1 m, f= 4500 Hz)
a) Fourier transform method
b) Weight method
5. Conclusions
The mechanical noise in the cabin of the ship is so large that the leakage of high-pressure fluid is not easily noticed. In view of this situation, a NAH method for high-frequency weak sound source under low SNR is proposed. And using the three-dimensional sound field model, this method is compared with NAH based on Fourier transform and traditional BEM. And carrying out an actual experimental verification. The relevant conclusions are obtained as follows:
1) With this method, the virtual surface does not need to be conformal to the actual sound source surface, and the calculation process is more convenient and more versatile. The meshing can be uniform or non-uniform, and its applicability is more flexible.
2) Under low SNR conditions, this method reconstructs the sound pressure distribution on the holographic surface, and the reconstruction effect is obviously better than the other two methods. This method can better locate high frequency weak sound sources.
The method proposed in this paper can be used as an effective complement to the NAH for high-frequency weak sound sources under low SNR conditions. It is of positive significance to apply it to engineering practice.
References
-
Williams E. G., Maynard J. D., Skudrzyk E. Sound source reconstructions using a microphone array. Journal of the Acoustical Society of America, Vol. 68, Issue 1, 1980, p. 340-344.
-
Williams E. G., Maynard J. D. Holographic imaging without the wavelength resolution limit. Physical Review Letters, Vol. 45, Issue 7, 1980, p. 554-557.
-
Maynard J. D., Williams E. G., Lee Y. Nearfield acoustic holography: I. Theory of generalized holography and the development of NAH. The Journal of the Acoustical Society of America, Vol. 78, Issue 4, 1985, p. 1395-1413.
-
Veronesi W. A., Maynard J. D. Nearfield acoustic holography (NAH) II. Holographic reconstruction algorithms and computer implementation. Journal of the Acoustical Society of America, Vol. 81, Issue 5, 1987, p. 1307-1322.
-
Koopmann G. H., Song L., Fahnline J. B. A method for computing acoustic fields based on the principle of wave superposition. Journal of the Acoustical Society of America, Vol. 86, Issue 6, 1989, p. 2433-2438.
-
Song L., Koopmann G. H., Fahnline J. B. Numerical errors associated with the method of superposition for computing acoustic fields. Journal of the Acoustical Society of America, Vol. 89, Issue 6, 1991, p. 2625-2633.
-
Jeon I. Y., Ih J. G. On the holographic reconstruction of vibroacoustic fields using equivalent sources and inverse boundary element method. Journal of the Acoustical Society of America, Vol. 118, Issue 118, 2005, p. 3473-3482.
-
Yang Diange, Li Bing, Wang Ziteng, et al. Dynamic wave superposition method for moving sound sources. Acta Physica Sinica, Vol. 61, Issue 5, 2012, p. 054306, (in Chinese).
-
Donoho D. L. Compressed sensing. IEEE Transactions on Information Theory, Vol. 52, Issue 4, 2006, p. 1289-1306.
-
Candès E. J., Romberg J. K., Tao T. Stable signal recovery from incomplete and inaccurate measurements. Communications on Pure and Applied Mathematics, Vol. 59, Issue 8, 2005, p. 1207-1223.
-
Willett R. M., Gehm M. E., Brady D. J. Multiscale reconstruction for computational spectral imaging. Proceeding SPIE, Vol. 6498, 2007, https://doi.org/10.1117/12.715711.
-
Giacobello D., Christensen M. G., Murthi M. N., et al. Retrieving sparse patterns using a compressed sensing framework: applications to speech coding based on sparse linear prediction. IEEE Signal Processing Letters, Vol. 17, Issue 1, 2010, p. 103-106.
-
Chardon G., Daudet L., Peillot A., et al. Near-field acoustic holography using sparse regularization and compressive sampling principles. Journal of the Acoustical Society of America, Vol. 132, Issue 3, 2012, p. 1521.
-
Kirchner M., Nijman E. Nearfield acoustical holography for the characterization of cylindrical sources: practical aspects. International Styrian Noise, Vibration and Harshness Congress: The European Automotive Noise Conference, 2014.
-
Norden Huang E., Zheng Shen, Long Steven R., et al. The empirical mode decomposition and the Hilbert spectrum for nonlinear and non-stationary time series analysis. The Royal Society, Vol. 454, Issue 1971, 1998, p. 903-995.
-
Bi Chuanxing, Chen Xinzhao, Chen Jian, et al. Near-field acoustic holography based on equivalent source method. Science China Technological Sciences, Vol. 35, Issue 5, 2005, p. 535-548, (in Chinese).
-
Qian Zhenglian, Yang Yichun, Yu Lizhi, et al. Identification and location of acoustic on high frequency weak noise sources with a microphone array. Acta Acustia, Vol. 40, Issue 1, 2015, p. 90-96, (in Chinese).
-
Shi Jie, Yang Desen, Shi Shengguo, et al. Compressive focused beamforming based on vector sensor array. Acta Physica Sinica, Vol. 65, Issue 2, 2016, p. 190-200.
-
Baraniuk R. G. Compressive Sensing [Lecture Notes]. IEEE Signal Processing Magazine, Vol. 24, Issue 4, 2007, p. 118-121.
-
Zhang B., Cheng X., Zhang N., et al. Sparse target counting and localization in sensor networks based on compressive sensing. Proceedings – IEEE Infocom, Vol. 2, Issue 3, 2011, p. 2255-2263.
-
Ning Fangli, Wei Jingang, Liu Yong, et al. Study on sound sources localization using compressive sensing. Journal of Mechanical Engineering, Vol. 52, Issue 19, 2016, p. 42-52, (in Chinese).
-
Tropp J. A., Gilbert A. C. Signal recovery from random measurements via orthogonal matching pursuit. IEEE Transactions on Information Theory, Vol. 53, Issue 12, 2007, p. 4655-4666.

