Abstract
Human-induced vibration has become a serious serviceability problem due to the larger opening of girder, lighter floor systems and longer spans designed and used in practice. Vibration tests were undertaken in laboratory to research the vibrational characteristics of the arch pre-stressed concrete truss (APT) system spanning 16.0 m. Results from ambient vibration, impulse excitations (heel-drop and jumping) and steady-state incentives (walking and running) were presented. Dynamic characteristics such as natural frequencies, damping ratios, mode shapes and acceleration responses were studied and checked against the existing codes. Experimental results show that the investigated APT girder possesses high fundamental frequency and low damping ratio. Moreover, the perception factors based on the root-mean-square acceleration, vibration dose value (VDV) and psychological comfort data were obtained. Lastly, the threshold accelerations and VDVs were suggested for evaluating the human-induced vibration.
1. Introduction
The developed large-span arched prestressed concrete truss (APT) girder [1] is a modern efficient structural form that combines a reinforced concrete (RC) arch, the RC floor and prestressed concrete (PC) truss, which consists of RC upper chord, PC lower chord, RC webs (Fig. 1). The large web openings can accommodate for pipelines such as heating ventilating and air conditioning pipes, water supply pipes and electric/network cables [2]. This arrangement can eliminate a significant amount of dead space, but requires a more compact and economical design including the vibration assessment, the structural calculation and other considerations. This paper mainly focuses on the vibration serviceability evaluation of this APT structure.
Fig. 1Schematic diagram of the APT

It appears that for long or light structures the vibration serviceability issue due to human activity has become a greater concern. Previous studies on building vibration serviceability including composite double-tee floors [3], wood floors [4], RC floors [5], steel-framed floor with long-span metal deck [6], etc. accelerate the development of vibration serviceability criteria. In reviewing the related ones, there have been many codes or standards focused on this kind of problems. For example, ISO 2631 [7] considers two different methods for assessing the vibrations. First, the health risks predicted by the root-mean-square (RMS) and maximum transient vibration value (MTVV) have been discussed in [1]. Second, the vibration is evaluated by the vibration dose value (VDV) which is more sensitive to peaks due to the fourth power of the acceleration. However, the ISO 2631 does not provide acceptable limits for the VDV.
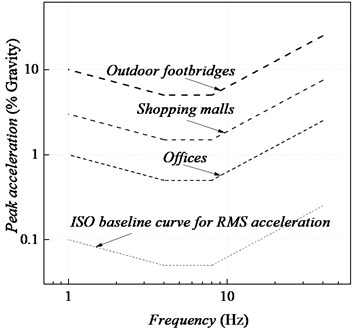
For RMS evaluation, the widely used criteria ISO 2631 [7] and AISC design guide # 11 [8] suggest the limits in term of RMS acceleration as a multiple of the baseline. The multipliers range from 10 for offices to 100 for outdoor footbridges, as shown in Fig 2. For offices, ISO 2631 recommends a multiplier of 4 for continuous or intermittent vibrations and multiplier of 60 to 128 for transient vibrations.
Fig. 2International standards association scale
As indicated in the previous section, peak and RMS accelerations have limitations for vibrations when the effect on humans is of concern. The key problem is that these measures do not consider the vibration duration as it is logical to expect that the building vibration tends to become more unacceptable the longer it lasts. As this type of vibration is typically not stationary the averaging methods such as RMS and MTVV, which depend on the vibration duration but do not necessarily increase with duration, may not provide reliable results. However, it has been overcome by the introduction of the VDV. Researchers have evaluated floor systems [9, 10] by VDV. Recommendations were made by Ellis and Littler and refined by other researcher, as listed in Table 1.
Table 1The VDV threshold/region corresponding to low probability of discomfort
Researchers | Event VDV (mm/s1.75) |
Ellis and Littler [11] | 660-2380 |
Salyards, Hanagan and Trethrwey [12] | 1400-4800 |
Casagrande, Giongo, Pederzolli, et al. [13] | 400 |
Setareh [14] | 1200 |
The purposes of this experimental study on APT were to evaluate the vibration behavior of such structure caused by human activities (i.e., heel-drop, jumping, walking and running) and to check its vibration performance against the current design specifications. The objectives of this research are summarized as follows:
(1) Analyze the main characteristics by sampled acceleration traces under both various human impacts and ambient vibration.
(2) Compare the results from the impulsive heel-drop and jumping loads and the walking and running excitations with the available vibration perception criteria.
(3) Study and propose the ARMS, and MTVV threshold values for different human activities corresponding to the perception factor = 3 (distinctly perceptible but can be acceptable).
(4) Compare and propose VDV threshold values for different human activities corresponding to low probability of discomfort.
2. Dynamic testing
A number of dynamic tests were conducted on the APT structure. They included different impact testing (heel-drop, jumping, walking and running) and ambient vibration testing of the structure.
2.1. Description
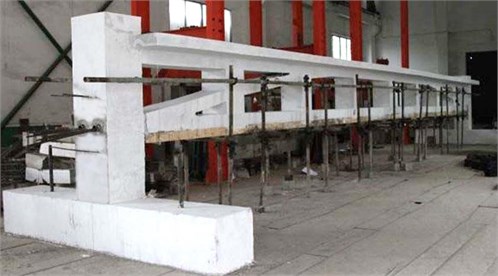
To evaluate and control the excessive vibration on the APT girder under human activities, experimental tests are the most expensive and complicated but the most reliable way to determine the dynamic properties. Therefore, the vibration tests were carried out and the APT girder considered in this study is 16 m long consisting of the RC floor of 120 mm thick by 1200 mm wide and 7 RC webs spaced at 2 m, as shown in Fig. 3. The upper RC chords (of 270 mm height and 400 mm width), the RC arch members and lower PC chords (both of 150 mm height and 400 mm width), the RC web members (of 200/300/400 mm×400 mm), and the RC columns (500 mm×500 mm) were casted in the Chongqing University Structural Research Laboratory. The detailed main cross sections and material properties will not be repeated here because of the limitation of space. For more details, please see paper [1].
Fig. 3Typical photo view of the APT specimen
2.2. Monitoring system
The monitoring system employed in this study consists of eleven symmetrically arranged DH610V accelerometers with a range of ±5g (g is gravitational acceleration), one DH 5922N data acquisition system, and one Thinkpad T440 notebook, as shown in Fig. 4.
Fig. 4Monitoring system and accelerometer location (mm)
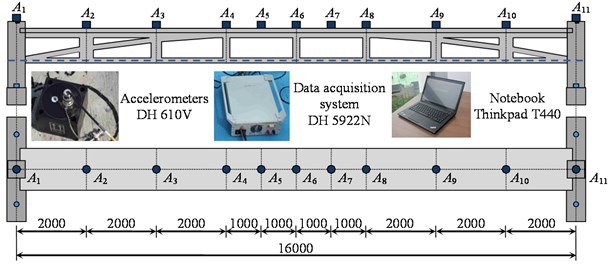
These accelerometers were placed along the axis of this APT girder spacing at 1000 mm near the mid-span and 2000 mm at the girder ends. The data acquisition system was used to sample all the data collected from these eleven accelerometers at 1000 Hz. The notebook was employed to control the data acquisition system, and more importantly, to storage and analyze the data transferred from the DH 5922N.
2.3. Test method
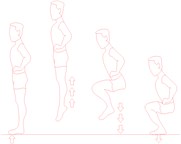
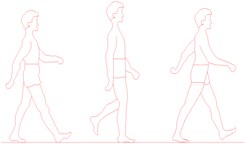
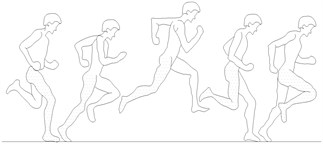
Experimental research is considered as a good way to determine the floor vibration properties. The transient activities carried out in this study include classic heel-drop and jumping impacts. The approximate height off the floor was kept at 80 mm for the heel-drop and 450 mm for the jumping. To clear the vibration performance of this APT girder under the steady-state excitation, the field ambient vibration test, walking and running tests were conducted (Fig. 5). Note that the total duration for each steady-state excitation was controlled longer than 20 seconds.
Fig. 5Human activities: a) heel-drop, b) jumping, c) walking, d) running

a)
b)
c)
d)
Each kind of impact was imposed on the APT girder on which 11 testers with different weights were considered (Table 2). These weights are representative of Chinese with an average of 63.13 kg which is much lighter than that of occidental. Therefore, it would be interesting to check whether the existing vibration criteria are suitable in China or elsewhere. The accelerometers were glued at the top of the APT specimen (Fig. 4) and all testers were required to stand near the accelerometers accordingly. During each kind of impact, tester S6 stood at Position A6 (Table 3) at the beginning of the test. Each tester’s position was altered 11 times, producing 121 (= 11×11) measurement data (Table 3). Due to the limitations of test conditions, there are only 11 different testers who gave their feelings on different vibration. However, a total of 1320 perception factors were recorded, and the results show good for statistical evaluations. Moreover, this study is a primary exploration and further research and improvement will be carried out.
Table 2Information for the testers
Tester No. | S1 | S2 | S3 | S4 | S5 | S6 | S7 | S8 | S9 | S10 | S11 |
Weight (kg) | 73.90 | 56.80 | 74.80 | 66.30 | 64.90 | 50.80 | 56.10 | 62.50 | 54.40 | 54.50 | 79.40 |
Gender | Male | Male | Male | Male | Male | Female | Male | Female | Female | Male | Male |
In each position change, the impacts were imposed at Position A6 (mid-span) by the 11 testers for three repeated times, giving 66 (= 2×11×3) acceleration histories at each accelerometer for each position change. For each impact load, there were 363 (= 11×3×11) trials involved. A grand total of 1452 (= 4×363) trials were recorded.
Table 3Locations of the testers
No. of test | Acceleration position Ai (i= 1, 2, …, 11) and tester number Sj (j= 1, 2, …, 11) | ||||||||||
A1 | A2 | A3 | A4 | A5 | A6 | A7 | A8 | A9 | A10 | A11 | |
1 | S1 | S2 | S3 | S4 | S5 | S6 | S7 | S8 | S9 | S10 | S11 |
2 | S11 | S1 | S2 | S3 | S4 | S5 | S6 | S7 | S8 | S9 | S10 |
3 | S10 | S11 | S1 | S2 | S3 | S4 | S5 | S6 | S7 | S8 | S9 |
4 | S9 | S10 | S11 | S1 | S2 | S3 | S4 | S5 | S6 | S7 | S8 |
5 | S8 | S9 | S10 | S11 | S1 | S2 | S3 | S4 | S5 | S6 | S7 |
6 | S7 | S8 | S9 | S10 | S11 | S1 | S2 | S3 | S4 | S5 | S6 |
7 | S6 | S7 | S8 | S9 | S10 | S11 | S1 | S2 | S3 | S4 | S5 |
8 | S5 | S6 | S7 | S8 | S9 | S10 | S11 | S1 | S2 | S3 | S4 |
9 | S4 | S5 | S6 | S7 | S8 | S9 | S10 | S11 | S1 | S2 | S3 |
10 | S3 | S4 | S5 | S6 | S7 | S8 | S9 | S10 | S11 | S1 | S2 |
11 | S2 | S3 | S4 | S5 | S6 | S7 | S8 | S9 | S10 | S11 | S1 |
*Note: The boldfaced S number represents a tester standing at position A6 during a test while the regular-face ones represent the testers standing at other positions accordingly during the tests. | |||||||||||
During each test, one tester was responsible for producing the excitations at Position A6. The perception factors (1-5 as indicated in Table 4) related to the vibration serviceability were recorded by the other 10 testers. All the testers have been trained to give their feeling directly based on the psychological experiment requirements: (1) No hint before any impact testing; (2) Give perception senses without any interference. Therefore, the perception factors are decided by testers and somehow subjective, especially for the perception factors ranging from 3 to 4. However, the results are still valuable since the conservative acceleration amplitude (perception factor 3 instead of 4) is chosen for evaluating the floor vibration. For each impact load, there were 330 (= 10×3×11) perception factors involved, since one tester could not provide his/her own data while producing the excitations. A total of 1320 (= 4×330) perception factors were thus recorded by the testers.
Table 4The perception factors
Factor | 1 | 2 | 3 | 4 | 5 |
Feeling | Not perceptible | Slightly perceptible | Distinctly perceptible but can be acceptable | Strongly perceptible and mental discomfort | Extremely perceptible and intolerable |
Moreover, the ambient vibration test was carried out to ascertain the vibration parameters, i.e., the natural frequency, mode shape, and damping ratio, etc. Based on the ambient vibration, the main characteristics were obtained using the enhanced frequency domain decomposition (EFDD) method [15].
3. Results and discussion
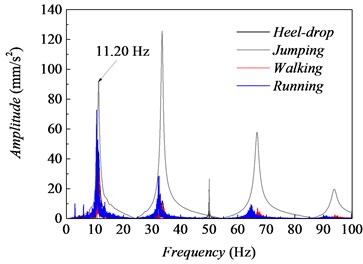
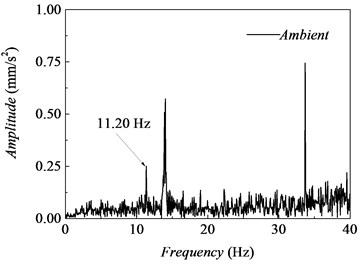
The fundamental frequency of this APT girder keeps at 11.20 Hz, seen from the frequency domain, as shown in Fig. 6(a), using the fast Fourier transform (FFT) technique to which the response data in the time domain were converted. It shows the same value using EFDD based on ambient vibration, as shown in Fig. 6(b). According to the design guidelines specified in SCI P354 [16], such frequency is above the threshold that would present an excessive vibration problem.
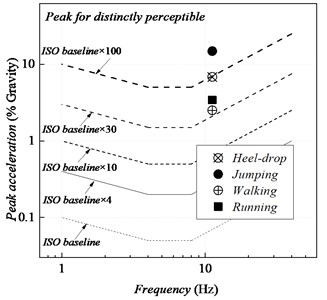
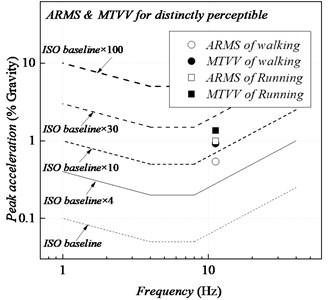
ISO 2631 covers many building vibration environments. For offices, the multipliers of 4 for continuous or intermittent vibrations and 60-128 for transient vibrations are recommended. The threshold values corresponding to perception factor = 3 (distinctly perceptible but can be acceptable) are shown in Fig. 7. The threshold peak accelerations of 650 mm/s2 and 1450 mm/s2 for transient heel-drop and jumping impacts, 250 mm/s2 and 340 mm/s2 for the steady-state walking and running are recommended for offices and residential buildings. On the other hand, the threshold MTVV of 90 mm/s2 and ARMS of 50 mm/s2 for steady state walking are recommended. Moreover, the threshold MTVV of 130 mm/s2 and ARMS of 90 mm/s2 for steady state running are recommended.
Fig. 6Typical power spectrum: a) due to human activity, b) under ambient vibration
a)
b)
Fig. 7Vibration serviceability assessment according to ISO 2631-2 (1989): a) peak, b) ARMS and MTVV
a)
b)
Based on the multipliers of AISC [8], the acceleration threshold value for offices is 70 mm/s2 (with multiplier = 10) based on the fundamental frequency of 11.20 Hz. It changes to 700 mm/s2 (with multiplier = 100) for rhythmic activities. For distinctly perceptible vibration during the walking and running tests, the MTVVs were kept at 0.92 % g (or 92.03 mm/s2) and 1.36 % g (or 136.23 mm/s2), respectively. The corresponding perception scales are 13.09 and 19.38. Accordingly, the multipliers of 13 and 19 are suggested respectively for the MTVV of walking and running.
The mode shapes of this APT are similar to those of the traditional beams and described in detail in paper [1]. The measured damping ratios for the APT girder are generally lower than the critical damping ratio of 2 % as suggested by the AISC [8]. The damping ratios vary narrowly between 0.8 % and 1 % for the first three vibration modes. Accordingly, a damping of 1 % is recommended for the APT girder system.
4. Perception VDV
The vibration dose value (VDV) in m/s1.75 can be calculated by:
In which a(t) means the weighted acceleration signal, T is the duration of which the VDV is calculated. The VDV gives more emphasis to the magnitude of vibration than duration [17]. Therefore, it is thought to be more appropriate than RMS since it is based on the forth power instead of second power of the acceleration time history.
For discrete acceleration points, the value of VDV can be defined by:
where ak means the values of discontinuous acceleration points, f stands for sampling frequency, which is 1,000 Hz for both transient activities (heel-drop and jumping) and steady-state incentives (walking and running). While M is the number of data points in the digitized sample, which is 10,000 for transient activities and 20,000 for steady-state incentives, respectively. There are different VDVs corresponding to perception factors from 1 to 5 based on the test results. The perception factor = 3 (Distinctly perceptible but can be acceptable in Table 4) is chosen for determining the threshold values for human comfort. The acceptable VDV values due to various human activities are shown in Fig. 8. The VDVs under transient activities (heel-drop and jumping) are larger than those under steady-state incentives (walking and running).
Fig. 8VDV for various human activities
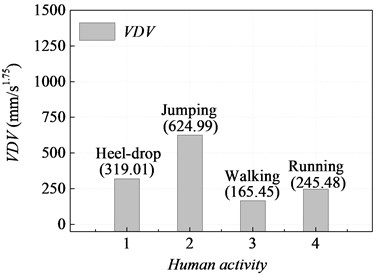
Based on this study, the threshold VDVs 300-600 mm/s1.75for transient activities (319.01 mm/s1.75 for heel-drop and 624.99 mm/s1.75 for jumping in Fig. 8 based on testing results) and 160-240 mm/s1.75 for steady-state incentives (165.45 mm/s1.75 for walking and 245.48 mm/s1.75 for running in Fig. 8 based on testing results) are recommended. These VDVs for walking and running are much lower than the threshold values (400-4800 mm/s1.75 in Table 1) proposed by the researchers and therefore, more attention should be paid when evaluating the floor vibration using VDV.
5. Conclusions
A comprehensive research was undertaken to study the vibration behavior of the arch pre-stressed concrete truss (APT) by conducting the heel-drop, jumping, walking and running excitations. Analysis of this research led to the following conclusions:
1) The investigated APT girder possesses high fundamental frequency (11.20 Hz) and low damping ratio (1 %).
2) The threshold peak accelerations of 650 mm/s2 and 1450 mm/s2 for transient heel-drop and jumping impacts, 250 mm/s2 and 340 mm/s2 for the steady-state walking and running are recommended for offices and residential buildings.
3) Multipliers of 13 and 19 applied to the ISO baseline are recommended when evaluating the walking and running vibration serviceability using MTVV for the APT structure in offices and residential building.
4) The threshold VDVs 300-600 mm/s1.75 for transient activities and 160-240 mm/s1.75 for steady-state incentives are recommended.
References
-
Li J., Liu J., Cao L., Chen Y. F. Vibration behavior and serviceability of arched prestressed concrete truss due to human activity. International Journal of Structural Stability and Dynamics, Vol. 18, Issue 12, 2018, p. 185014621.
-
Cao L., Liu J., Chen Y. F. Vibration performance of arch prestressed concrete truss girder under impulse excitation. Engineering Structures, Vol. 165, 2018, p. 386-395.
-
Chen Y., Aswad A. Vibration characteristics of double tee building floors. PCI Journal, Vol. 39, Issue 1, 1994, p. 84-95.
-
Dolan J. D., Murray T. M., Johnson J. R., Runte D., Shue B. C. Preventing annoying wood floor vibrations. Journal of Structural Engineering, Vol. 125, Issue 1, 1999, p. 19-24.
-
Pavic A., Reynolds P. Modal testing and dynamic FE model correlation and updating of a prototype high-strength concrete floor. Cement and Concrete Composites, Vol. 25, Issue 7, 2003, p. 787-799.
-
Sanchez T. A., Davis B., Murray T. M. Floor vibration characteristics of long span composite slab systems. Structures Congress, 2011, p. 360-370.
-
ISO 2631-2. Mechanical Vibration and Shock-Evaluation of Human Exposure to Whole-Body Vibration, Part 2: Vibration in Buildings (1 Hz to 80 Hz). First Edition, International Organization for Standardization (ISO), Switzerland, 1989.
-
Murray T. M., Allen D. E., Ungar E. E. Floor Vibrations due to Human Activity. Second Edition, American Institute of Steel Construction, Inc., Chicago, 2016.
-
Setareh M. Vibration serviceability of a building floor structure. II: vibration evaluation and assessment. Journal of Performance of Constructed Facilities, Vol. 24, Issue 6, 2010, p. 508-518.
-
Chen J., Zhang M., Liu W. Vibration serviceability performance of an externally prestressed concrete floor during daily use and under controlled human activities. Journal of Performance of Constructed Facilities, Vol. 30, Issue 2, 2016, p. 04015007.
-
Ellis B. R., Littler J. D. Response of cantilever grandstands to crowd loads. Part I: serviceability evaluation. Structures and Buildings, Vol. 157, Issue 4, 2004, p. 235-241.
-
Salyards K., Hanagan L., Trethrwey M. Comparing vibration serviceability assessment measures for studium rock concert data. Proceedings of the 15th International Modal Analysis Conference. Society of Experimental Mechanics, Orlando, 2006.
-
Casagrande D., Giongo I., Pederzolli F., Franciosi A., Piazza M. Analytical, numerical and experimental assessment of vibration performance in timber floors. Engineering Structures, Vol. 168, 2018, p. 748-758.
-
Setareh M. Vibration Serviceability Issues of Slender Footbridges. Journal of Bridge Engineering, Vol. 21, Issue 11, 2016, p. 04016084.
-
Altunisik A. C., Bayraktar A., Sevim B., Ӧzdemir H. Experimental and analytical system identification of Eynel arch type steel highway bridge. Journal of Constructional Steel Research, Vol. 67, Issue 12, 2011, p. 1912-1921.
-
Smith A. L., Hicks S. J., Devine P. J. Design of Floors for Vibrations: a New Approach. SCI Publication P354, Ascot, 2009.
-
Griffin M. J. Hand Book of Human Vibration. Academic, London, 1996.
About this article
The authors are grateful for the financial support provided by the National Natural Science Foundation of China (51708058) and the Science and Technology Foundation of Chongqing (cstc2014jcyjys0004). The authors also appreciate Huang Shu for providing helpful discussion and helping collect the data.

