Abstract
Vibrations propagating through the soil into the building can not only be harmful to the building structure or cause its accelerated wear, but can also effect on the vibrational comfort in the rooms. They can also be annoying for residents and building users, and in extreme cases can lead to sleep disorders, headaches and neurotic conditions. Especially vibrations from the low frequency range from 5 to 25 Hz are undesirable, because there are resonance frequencies of human internal organs in this frequency range. The human perception of vibrations in buildings, despite many researches made in the past, despite standards and requirements in this area, is still a topic not fully understood mainly due to the subjective nature of the perception of vibrations by various people. It is widely known that the type of transport vibration source has an impact on human perception. Vibrations generated by above-ground sources are more felt on the upper floors as opposed to vibrations generated from the underground. In this paper three types of transport vibrations are analyzed on one chosen building located in Warsaw. Human perception of vibration is evaluated according to two methods: root mean squared (RMS) and vibration dose value (VDV).
1. Introduction
The aim of this paper is to analyzed the two methods of evaluation of human perception of vibrations in terms of issue related to various sources of transport that may affect the result of this assessment. The paper considers vibrations from external paraseismic sources. The vibrations generated by machines in rooms [1], which generate continuous vibrations, but with a higher frequency range, and human induced vibrations [1-3], which are more important in slender structures - a type of footbridge - were not analyzed. Transport vibrations were selected because of their continuous nature and relatively low frequency range. There are many analysis available in literature which are focused on influence of transport vibrations on human perception. Most of them analyzed only one source of vibration. There are many investigations on railway induced vibration and its annoyance [4-7]. Sometimes when the building is localized close to the busy road, the vibration coming from heavy trucks are analyzed [8-10]. In the cities of shallow underground like Warsaw these kind of vibrations are also analyzed [11]. There are some research which investigate more than one source of vibration [9, 10], but still the detailed result are not available. This paper summarizes the results of the assessment of the influence of vibrations on people in buildings. The vibrations come from different transport sources: from vehicles on roadways (mostly buses and heavy trucks) and from railways (trams, metro trains). The research is made on chosen building which is subjected to three sources of vibration. The results are presented and compared. The novelty of this manuscript is the comparison of the influences coming from three different sources of transport vibrations measured on the same building.
2. Description of analyzed building]
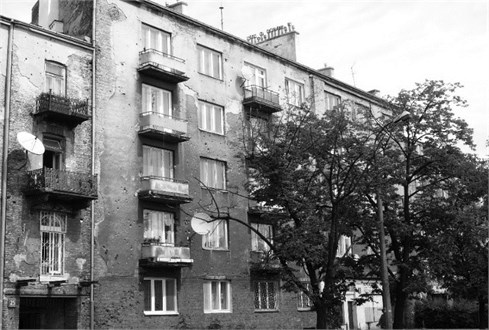
The analyzed building is localized in Warsaw at the Zamoyskiego St. It is a five-storey building built in traditional brick technology (Fig. 1). The building was built before World War II. Floors were made as Klein type. It is located 9 m from the edge of the road and about 20 m from the tram line (distance measured from the nearest rail head) and located directly above the metro tunnel.
Fig. 1View of the eastern facade of the building

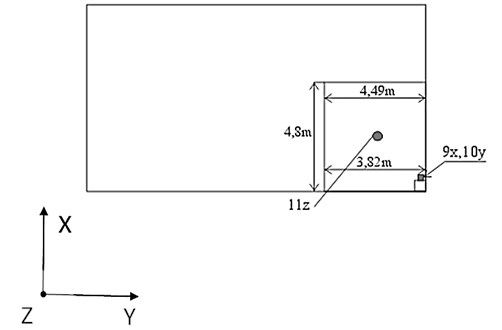
The measuring point was located on the fourth floor, in the living room located from the side of the road and rail, in accordance with the standards [12, 13] was located in the geometrical center of the floor (Fig. 2). Accelerations were measured in three orthogonal directions (X,Y,Z).
Fig. 2The location of the vibration pickup measuring point

As a result of dynamic background measurements, 12 events were recorded from: the tram line (8 events), the road (4 events) and from metro trains (11 events). In total, 23 events were analyzed according to RMS and VDV procedure.
Table 1Thresholds for VDV values
Room destination | Low probability of adverse comments | Adverse comments possible | Adverse comments probable |
Residential buildings – 16 h day | 0.2-0.4 | 0.4-0.8 | 0.8-1.6 |
Residential buildings – 8 h night | 0.1-0.2 | 0.2-0.4 | 0.4-0.8 |
Office buildings – 16 h day | 0.4-0.8 | 0.8-1.6 | 1.6-3.2 |
Workshops – 16 h day | 0.8-1.6 | 1.6-3.2 | 3.2-6.4 |
3. RMS results
The RMS procedure was made according to Polish requirements [12]. It is worth noting that duration of vibration in [12] are strictly defined. The duration of vibration determines the range in which the value of the amplitude of the vibration acceleration does not fall below 0.2 the value of the maximum amplitude in the recorded signal. That is why the RMS procedure acc. [12] is more restrictive than those from ISO standard [13] in which duration of vibrations is defined as fellows: the recorded signal should be sufficient to ensure rational statistical accuracy. This definition is very broad and imprecise. From the 23 recorded dynamical events, five exceeded the threshold of perception of vibrations by people in buildings. Three exceedances of the perception threshold occurred for metro trains, which accounts for approx. 27 % of all metro trains passings which were registered. Two exceedances of the perception threshold from the roads, which in this case constitutes 50 % of all recorded signals from the road. In the case of trams passing there was no exceedance of the vibration perception threshold.
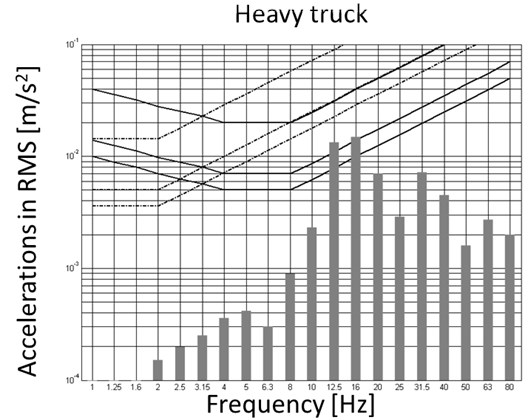
The example of RMS analysis in the 1/3 octave bands is shown in Fig. 3.
Fig. 3RMS analysis of recorded signal from heavy truck passing

To make results form RMS method more visible the WODL coefficient was used:
where: aRMS the acceleration RMS value, aZ the acceleration RMS value equivalent to the threshold for the human perception of vibration in Z direction.
4. VDV results
The same events as those analyzed by RMS were subjected to VDV analysis. The duration of the event, which varied from 11 to 19 s, was taken into account. The results of the VDV analysis together with the summary of WODL coefficients calculated during the RMS analysis are given in Table 2.
Grey marked values according to the Polish standard [12] exceed the values corresponding to the threshold of human vibration perception in buildings (WODL > 1.0) or correspond to the low probability of complaints from residents on a daily exposure (VDV > 0.2).
In order to compare the results obtained with the RMS method and the VDV method, the following assumptions were made:
– low probability of complaints is compared with exceedance the threshold of human vibration perception,
– the possible occurrence of complaints is compared to the vibrational comfort level.
Table 2VDV values in individual events and maximum WODL values in events
No. | Vehicle type | Duration of vibration [s] | VDV [m/s1,75] | WODL/f [–/Hz] |
1 | Tram | 19 | 0,050 | 0,48/12,5 |
2 | Tram | 11 | 0,049 | 0,49/12,5 |
3 | Bus | 11 | 0,094 | 1,01/12,5 |
4 | Tram | 18 | 0,088 | 0,86/12,5 |
5 | Heavy truck | 12 | 0,161 | 1,72/12,5 |
6 | Bus | 12 | 0,065 | 0,75/12,5 |
7 | Tram | 12 | 0,050 | 0,52/12,5 |
8 | Bus | 12 | 0,043 | 0,58/12,5 |
9 | Tram | 14 | 0,073 | 0,49/12,5 |
10 | Tram | 12 | 0,049 | 0,53/12,5 |
11 | Tram | 12 | 0,041 | 0,42/12,5 |
12 | Tram | 12 | 0,070 | 0,77/12,5 |
13 | Metro train | 18 | 0,171 | 0,83/40 |
14 | Metro train | 18 | 0,142 | 0,70/40 |
15 | Metro train | 18 | 0,214 | 1,28/40 |
16 | Metro train | 17 | 0,144 | 0,71/40 |
17 | Metro train | 16 | 0,119 | 0,57/40 |
18 | Metro train | 18 | 0,152 | 0,71/40 |
19 | Metro train | 18 | 0,166 | 0,94/40 |
20 | Metro train | 18 | 0,162 | 1,03/40 |
21 | Metro train | 16 | 0,322 | 1,18/40 |
22 | Metro train | 18 | 0,146 | 0,90/40 |
23 | Metro train | 18 | 0,198 | 0,82/40 |
5. Conclusions
Based on the RMS analysis, it can be stated that 22 % of events exceeded the values corresponding to the thresholds of human vibration perception in buildings.
Based on the VDV study, a few events were found in which residents' complaints were unlikely to occur. These are two events related to metro trains. The vibrations generated by tram passing are imperceptible to people. Based on the results of the assessment made using the VDV method, it can be concluded that 18 % of events caused by metro result in a low probability of complaints.
VDV method according to ISO standard is more sensitive for peaks that can occur in the recorded signal. Transport vibrations are more stable vibrations with the low value of the crest factor. That is why for the transport vibrations more proper method for evaluation of human perception of vibration will be RMS method.
References
-
Zhou X., Liu J., Cao L., Li J. Vibration serviceability of pre-stressed concrete floor system under human activity. Structure and Infrastructure Engineering, Vol. 13, Issue 8, 2017, p. 967-977.
-
Muhammad Z. O., Reynolds P. Vibration serviceability of building floors: performance evaluation of contemporary design guidelines. Journal of Performance of Constructed Facilities, Vol. 33, Issue 2, 2019, https://doi.org/10.1061/(ASCE)CF.1943-5509.0001280.
-
Mohebbi A. A Study of human reaction to building vibrations due to occupants’ movements. Proceedings of the National Conference on Undergraduate Research (NCUR), Eastern Washington University, Cheney, 2015.
-
Zouab Ch, Wanga Y., Moore J. A., Sanayei M. Train-induced field vibration measurements of ground and over-track buildings. Science of The Total Environment, Vol. 575, 2017, p. 1339-1351.
-
Howarth H., Griffin M. J. Human response to simulated intermittent railway-induced building vibration. Journal of Sound and Vibration, Vol. 120, Issue 2, 1988, p. 413-420.
-
Licitra G., Fredianelli L., Petri D., Vigotti M. A. Annoyance evaluation due to overall railway noise and vibration in Pisa urban areas. Science of The Total Environment, Vol. 568, 2016, p. 1315-1325.
-
Peris E., Woodcock J., Sica G., Sharp C., Moorhouse A. T., Waddington D. C. Effect of situational, attitudinal and demographic factors on railway vibration annoyance in residential areas. Journal of the Acoustical Society of America, Vol. 135, Issue 1, 2014, p. 194-204.
-
Hao H., Ang T. C., Shen J. Building vibration to traffic-induced ground motion. Building and Environment, Vol. 36, Issue 3, 2001, p. 321-336.
-
Klæboe R., Fyhri A. People’s Reactions to Vibrations in Dwellings from Road and Rail. TØI Report, No. 443, 1999.
-
Klæboe R., et al. Vibration in dwellings from road and rail traffic – Part II: exposure-effect relationships based on ordinal logit and logistic regression models. Applied Acoustics, Vol. 64, Issue 1, 2003, p. 89-109.
-
Stypuła K. Vibrations caused by train passages in metro tunnel compared with vibrations from surface transportation. Proceedings of the 6th International Conference on Structural Dynamics EURODYN, Vol. 3, 2005, p. 2059-2064.
-
PN-B-02171:2017-06, Evaluation of Vibrations Influence on People in Buildings, 2017, (in Polish).
-
ISO 2631-2, Mechanical Vibration and Shock – Evaluation of Human Exposure to Whole-Body Vibration – Part 2: Vibration in Buildings (1 Hz to 80 Hz). International Organization for Standardization, 2003.

