Abstract
Aero-hydraulic pump is a central part of hydraulic system in an aircraft. Acceleration sensors are installed in the axis, tangential and vertical direction for identifying the weak imbalance fault, and meanwhile analysis is made for the sensibility of weak imbalance fault from different direction acceleration signal. The result shows that the signal from vertical acceleration sensor is the most sensitive and the one from axis acceleration sensor is the least sensitive to identify and diagnose weak imbalance fault of aero-hydraulic pump.
1. Introduction
Aero-hydraulic pump is a central part of hydraulic system in an aircraft. According to statistics, the hydraulic system faults account for 40 percent of all aircraft faults [1, 2]. The power input shaft fault of aero-hydraulic pump is typical of hydraulic pump, which results in insufficient pressure or excessive volatility, and failure of actuator which takes hydraulic source as the power to achieve its expected function [3, 4]. Failures can be detected in undercarriage, for example, the failure to fold or release in time or in wheel brake system which cannot response in time, and so on [5]. The casing vibration signal of hydraulic pump contains abundant fault information, and the vibration signal analysis is one of the main ways for fault diagnosis and predictive methods in aero-hydraulic pump [6]. In order to identify and analyze the signal sensibility from different directions for the weak imbalance fault, acceleration sensors are installed in the axis, tangential and vertical direction and the frequency spectrum analysis is carried out.
2. Aero-hydraulic pump weak imbalance fault experiment
In this paper, all experiment data comes from some types of aero-hydraulic pumps shown Fig. 1, which is designed by Aero Engine Corporation of China (AECC) HARBIN DONGAN Engine CO., LTD. The hydraulic pump is swash-plate axial piston pump, and the numbers of plungers are nine. The weakness imbalance fault is set in couple close to power input shaft of hydraulic pump by adding an imbalance bolt. The hydraulic pump and specific position of imbalance bolt is shown in Fig. 1. The size and weight of imbalance bolt is respectively M6*10 cm and 0.045 Kg. The rotating speed measured by SE series eddy current displacement sensors which is provided by instrument factory Southeast University. Data collector Model is USB9234 which is provided by National Instruments. The acceleration sensor is installed on mounting seat of aero-hydraulic pump, and the direction is vertical, which is shown in Fig. 1.
3. Casing vibration signal sensibility analysis
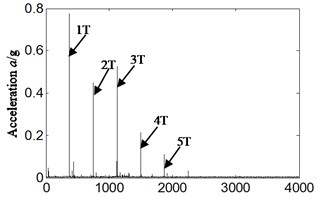
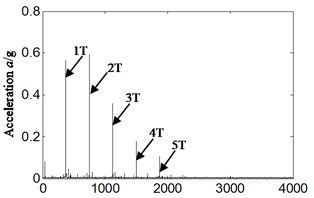
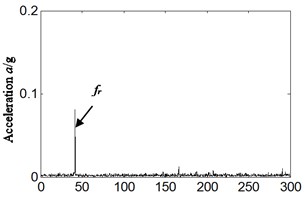
Weakness imbalance faults and experiment data of aero-hydraulic pump in normal conditions have been selected at random. All the 1 T-5 T respectively represent the fuel feeding pulse frequency of 1-5 integer multiples (nine times of rotation frequency), and the fr represents the rotational frequency in this paper. The rotating speed is 2487 r/min and the rotating frequency is 41.5 Hz by calculating, and the fuel feeding pulse frequency is equal to 373.0 Hz on normal running conditions. The rotating speed is 2465 r/min and the rotating frequency is 41.1 Hz by calculating, and the fuel feeding pulse frequency is equal to 369.8 Hz on weak imbalance fault occurrence in this paper.
Fig. 1Imbalance fault experiment of aero-hydraulic pump

3.1. Sensor installation on axis direction
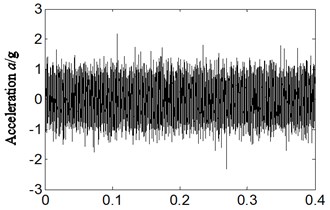
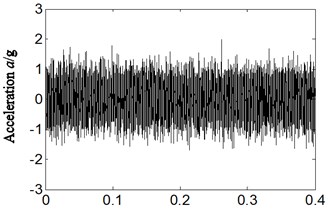
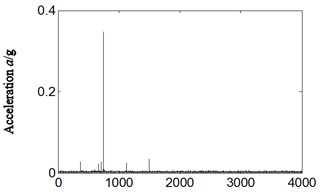
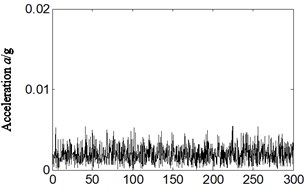
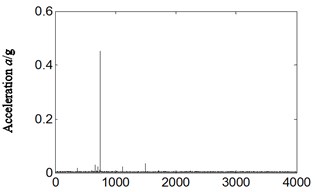
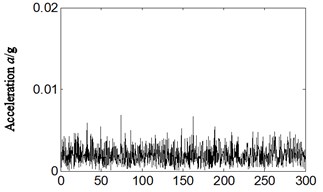
We firstly took a sensor installation on axis direction as an example for analysis. The frequency spectrum was obtained based on casing acceleration signal and the result is shown in Figs. 2, 3. The Fig. 2 is the time domain of acceleration signal and Fig. 3 is frequency spectrum and its local amplification. Fig. 2(a) and Fig. 3(a), (b) are corresponding with normal running conditions. Fig. 2(b) and Fig. 3(c), (d) are corresponding with weak imbalance fault.
Fig. 2Time-domain of acceleration signal for: a) normal running and, b) weak imbalance fault-axis
a) Time t/s
b) Time t/s
By analyzing Fig. 3(a), (b), and comparing with Fig. 3(c), (d), it can be concluded that the frequency spectrum is approximate. The amplitude of the rotation frequency is not obvious no matter in Fig. 3(a), (b) or Fig. 3(c), (d), and it cannot identify if the weak imbalance fault occurs according acceleration signal collected by axial acceleration sensor (the amplitude of rotation frequency is significantly increased and highlighted when imbalance fault occurs).
3.2. Sensor installation on tangential direction
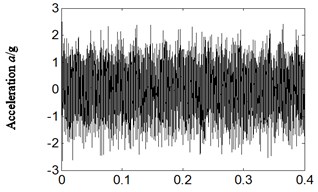
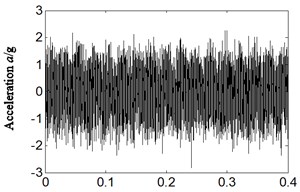
The acceleration signal from tangential sensor has been analyzed for further studying the fault-identifying sensibility of acceleration signal from different directions for weak imbalance fault of aero-hydraulic pump. The result is shown in Fig. 4, Fig. 5. Fig. 4 is the time domain of tangential acceleration signal and Fig. 5 is frequency spectrum and its local amplification. Fig. 4(a) and Fig. 5(a), (b) are corresponding with normal running conditions. Fig. 4(b) and Fig. 5(c), (d) are corresponding with weak imbalance fault.
Fig. 3Frequency spectrum and its local amplification for: a), b) normal running, c), d) weak imbalance fault-axis
a) Frequency f/Hz
b) Frequency f/Hz
c) Frequency f/Hz
d) Frequency f/Hz
Fig. 4Time-domain of acceleration signal for: a) normal running, b) weak imbalance fault-tangential
a) Time t/s
b) Time t/s
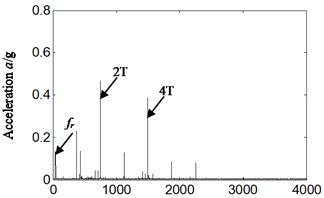
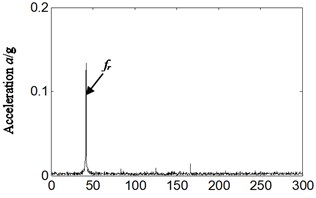
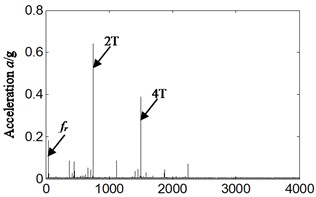
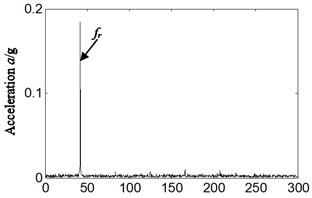
Analyzing Fig. 5(a), (b), and comparing with Fig. 5(c), (d), it can be concluded that the frequency spectrum is also approximate. The amplitude of the rotation frequency is 0.134 g in Fig. 5(a), (b) which is corresponding with normal running conditions of hydraulic pump. When weak imbalance fault occurs, the amplitude of rotation frequency is equal to 0.184 g as shown in Fig. 5(c), (d), which is approximately 1.37 times of normal running conditions. The rotation frequency amplification is increased though not obvious. It is obscure for identifying the weak imbalance fault of aero-hydraulic pump.
3.3. Sensor installation on vertical direction
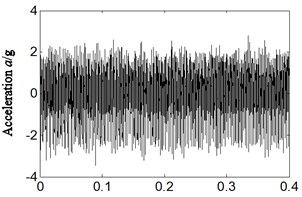
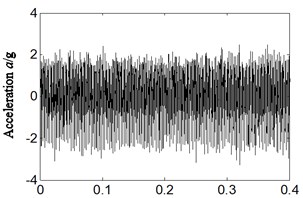
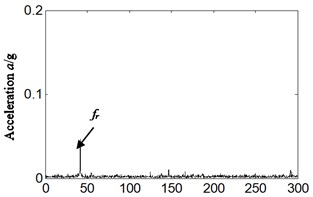
The acceleration signal from vertical sensor is analyzed for further studies the fault-identifying sensibility from different direction acceleration signal for weak imbalance fault. The result is shown in Fig. 6, Fig. 7, and Fig. 6 is the time domain of vertical acceleration signal, Fig. 7 is frequency spectrum and its local amplification. Fig. 6(a), Fig. 7(a), (b) are corresponding with normal running conditions. Fig. 6(b), Fig. 7(c), (d) are corresponding with weak imbalance fault.
By analyzing Fig. 7(a), (b), and comparing with Fig. 7(c), (d), it can find that the frequency spectrum is also approximate. The amplitude of the rotation frequency is 0.044 g in Fig. 7(a), (b) which is corresponding with normal running conditions of hydraulic pump. While weak imbalance fault occurs, the amplitude of rotation frequency is equal to 0.082 g as shown in Fig. 7(c), (d), which is almost the twice of normal running conditions. It is matching with the imbalance fault set of aero-hydraulic pump.
Fig. 5Frequency spectrum and its local amplification for: a), b) normal running, c), d) weak imbalance fault-tangential
a) Frequency f/Hz
b) Frequency f/Hz
c) Frequency f/Hz
d) Frequency f/Hz
Fig. 6Time-domain of acceleration signal for: a) normal running, b) weak imbalance fault-vertical
a) Time t/s
b) Time t/s
Fig. 7Frequency spectrum and its local amplification for: a), b) normal running, c), d) weak imbalance fault-vertical
a) Frequency f/Hz
b) Frequency f/Hz
c) Frequency f/Hz
d) Frequency f/Hz
4. Conclusions
In order to analyze the fault-identifying sensibility of acceleration signal from different directions for weak imbalance fault of aero-hydraulic pump, the acceleration sensors are installed in the axis, tangential and vertical direction, and the spectrum frequency analysis is carried out. The result has shown that the signal from vertical acceleration sensor is the most sensitive while the sensor in axis acceleration is the least sensitive for identifying weak imbalance fault of aero-hydraulic pump.
References
-
Liu Yujiao, Yao Entao, Xu Hongzhuan Fault diagnosis of hydraulic pump based on particle filtering and autoregressive spectrum. Chinese Journal of Scientific Instrument, Vol. 33, Issue 3, 2012, p. 561-567.
-
Li H. Performance test and fault diagnosis of encapsulated hydraulic system. Journal of Electronic Measurement and Instrument, Vol. 18, 2004, p. 950-953.
-
Jiang L., Zhang Sh Q., Wang W. Y. Q. Wavelet transform method for fault diagnosis of hydraulic pump. Chinese Journal of Mechanical Engineering, Vol. 37, Issue 6, 2001, p. 34-37.
-
Tang Hong Bin, Wu Yun Xin, Hua Guang Jun, et al. Fault diagnosis of pump using EMD and envelop spectrum analysis. Journal of Vibration and Shock, Vol. 31, Issue 9, 2012, p. 44-48.
-
Wang Yukui, Li Hongru, Ye Peng Fault identification of hydraulic pump based on multi-scale permutation entropy. China Mechanical engineering, Vol. 26, Issue 4, 2015, p. 518-523.
-
Gao Yingjie, Kong Xiangdong, Zhang Qin Wavelet packets analysis based method for hydraulic pump condition monitoring. Journal of Mechanical Engineering, Vol. 45, Issue 8, 2009, p. 80-88.
About this article
This work was supported by Aeronautical Science Foundation of China (Grant No. 20163354004), the National Natural Science Foundation of China (Grant No. 51605309, 61503256) and Provincial Education Department of Liaoning Province of China (Grant No. L201628).

