Abstract
Experimental modal analysis is an important tool in dynamic testing. Experimental modal analysis of linear engineering structures is now mature. However, nonlinear behavior of engineering structure is a challenge. In this paper, a vibration test method of nonlinear normal mode (NNM) is studied. First, a 3-DOF test device with nonlinear stiffness is designed. Then, based on methodology of force appropriation, an approach to nonlinear modal testing is studied. Specifically, multi-harmonic sine force excitation is applied on the device and velocity response of the device is measured by laser vibrometer. According to the area in force-velocity response plot, the excitation is adjusted to stimulate nonlinearity of the device. Work of this paper explores vibration test method of NNM and can be used for identification of NNM and response prediction of the system, which lays the foundation for application in engineering structure of aero-engine.
1. Introduction
In traditional study, study of linear normal mode (LNM) is in a leading position. Due to two important properties of LNM: invariance and modal superposition, there are lots of applications in experimental modal analysis, such as structural damage detection, finite element model modification and optimized design of structure. However, nonlinearity is a frequent occurrence in applications, such as aircraft skins, engine mounts between aircraft and aero-engine. Therefore, it is significant to study NNM.
Historically, Lyapunov and Poincare’ contributions served as the cornerstone of the NNM development [1]. There are two main definitions of the NNM in the literature: one is proposed by Rosenberg and the other is a generalization of Rosenberg’s definition that provides a direct and elegant extension of the NNM concept to damped systems by Shaw and Pierre.
In recent years, numerical methods and experiments about NNM are also in development. At present, two specific methods on experimental modal analysis are used, namely phase resonance and phase separation methods. In phase separation testing, several normal modes are excited simultaneously using either broadband or swept-sine force, and are subsequently identified using appropriate linear system identification techniques [2]. Reversely, phase resonance testing, also known as force appropriation, consists in exciting the normal modes of interest one at a time using a multi-point sine forcing at the corresponding natural frequency. Furthermore, phase resonance methods have also begun to be extended to the measurement of NNM. For instance, Peeters et al. proposed a rigorous theory by which an undamped NNM could be isolated in a measurement [1]. They showed that a multi-point multi-harmonic sine wave could cancel damping and isolate a general NNM. It was then demonstrated both analytically and experimentally that a single-point single harmonic force could be used to isolate a response in the neighborhood of a single NNM with good accuracy. In these investigations, once phase lag quadrature was met, the input force was turned off and the response allowed to decay tracing the backbone of the NNM [1].
In this paper, a 3-DOF test device with nonlinear stiffness is designed. Then, based on the concept of NNM and experimental modal analysis, basic theories and vibration test methods of NNM are explored.
2. Design of test device with nonlinear stiffness
In order to study vibration test methods of NNM, a typical test device with nonlinear stiffness is designed. By changing contact length of aluminum plates near the base with fillet, nonlinear stiffness is introduced during the vibration.
2.1. Description of structure
The test device with nonlinear stiffness is a three-dimension framed structure with bolted joints, which is made of steel plates, aluminum plates and the base, as shown in Fig. 1(a) and Fig. 1(b). The size and materials of the parts are shown in Table 1.
Fig. 1Three-dimension framed structure
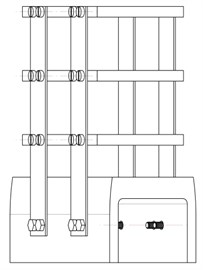
a) Geometric model
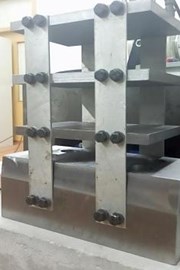
b) Actual structure
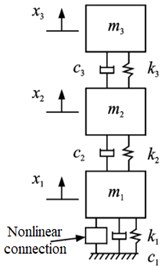
c) Parametric model
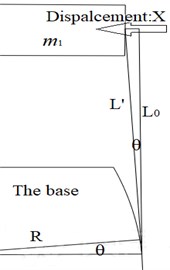
d) Lateral motion plot
Table 1Details of structure
Part | Material | Size/mm | Amount | Elastic modulus / GPa | Density / (kg/m3) |
Base | Q235 | 200×150×80 | 1 | 192 | 7820 |
Steel plate | Q235 | 150×100×10 | 3 | 192 | 7820 |
Aluminum plate | 6061 | 215×30×2 | 4 | 69 | 2700 |
Bolt | – | M6 | 32 | – | – |
2.2. Simplified model
Fig. 1(c) shows simplified model, namely a 3-DOF parametric model. Here are specific methods:
1) Regardless of mass of aluminum plates, bolts and small holes, mass of three steel plates constitutes a mass matrix according to Eq. (1):
where ρ is density of steel, and V is volume of steel plate.
2) In order to ignoring the influence of bolted joints on stiffness, each aluminum plate is divided into three parts to determine effective length of aluminum plate among steel plates to obtain bending stiffness of aluminum plate according to Eq. (2) and form a stiffness matrix:
where E is elastic modulus of aluminum plate, and Iy is its moment of inertia. Besides, b and h are respectively width and thickness of the plate. Particularly, l is effective length of aluminum plate among steel plates. According to Ref. [3], when non-contact length among steel plates is taken as l, calculation errors will be reduced.
2.3. The relationship between active length l and displacement of m1
In order to reflect nonlinearity of test device, fillets are machined on the base. Due to fillets, when the steel plate near the base vibrates laterally, effective length changes, which results in change of stiffness of the device. Therefore, nonlinearity of the device can be stimulated.
It is assumed that the steel plate near the base translates slightly to the left, regardless of variation along height due to its motion and deformation of aluminum plates, as is shown in Fig. 1(d) about the right side of the device. According to Fig. 1(d), the relationship between effective length l and displacement of m1 is shown in Eq. (3):
where x is displacement of m1, and L0 is initial effective length, L0=Rsinθ+C. R and θ are respectively fillet radius and deflection angle of aluminum plates. Besides, C is the distance between upper surface of the base and lower surface of the steel plate. For aluminum plates on the left side of the device, since deflection angle is small, effective length here is considered to be constant compared with initial effective length.
2.4. Determination of size of the base
According to Eq. (2) and Eq. (3), the force between the base and the steel plate is shown in Eq. (4):
It is necessary to discuss the effect of R, C and θ on the force when x is in a small range to examine nonlinearity of the test device. By programming calculation, force-displacement plots are depicted about a series of parameter combinations and natural frequency of parametric model is computed to be the judgement of nonlinearity. Finally, size of the base is determined, as shown in Fig. 2. And the key parameters including R and θ are respectively 0.206 m and 10°. In Fig. 2(c), l1, l2 and l3 named as initial effective length are 0.06577 m,0.05 m and 0.05 m.
Fig. 2Size of the base
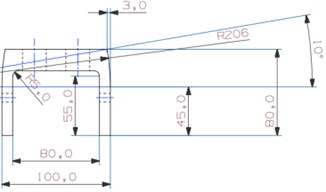
a) Front view of the base
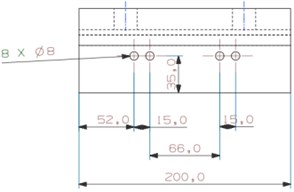
b) Front view of the base
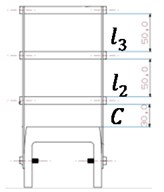
c) Assembly diagram
Table 2Natural frequency of parametric model
Displacement (m) | 1st order natural frequency (Hz) | 2nd order natural frequency (Hz) | 3rd order natural frequency (Hz) |
0 | 30.0196 | 97.5335 | 153.5382 |
0.003 | 33.0273 | 100.5476 | 154.3708 |
Rate of change | 10.00 % | 3.10 % | 0.54 % |
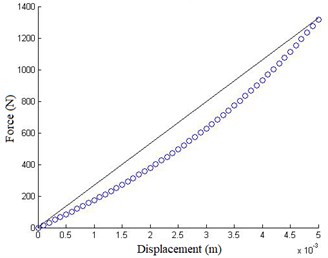
In Fig. 3, force shows obvious nonlinearity when displacement is in small range of 0-0.005 m. Meanwhile, rate of change about natural frequency is shown in Table 2. In conclusion, the test device shows obvious nonlinearity during vibration.
Fig. 3Force-displacement plot
3. Simulation of nonlinearity of the test device
In Fig. 3, function of curve fitting is shown in Eq. (5):
According to real modal analysis methods in Ref. [4], damping matrix is obtained. So, by using Ronge-Kuta method with Eq. (5) and parameters of 3-DOF parametric model, frequency response function (FRF) of displacement about m1 is shown in Fig. 4.
In Fig. 4(a), nonlinearity mainly has a great influence on FRF near resonance region, especially for the 1st mode. Meanwhile, in Fig. 4(b), as the force excitation increases, corresponding peak of frequency shifts to the right, showing a significant nonlinearity of hard stiffness. In other words, nonlinearity of the test device becomes more and more obvious with the force excitation increasing.
Fig. 4FRF of displacement about m1
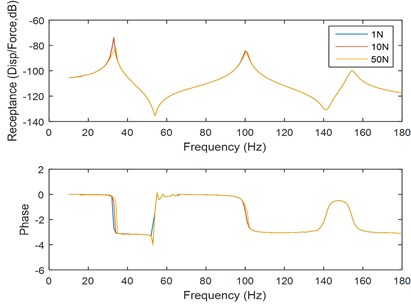
a) Span sweep (interval: 1 Hz)
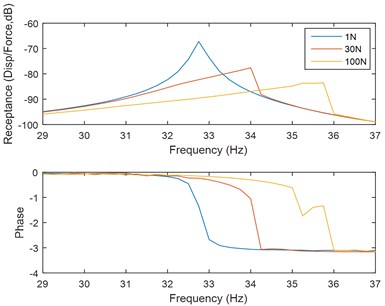
b) Local sweep of 1st mode (interval: 0.25 Hz)
4. Vibration test method of NNM
Vibration test method is divided into two steps. First, sine force excitation is applied to the device to cancel internal damping of the system under appropriate force and induce single-NNM behavior. Then, under appropriate force, NNMs of the structure are identified from the system. In the first step, the phase lag of the response with respect to the force is used as an indicator to assess the quality of the appropriation. But, it is not easy to implement this method. So, according to Ref. [5-7], appropriation indicator is used as the criterion in the form of harmonics of the excitation and the response. Besides, another criterion is shown in Ref. [1]. Once the area in force-velocity response plot becomes curves, appropriate force is also obtained.
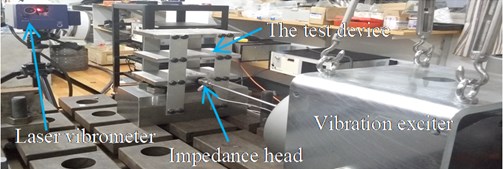
There are four parts of experimental setup in Fig. 5: (1) the test device, (2) vibration exciter, (3) laser vibrometer, (4) impedance head:
1) There are three measured points on the device, respectively at the center of lateral surface of the plate. And, transverse bending mode of the device is tested.
2) The pole of vibration exciter is contact with the plate near the base. And impedance head on the pole is connected with velocity sensor and force sensor.
3) The device is under sweep check by laser vibrometer. Meanwhile, sine force excitation and its harmonics are controlled by LabVIEW to obtain force-velocity response plots.
Fig. 5Experimental setup
4.1. Test results of LNM
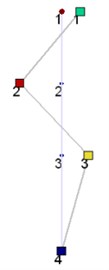
LNM of the plate near the base is tested at a lower exciting level. And Test results are shown in Table 3. Plots of bending mode shape are shown in Fig. 6. Comparing test results with results in Table 2, numerical results are smaller, which means bending stiffness of model is smaller. In a sense, bolted joints, errors of the structure during processing and assembly cause this discrepancy.
Table 3Test results of LNM
Bending mode | 1st order | 2nd order | 3rd order |
Natural frequency (Hz) | 31.77 | 106.33 | 171.53 |
Fig. 6Bending mode of testing (1, 2 and 3: the measured points on the steel plate; 4: the base)

a) 1st bending mode
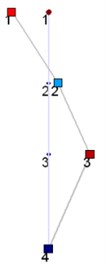
b) 2nd bending mode
c) 3rd bending mode
4.2. Test results of NNM
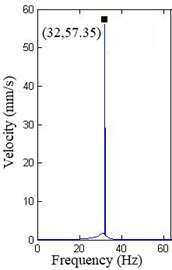
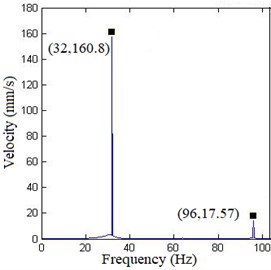
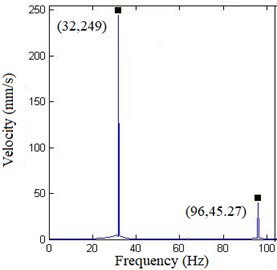
Taking 1st mode as an example, NNM is tested. First, sampling period and sampling interval are respectively set to 3.125 s and 1/2400 s. Then, frequency of the force is set to 32 Hz close to natural frequency of 1st mode. Next, amplitude of the force is adjusted by LabVIEW to obtain velocity response spectrum and force-velocity response plots.
In Fig. 7, at lower exciting level, the response only includes fundamental harmonic, meaning the structure mainly shows linearity; as exciting level increases, high harmonic appears in velocity response, mainly the 3th harmonic (96 Hz), meaning nonlinearity of the structure is stimulated gradually. In Fig. 8, as the force increases, the area in the figure is smaller and smaller, indicating that it is getting closer to inherent NNM. In order to obtain an appropriate force, additional harmonics need to be added to exciting signal to cancel high harmonics in the response and adjust the area in force-velocity response plots.
Fig. 7Velocity response spectrum
a) Amplitude:1.668 N
b) Amplitude:4.976 N
c) Amplitude:9.406 N
Fig. 8Force-velocity response plot
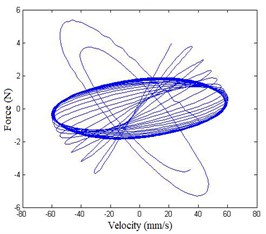
a) Amplitude:1.668 N
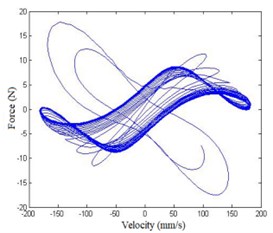
b) Amplitude:4.976 N
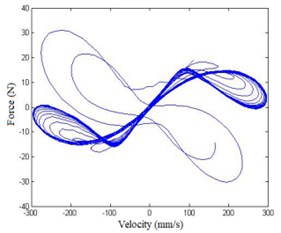
c) Amplitude:9.406 N
5. Conclusions
1) A 3-DOF test device with nonlinear stiffness is designed. First, nonlinear stiffness is introduced due to change of effective length of aluminum plates near the base with fillets during vibration. Then, the relationship between nonlinear force and displacement is derived to determine reasonable design parameters of the base.
2) Using the device, vibration test method of NNM based on methodology of force appropriation is studied. First, Multi-harmonic sine force excitation is applied on the device and velocity response of the device is measured by laser vibrometer. Then, the area in force-velocity response plot is adjusted to stimulate NNM of the device to find that high harmonic appears in velocity response, meaning nonlinearity of the device designed is related closely with level of the force excitation.
References
-
Ehrhardt D. A., Allen M. S. Measurement of nonlinear normal modes using multi-harmonic stepped force appropriation and free decay. Mechanical Systems and Signal Processing, Vol. 76, Issue 77, 2016, p. 612-633.
-
Noël J. P., Renson L., Grappasonni C., et al. Identification of nonlinear normal modes of engineering structures under broadband forcing. Mechanical Systems and Signal Processing, Vol. 74, 2016, p. 95-110.
-
Zhang Genbei, Zang Chaoping, Wang Xiaowei, et al. Finite element model updating of a framed structure with bolted joints. Engineering Mechanics, Vol. 31, Issue 4, 2014, p. 26-33.
-
Zang C., Schwingshackl C. W., Ewins D. J. Model validation for structural dynamic analysis: An approach to the sandia structural dynamics challenge. Computer Methods in Applied Mechanics and Engineering, Vol. 197, Issue 29, 2008, p. 2645-2659.
-
Peeters M., Kerschen G., Golinval J. C. Dynamic testing of nonlinear vibrating structures using nonlinear normal modes. Journal of Sound and Vibration, Vol. 330, Issue 3, 2011, p. 486-509.
-
Peeters M., Kerschen G., Golinval J. C. Modal testing of nonlinear vibrating structures based on nonlinear normal modes: Experimental demonstration. Mechanical Systems and Signal Processing, Vol. 25, Issue 4, 2011, p. 1227-1247.
-
Atkins P. A., Wright J. R., Worden K. An extension of force appropriation to the identification of non-linear multi-degree of freedom system. Journal of Sound and Vibration, Vol. 237, Issue 3, 2000, p. 23-43.

