Abstract
In the article the mathematical models and results of research conducted at the intersection located on multilane artery in big city in Poland have been presented. The research allowed to describe the relationship between the speed of car vehicles and the occurrence of the tram tracks, which may be important in determining the empirical capacity of intersections located on multilane arteries in cities. This dependency may be used when updating the methods of estimation of the capacity of road intersections in Poland [1], what is the original achievement of the authors. Moreover, the results of research of noise emission in the aspect of speed change of car vehicles and the occurrence of the tram tracks have been presented. In addition, the research problem is of particular importance in the process of selecting the intersection type, which is very important during the planning and organizing traffic at intersections located in cities, where the development of the tram infrastructure is being observed.
1. Introduction
Functioning of transport system is determined by the quality of service realized by infrastructure of different transport branches. In case of road transport, the intersections are very important. These objects are usually the bottlenecks in the network. Therefore, the correct selection of the intersection type is really important in the planning and projecting process of infrastructure. The influence on selecting of intersection type is dependent on a lot of factors, that can be grouped into five groups like: factors related with traffic conditions, infrastructure, environment, traffic safety and costs. In addition, in the process of selecting the intersection type, it is necessary to provide services to other users of the transport system, i.e. pedestrians, cyclists or tram passengers.
However, it should be borne in mind that between individual intersection users occurs interactions, which are visible even if one of them is not currently present at the intersection. This situation is especially noticeable in relation to vehicles that pass the intersection through the tram infrastructure it may influence the values of the characteristics describing the factors, on which the choice of the type of road crossing is dependent. That is why, it is important to know the functional relationships describing these interactions. In the paper, the impact of tram tracks on the speed of vehicles, as well as the noise emission level, have been presented.
2. Literature review
Designing transport systems requires taking into account many factors and is a multi-criteria issue. Currently, the trend prevails for the design of environmentally friendly solutions that are also effective in terms of time, reliability and quality of service [2]. The functioning of the transport system is associated with its negative impact on the environment. It is mainly manifested by the emission of exhaust gases into the atmosphere and excessive noise.
The problem of the impact of noise on the lives of residents in the city is described by Badyda [3], Fuks K. [4], Galilea de Dios Ortuzar [5]. The conducted research concerns mainly the impact of noise on health, as well as the methods of measuring or noise levels depending on the road conditions. There are also many models of noise emission estimation, can be mentioned here: CoRTN [6], RLS 90 [7], TRANEX [8], or used in this work FHWA [9]. These models were often developed several or dozens years ago, but they are updated and often used in practice.
Car vehicle speed as one of the most important measures of traffic condition assessment is the subject of many studies [10-15]. It is a factor affecting both quantitative parameters (e.g. capacity, efficiency) [16, 17] and qualitative ones (e.g. reliability, safety, characteristics of the natural environment), and describing the functioning of point and linear elements of transportation network [18-20]. In the case of an intersection with traffic lights, average speed is an important parameter affecting its capacity and efficiency. Bonneson [21] developed speed models as a function of the vehicle position in the queue at the signalized intersection. In turn, in other publications [22, 23] the queue discharge speed has been expressed in relation to the time since the start of the displayed green period.
When analyzing the vehicle speed at intersections with traffic lights, it was found that it depends on many geometric and traffic factors of the infrastructure elements (e.g. width of lanes, slope of the inlet, turning radius, generic structure of vehicles, traffic organization) [24]. The quality and condition of the surface may also be included among the factors that significantly affect the speed of traffic. The presence of a tram tracks may therefore significantly worsen the traffic conditions at the intersection.
Average speed of vehicle passing the intersection is one of the most important determinant of saturation flow rate [24, 25]. The speed may decrease by up to 20-30 km/h while passing tram tracks, when the surface is in poor condition. The saturation flow rate is lower by 15 % compared to intersections with rubber-cord surface at tram crossings instead of asphalt [26].
In the method of estimating the capacity of intersection with traffic lights used in Poland [27] the impact of passing through the tram tracks is taken into account. In this method, the following formula (Eq. (1)) is used to calculate the saturation flow rate Sr of a collision-free turn maneuver:
where: S0 – base saturation flow rate [veh/hg], w – width of lane [m], i – average slope of the inlet in the distance of 30 m from the stop line [%], δi – coefficient of slope direction [-], δk – coefficient of lane location [-], δt – coefficient of passing through the tram tracks [-], R – turning radius [m], uc – share of heavy vehicles [-].
As may be seen, the Eq. (1) takes into account the occurrence of the tram tracks through the coefficient δt, which is equal to 1, when the trajectory of vehicles intersects the tram tracks or to 0, if it does not cross the tram tracks or its technical condition does not significantly reduce the speed of vehicles. This is due to the fact that passing through the tram tracks may cause the change in the speed of vehicles, and thus it may affect the capacity of intersection.
Fig. 1 presents the values of saturation flow rate for collision-free turn maneuver both for occurrence (S+tr) and for lack of tram tracks (S-tr) in trajectories of car vehicles assuming the same values of the other geometric and traffic characteristics of the intersection (lane width, slope of the inlet, direction of the slope, coefficient of lane location). Such calculations have been made using the formula (Eq. (1)). According to the regulation [28] it was assumed that the turning radius is between 10 and 40 m.
Fig. 1Saturation flow rate for collision-free turn maneuver as a function of turning radius with different share of heavy vehicles for predetermined base saturation flow rate
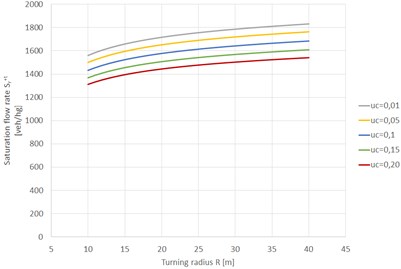
a) With tram tracks and for base saturation flow rate S0= 1900 veh/hg
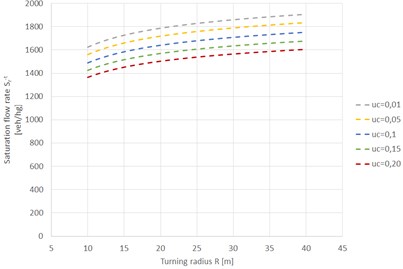
b) Without tram tracks and for base saturation flow rate S0= 1900 veh/hg
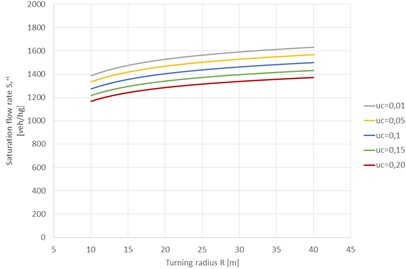
c) With tram tracks and for base saturation flow rate S0= 1700 veh/hg
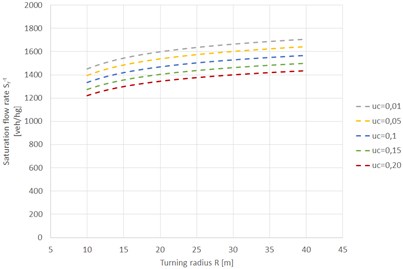
d) Without tram tracks and for base saturation flow rate S0= 1700 veh/hg
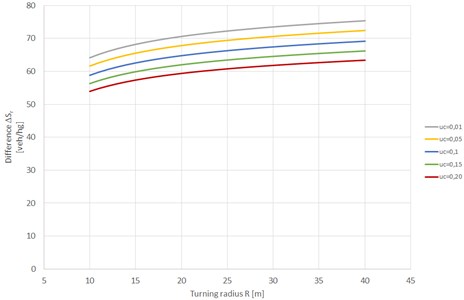
According to the formula (Eq. (1)), the difference ∆ between saturation flow rates without and with the tram tracks in trajectories of car vehicles depends only on the turning radius and on the share of heavy vehicles, and it is equal to:
Depending on the adopted limits of the turning radius, the difference takes values from about 20 veh/hg to about 80 veh/hg (Fig. 2). The increase in the share of heavy vehicles affects the decrease in saturation flow rates. The highest saturation flow rate occurs with the smallest share of heavy vehicles irrespective of the base saturation flow rate.
It is worth noting that the method of estimation of intersection capacity used in Poland [27] does not take into account the occurrence of tram tracks when determining the saturation flow rate for straight maneuver, collision left turn maneuver or collision maneuver with pedestrian traffic.
The author of the dissertation [29] identified 71 factors affecting the capacity of different kinds of intersections, i.e.: intersections with traffic lights, intersections without traffic lights and roundabouts. The factors were then classified into several groups: geometric, traffic, associated with the control method, associated with the organization of traffic, exploitation and weather, local and other. The classification has been made on the basis of the analysis of the capacity estimation methods used in the USA [30], Germany [31], Canada [32] and Poland [1, 27, 33]. However, it should be noted that in these methods factors related to the passing through the tram track by car vehicle are not always taken into account.
Fig. 2Difference between saturation flow rates without and with tram tracks in trajectories of car vehicles
3. Research method
Prior to performing the studies, a research objects have been chosen, which due to the specificity of the studied phenomenon had to be characterized by the following: state of saturation for individual lanes and inlets, traffic lights, tram tracks, small values of slopes of inlets, the same width of lanes on all inlets.
In order to exclude the influence of the turning radius on vehicle speed, only vehicles traveling in a straight maneuver have been examined. The measurement was carried out in four cross-sections in order to take into account the influence of the distance between the tram tracks and the stop line on the speed of car vehicles.
Fig. 3 shows photographs of example of the intersection with the organization of traffic on the inlets and the numbers and names of individual inlets. The measurement points and cross-sections have been also presented.
Fig. 3Location of measurement points and cross-sections [own source on the basis of 34]
![Location of measurement points and cross-sections [own source on the basis of 34]](https://static-01.extrica.com/articles/20087/20087-img6.jpg)
In Fig. 3, four measuring points, in which car vehicle speed measurements were performed, have been marked in the circles. Therefore:
• in measurement point No. 1, the speeds of the car vehicles entering from inlet No. 1, going straight and passing through the tram tracks have been recorded (measurement at a distance of 10 m from the stop line),
• in measurement point No. 2, the speeds of the car vehicles entering from inlet No. 2, going straight and passing through the tram tracks have been recorded (measurement at a distance of 30 m from the stop line),
• in measurement point No. 3, the speeds of the car vehicles entering from inlet No. 3, going straight and not passing through the tram tracks have been recorded (measurement at a distance of 10 m from the stop line),
• in measurement point No. 4, the speeds of the car vehicles entering from inlet No. 3, going straight and not passing through the tram tracks have been recorded (measurement at a distance of 30 m from the stop line).
The study was conducted on one of the days of the week, representative for the carrying out traffic measurements [35-37]. The measurements have been carried out using a video camera and a Bushnell Velocity manual device (series 101911). The measurement with the use of a video camera was used to determine traffic volumes, as well as to identify queues of car vehicles and the generic structure of the traffic. In turn, the Bushnell Velocity device was used to measure the instantaneous vehicle speed. The measurement accuracy of this device is +/–2 km/h. The speed has been recorded for the first six vehicles in the queue. Position the vehicle was determined at the begin of the green signal.
4. Result of research and their analysis
To determine the speed distributions in relation to the vehicle positions in the queue for individual measurement points, only the signaling cycles were analyzed, in which a homogeneous generic structure of traffic has been observed (only passenger cars were present).
4.1. Distribution of instantaneous vehicle speeds – results for each measurement point
Fig. 4 present the distribution of instantaneous vehicle speeds for individual measurement points in relation to the vehicle position in the queue.
4.2. Distribution of instantaneous vehicle speeds – results for each measurement point
The test results presented in Tables 1 to 4 show the average speed for successive vehicles in the queue, standard deviation and coefficient of variation as well as the size of the sample, which was the basis for determining these statistical measures. In turn, in Figs. 5 to 8 the relationships between the average speed and the position of the vehicle in the queue for individual measurement points have been shown.
Table 1Analysis of average speed for successive vehicles in the queue for measurement point No. 1 (measurement at a distance of 10 m from the stop line for car vehicle passing through the tram tracks)
Vehicle position in the queue | Size of the sample [–] | Average speed [km/h] | Standard deviation of the speed [km/h] | Coefficient of variation [–] |
1 | 60 | 19,1 | 2,6 | 0,136 |
2 | 60 | 20,1 | 2,8 | 0,139 |
3 | 60 | 21,2 | 3,6 | 0,170 |
4 | 54 | 21,1 | 3,1 | 0,147 |
5 | 50 | 21,4 | 2,8 | 0,131 |
6 | 42 | 21,9 | 2,8 | 0,128 |
Table 5 presents mathematical models that describe the dependence of average speed on the position of car vehicle in the queue for the analyzed cases.
For each measurement point, four types of mathematical models were formulated, i.e.: exponential, linear, logarithmic, and power. The coefficient of determination was assumed as a measure of the choice of the best-fit model. For three measurement points (except measurement point No. 4), the values of the coefficient indicate strong correlation. Functions with the largest values of the correlation coefficient are: logarithmic for measurement point No. 1 ( 0,9578) and for measurement point No. 2 ( 0,9986). In turn, for measurement point No. 3 ( 0,969) it is a linear function.
Fig. 4Distribution of instantaneous vehicle speeds for individual measurement points in relation to the vehicle position in the queue
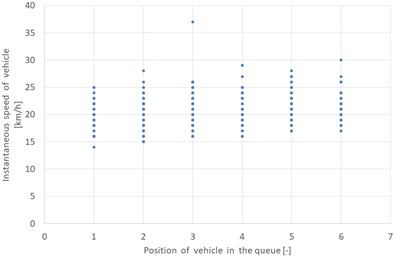
a) Measurement point No. 1 – passing through the tram tracks (measurement at a distance of 10 m from the stop line)
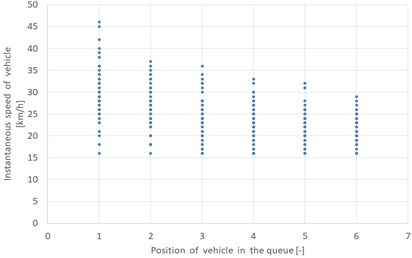
b) Measurement point No. 2 – passing through the tram tracks (measurement at a distance of 30 m from the stop line)
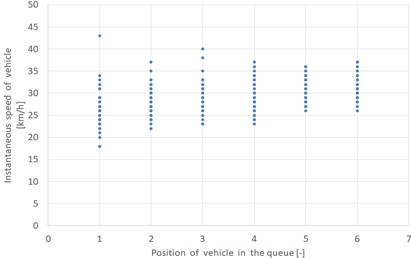
c) Measurement point No. 3 – without passing through the tram tracks (measurement at a distance of 10 m from the stop line)
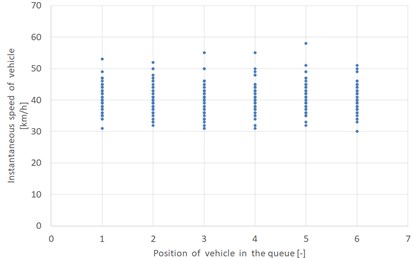
d) Measurement point No. 4 – without passing through the tram tracks (measurement at a distance of 30 m from the stop line)
Fig. 5Results for measurement point No. 1
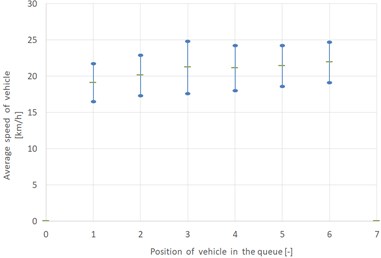
a) Average speed in relation to the position of the car vehicle in the queue
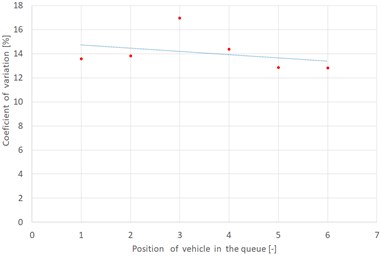
b) Coefficient of variation in relation to the position of the car vehicle in the queue
However, for measurement point No. 4, the value of the coefficient of determination indicates the lack of correlation between the average vehicle speed and the position of the vehicle in the queue. For each of the analyzed mathematical models the value of the coefficient of determination is small, not exceeding 0,1. However, this is the natural phenomenon, because the measurement took place at a distance of 30 m from the stop line for vehicles not passing through the tram track, then the drivers reach their intended speed.
Table 2Analysis of average speed for successive vehicles in the queue for measurement point No. 2 (measurement at a distance of 30 m from the stop line for car vehicle passing through the tram tracks)
Vehicle position in the queue | Size of the sample [–] | Average speed [km/h] | Standard deviation of the speed [km/h] | Coefficient of variation [–] |
1 | 59 | 29,7 | 6,2 | 0,209 |
2 | 59 | 26,5 | 4,8 | 0,181 |
3 | 59 | 24,3 | 4,7 | 0,193 |
4 | 59 | 22,8 | 4,0 | 0,175 |
5 | 59 | 21,8 | 4,0 | 0,183 |
6 | 59 | 21,1 | 3,5 | 0,166 |
Fig. 6Results for measurement point No. 2
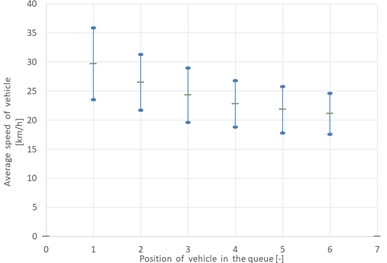
a) Average speed in relation to the position of the car vehicle in the queue
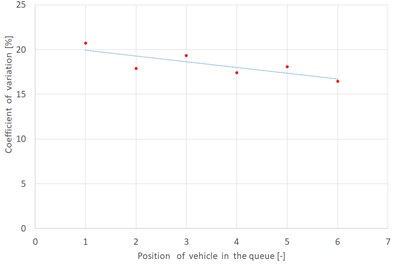
b) Coefficient of variation in relation to the position of the car vehicle in the queue
Table 3Analysis of average speed for successive vehicles in the queue for measurement point No. 3 (measurement at a distance of 10 m from the stop line for car vehicle not passing through the tram tracks)
Vehicle position in the queue | Size of the sample [–] | Average speed [km/h] | Standard deviation of the speed [km/h] | Coefficient of variation [–] |
1 | 59 | 26,2 | 3,9 | 0,149 |
2 | 59 | 27,9 | 3,0 | 0,108 |
3 | 59 | 28,6 | 3,6 | 0,126 |
4 | 59 | 29,0 | 3,4 | 0,117 |
5 | 59 | 30,7 | 2,7 | 0,088 |
6 | 59 | 31,4 | 2,8 | 0,089 |
Fig. 7Results for measurement point No. 3
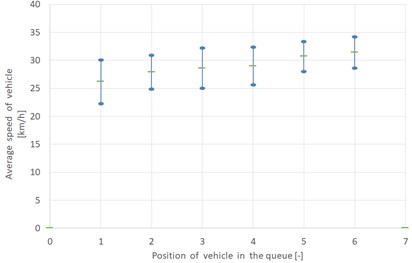
a) Average speed in relation to the position of the car vehicle in the queue
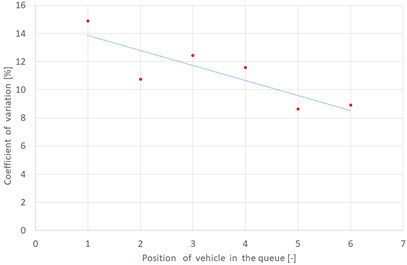
b) Coefficient of variation in relation to the position of the car vehicle in the queue
Table 4Analysis of average speed for successive vehicles in the queue for measurement point No. 4 (measurement at a distance of 30 m from the stop line for car vehicle not passing through the tram tracks)
Vehicle position in the queue | Size of the sample [–] | Average speed [km/h] | Standard deviation of the speed [km/h] | Coefficient of variation [–] |
1 | 61 | 40,5 | 4,4 | 0,109 |
2 | 61 | 40,5 | 4,3 | 0,106 |
3 | 61 | 40,0 | 4,7 | 0,118 |
4 | 61 | 40,7 | 4,3 | 0,106 |
5 | 61 | 41,0 | 4,5 | 0,110 |
6 | 61 | 40,4 | 4,1 | 0,101 |
Fig. 8Results for measurement point No. 4
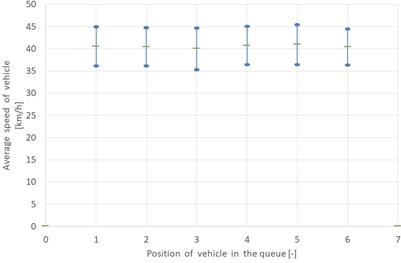
a) Average speed in relation to the position of the car vehicle in the queue
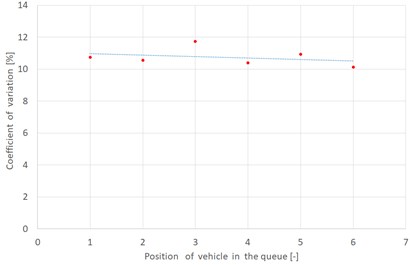
b) Coefficient of variation in relation to the position of the car vehicle in the queue
Table 5Mathematical models describing the dependence of average speed on the position of car vehicle in the queue
No | Name of the analyzed case (measurement point) | Type of function | Mathematical model | Coefficient of determination |
1 | Measurement at a distance of 10 m from the stop line for car vehicle passing through the tram tracks (measurement point No. 1) | Exponential | 0,8618 | |
Linear | 19,02 | 0,8704 | ||
Logarithmic | 19,148 | 0,9578 | ||
Power | 0,9576 | |||
2 | Measurement at a distance of 30 m from the stop line for car vehicle passing through the tram tracks (measurement point No. 2) | Exponential | 0,9525 | |
Linear | 30,227 | 0,9306 | ||
Logarithmic | 29,736 | 0,9986 | ||
Power | 0,9966 | |||
3 | measurement at a distance of 10 m from the stop line for car vehicle not passing through the tram tracks (measurement point No. 3) | Exponential | 0,9659 | |
Linear | 25,487 | 0,9690 | ||
Logarithmic | 25,943 | 0,9349 | ||
Power | 0,9462 | |||
4 | measurement at a distance of 30 m from the stop line for car vehicle not passing through the tram tracks (measurement point No. 4) | Exponential | 0,0779 | |
Linear | 40,339 | 0,0786 | ||
Logarithmic | 40,396 | 0,0453 | ||
Power | 0,0446 | |||
– average speed of car vehicles, passing through the tram tracks; – average speed of car vehicles, not passing through the tram tracks; – position of car vehicle in the queue (). | ||||
The best-fit models for all measurement points have been shown in Fig. 9.
Fig. 9The best-fit models for all measurement points
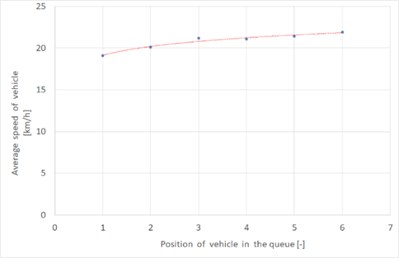
a) Measurement point No. 1 – passing through the tram tracks (measurement at a distance of 10 m from the stop line)
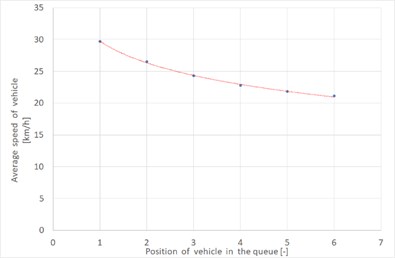
b) Measurement point No. 2 – passing through the tram tracks (measurement at a distance of 30 m from the stop line)
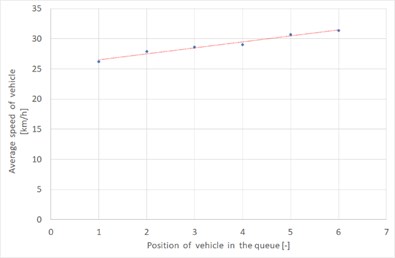
c) Measurement point No. 3 – without passing through the tram tracks (measurement at a distance of 10 m from the stop line)
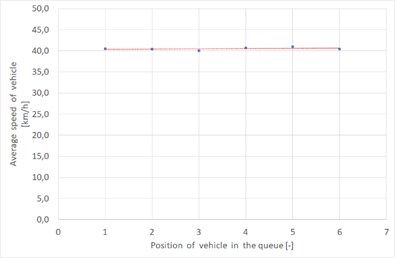
d) Measurement point No. 4 – without passing through the tram tracks (measurement at a distance of 30 m from the stop line)
4.3. Comparison of the average speed of vehicles passing through the tram tracks with the average speed of vehicles not passing through the tram tracks
The main aim of research performed at different distances from tram tracks was to compare and to analyze the impact of tram tracks on speed in relations to the position of the vehicle in the queue. Fig. 10 presents the distribution of average speeds in relation to the individual positions in the queue for vehicle, which passed through the tram tracks and for those that did not pass the tracks at a distance of 10 meters from the stop line.
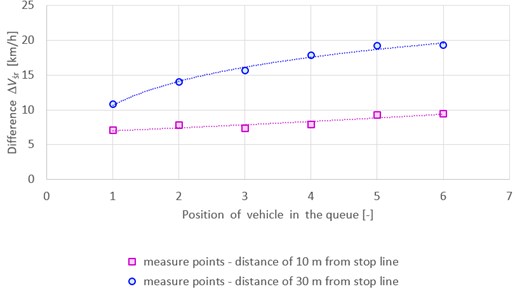
Fig. 10 shows the impact of tram tracks located at a distance of 10 m from the stop line on the speed of car vehicles. The values of the tested feature for both vehicles passing through and vehicles non-passing through the tram tracks increase for successive vehicles in the queue. In addition, the differences between the speeds of vehicles non-passing through the tram tracks and non-passing tracks increase for each subsequent vehicle in the queue. In addition, the differences between the speeds of vehicles not passing through the tram tracks and the speeds of vehicles passing the tracks are growing up for each subsequent vehicle in the queue. For the first vehicle in the queue, the value of this difference 7.1 [km/h] and for the sixth vehicle – 9.5 [km/h]. This tendency may be seen in Fig. 12.
Fig. 11 presents the distribution of average speeds in relation to the individual positions in the queue for vehicle, which passed through the tram tracks and for those that did not pass the tracks at a distance of 30 meters from the stop line.
Fig. 11 shows the impact of the occurrence of the tram tracks on the speeds of vehicles located within 30 m from the stop line. The values of the average speeds of vehicles passing through the tram tracks indicate the need to slow down before them. In turn, in the case of absence of the tram tracks, there are no observed declines in the speed associated with the need for braking before the tracks, because the drivers of vehicles reach their intended speed.
Fig. 10The best-fit models for all measurement points
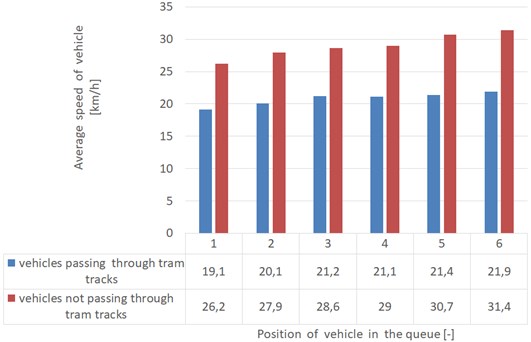
Fig. 11The comparison of average speed for each position of vehicles in the queue – 30 m from stop line
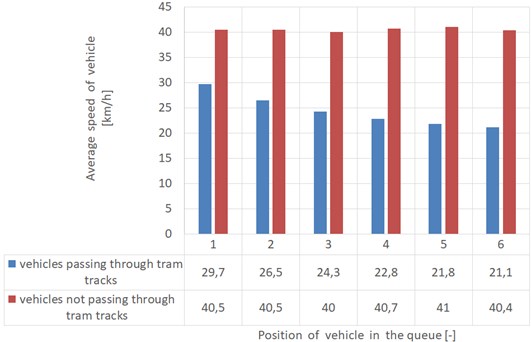
Therefore, it is observed that the differences between the average speeds of vehicles passing through the tram tracks and speeds of vehicles non-passing through the tracks increase for each subsequent vehicle in the queue. For the first vehicle in the queue the value of the discussed difference is 10.8 [km/h] and for the sixth vehicle – 19.3 [km/h] (for the distance of 30 m from the stop line). Fig. 12 shows the differences in relation to the position of the vehicle in the queue for two measurement distances from the stop line. Based on the measurement results, it is possible to build mathematical models presented in Table 6.
Table 6Mathematical models describing the dependence of differences between average speed of vehicles passing through the tram tracks and speed of vehicles not passing the tracks on the position of car vehicle in the queue
No. | Distance from the stop line [m] | Mathematical model | Coefficient of determination |
1 | 10 | 0,8324 | |
2 | 30 | 0,9878 | |
, – average speed of car vehicles, non-passing through the tram tracks; – average speed of car vehicles, passing through the tram tracks; – position of car vehicle in the queue (). | |||
It may be seen that these differences are greater when the measurement took place at a distance of 30 m than at a distance of 10 m.
Fig. 12Differences between average speed of vehicles passing through the tram tracks and speed of vehicles not passing the tracks for two distances from stop line: 10 m and 30 m
5. Noise emission in terms of charge of the speed of car vehicles passing through tram tracks
Considerations regarding noise emissions are particularly important due to the quality of life of urban residents and its direct impact on their health and well-being. In addition, the results of research related to noise emission are especially relevant from the point of view of designing new and modernizing existing transportation systems. The use of predictive models to determine the level of noise emission from a given transportation system allows for shaping it in accordance with the idea of sustainable development. This applies to both systems in urban and non-urban areas [38-40].
The speed change caused by passing through the tram tracks induces a change in the noise emission level. Based on the conducted research, it is possible to determine the impact of such situation on the noise emitted under different conditions.
When analyzing the available models of noise emission from road traffic, it may be concluded that in most cases they accurately reflect the actual noise levels [41, 42]. By adopting one of the methods for estimating noise emission, it is possible to determine the hourly level of its intensity for selected assumptions. The considerations in this issue have been based on the FHWA model [9]. This model allows to determine the noise level as an hourly average sound pressure emitted by a passing vehicle of th type.
According to the methodology included in the description of the FHWA model, noise emission estimation is based on the following relationship (Eq. (3)):
where – basic noise value determined for a distance of 15 m from the road above ground level [dB], – volume of traffic, consisting of vehicles of th type [veh/h], – average speed of vehicles of th class [km/h], – distance from the calculation point to the traffic lane in the orthogonal projection [m], – distance from the center of the road to the point of calculation [m], – the period of time, for which the noise level is calculated [h], – parameter of side, it ranges between 0 and 1, , – angles between the line perpendicular to the road section from the calculation point, they take values from the range <–90; 90>, – correction factor due to barriers such as buildings or screens.
The total noise level for all vehicle types may be determined by the formula (Eq. (4)):
where – noise level of passenger car vehicles, – the noise level of light goods vehicles, – the noise level of heavy goods vehicles.
Therefore, in order to conduct an analysis of the impact of speed change on the noise change for different cases, general assumptions have been made, as shown in Table 7. The parameter of side was set at 0.5 and the angles at –90 and 90 degrees. Table 8 presents the results obtained from the model for defined variants. In turn, the graph in Fig. 13 depicts differences in noise levels. The calculations have been carried out for four speed levels, i.e. for the first vehicles in the queue at a distance of 10 m and 30 m from the stop line, separately for the car vehicles passing through the tram tracks and non-passing through the tram tracks.
Table 7Variants and assumed values of selected parameters necessary to determine the noise level
W1 | W2 | W3 | W4 | |
Passenger car vehicles – C [veh/h] | 400 | 400 | 400 | 400 |
Light goods vehicles – LGV [veh/h] | 20 | 20 | 20 | 20 |
Heavy goods vehicles – HGV [veh/h] | 10 | 10 | 10 | 10 |
Speed [km/h] | 19,1 | 26,7 | 29,7 | 40,5 |
Distance [m] | 15 | 15 | 15 | 15 |
Distance [m] | 25 | 25 | 25 | 25 |
Distance [m] | 40 | 40 | 40 | 40 |
Table 8Noise emission levels for defined variants
Estimated parameters | Distance | W1 | W2 | W3 | W4 |
[dB] | 58,0 | 60,9 | 61,8 | 64,7 | |
54,7 | 57,5 | 58,5 | 61,3 | ||
51,6 | 54,5 | 55,4 | 58,3 | ||
[dB] | 51,1 | 55,2 | 56,5 | 60,03 | |
47,8 | 51,8 | 53,1 | 56,9 | ||
44,7 | 48,8 | 50,1 | 53,9 | ||
[dB] | 50,6 | 54,1 | 55,2 | 58,4 | |
47,3 | 50,8 | 51,9 | 55,1 | ||
44,2 | 47,7 | 48,8 | 52,0 | ||
[dB] | 55,9 | 58 | 58,7 | 60,6 | |
52,6 | 54,7 | 55,4 | 57,3 | ||
49,5 | 51,6 | 52,3 | 54,3 |
Fig. 13Noise emission levels for determined variants according to individual vehicle types
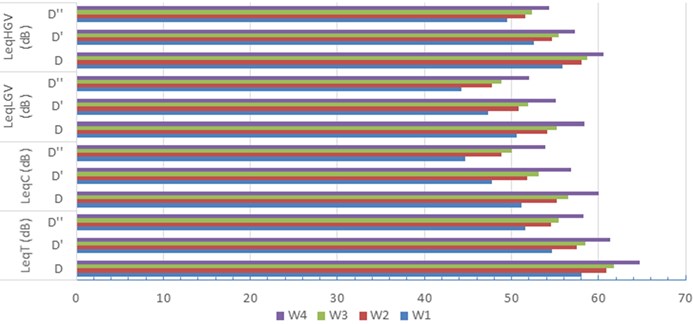
Reduction of speed resulting from the necessity of the passing by the car vehicle through the tram tracks also reduces the emitted noise. However, this is a relatively small change. It should be emphasized that these conclusions have been formulated only on the basis of speed change. Further detailed studies are needed to correct the determined noise emission levels. It should be taken into account that the passing through the tram tracks also generates additional noise. Research in this direction would allow more objectively estimate the total noise emitted both by the passing through the tram tracks and by the reduction in speed. It is possible that the decreasing of noise due to the speed reduction will be compensated or even exceeded by the noise generated as a result of passing through the tracks. However, confirmation of the above statements requires additional empirical studies conducted in real traffic conditions.
6. Conclusions
The subject of the analysis was the impact of tram tracks situated at a distance of 10 and 30 meters from the stop line on the speed of vehicles passing through the intersection located on multilane artery in the city. Based on the conducted research, it was found that the presence of tram tracks causes a decrease in the speed of car vehicles, which is dependent on the position of the vehicle in the queue at the beginning of the green signal and on the distance of the stop line from the tracks.
The analysis of mathematical models presented in Table 5 allows to state that for measurements carried out at a distance of 10 m from the stop line (regardless of passage through the tracks), the speed increases exponentially for each vehicle position in the queue. Subsequent vehicles waiting in the queue for the green signal travel more and more distance to the measurement point, so they may develop a higher speed. However, the presence of a tram tracks results in a decrease in the average speed of vehicles in the analyzed cross-section. For example, according to a model that takes into account the passage of vehicles through a tram tracks, the first vehicle crosses the measurement point at 18,65 km/h. In turn, according to the model, which does not take into account the passage through the tracks, the first vehicle in the queue exceeds the cross-section with the speed of 25,22 km/h.
The results of measurements carried out at a distance of 30 m from the stop line show different relationships between the variables studied. There is a decrease in speed with the increase of the position of the vehicle in the queue. Drivers passing through the tram tracks reduce their speed directly in front of them, trying to keep a safe distance to the vehicle ahead. Such knowledge may be used, among others, while planning temporary traffic organization [43, 44] and conducting road safety analyzes [45, 46].
For comparison of the speed distribution at different measurement points, the arithmetic mean and the standard deviation were determined. Small values of the coefficient of variation allow to take the average values as reliable. Therefore, it may be stated that the measurements reflect the actual traffic conditions occurring on the tested intersection.
The presented research results confirmed the impact of tram tracks on the speed of vehicles. However, to be able to generalize this thesis, similar tests should be carried out at other intersections with traffic lights and tram tracks. In addition, it is worth investigating the relationships between vehicle speed and other factors associated with tram tracks (e.g. distance between tracks and stop line, quality of tracks). Therefore, the issue presented in the article opens up a wide field of research. The test results should be included in the update of the method of estimating intersection capacity with traffic lights used in Poland.
References
-
Chodur J., et al. The Method of Estimating the Capacity of Non Signalized Intersections. GDDKiA, Warsaw, 2004.
-
Jacyna Gołda I., Izdebski M., Podviezko A. Assessment of efficiency of assignment of vehicles to tasks in supply chains: A case study of a municipal company. Transport, Vol. 32, Issue 3, 2017, p. 243-251.
-
Badyda A. J. Environmental hazards on the part of transport. Science, Vol. 4, 2010, p. 115-125.
-
Fuks K., Moebus S., Hertel S., Viehmann A., Nonnemacher M., Dragano N., Hoffmann B. Long-term urban particulate air pollution, traffic noise, and arterial blood pressure. Environmental Health Perspectives, Vol. 119, Issue 12, 2011, p. 1706-1711.
-
Galilea P., De Dios Ortuzar J. Valuing noise level reductions in a residential location context. Transportation Research Part D: Transport and Environment, Vol. 10, Issue 4, 2005, p. 305-322.
-
Calculation of Road Traffic Noise. Department of Transport, HMSO, UK, 1988.
-
Guidelines for Noise Control on Roads. BM für Verkehr, Bonn, 1990, (in German).
-
Gulliver J., Morley D., Vienneau D., Fabbri F., Bell M., Goodman P., Fecht D. Development of an open-source road traffic noise model for exposure assessment. Environmental Modelling and Software, Vol. 74, 2015, p. 183-193.
-
Barry T. M., Reagan J. A. FHWA Highway Traffic Noise Prediction Model. Report No. FHWA-RD-77-108, US DOT, FHWA, Office of Research, Office of Environmental Policy, Washington, USA, 1979.
-
Lighthill M. J., Whitham G. B. On kinematic waves: II. A theory of traffic flow on long crowed roads. Proceedings of the Royal Society of London, Series A, Vol. 229, Issue 1178, 1995, p. 317-345.
-
Richards P. I. Shockwaves on the highway. Operations Researches, Vol. 4, Issue 1, 1956, p. 42-51.
-
Drew D. Traffic Flow Theory and Control. Mc Graw – Hill Book Company, New York, 1968.
-
Pyza D., Jachimowski R., Jacyna Gołda I., Lewczuk K. Performance of equipment and means of internal transport and efficiency of implementation of warehouse processes. Procedia Engineering, Vol. 187, 2017, p. 706-711.
-
Żochowska R. Selected issues in modelling of traffic flows in congested urban networks. The Archives of Transport, Vol. 29, Issue 1, 2014, p. 77-89.
-
Żochowska R., Sobota A. Fundamental Diagram of Traffic Flow – Theory and Practice. Logistyka, Poznań, 2014, p. 11862-11871.
-
Tanga T., Zhanga J., Liub K. A speed guidance model accounting for the driver’s bounded rationality at a signalized intersection. Physica A: Statistical Mechanics and its Applications, Vol. 473, 2017, p. 45-52.
-
Hall F., Hall L. Capacity and speed-flow analysis of the queen Elizabeth way in Ontario. Transportation Research Record, Vol. 1287, 1990, p. 108-118.
-
Szczuraszek T. The Speed of Vehicle on Free Flow Traffic Conditions. The Committee of Civil and Water Engineering of the Polish Academy of Sciences, Warszawa, 2008.
-
Pamuła W. Reliability and Security. Wydawnictwo Politechniki Śląskiej, Gliwice, 2011.
-
Pandian S., Gokhale S., Kumar Ghoshal A. Evaluating effects of traffic and vehicle characteristics on vehicular emissions near traffic intersections. Transportation Research Part D., Vol. 14, 2009, p. 180-196.
-
Bonneson J. A. Modeling queued driver behavior at signalized junctions. Transportation Research Record, Vol. 1365, 1992, p. 99-107.
-
Akcelik R., Besley M. Microsimulation and analytical methods for modelling urban traffic. Conference on Advance Modeling Techniques and Quality of Service in Highway Capacity Analysis, Truckee, California, USA, 2001.
-
Akcelik R., Besley M. Queue discharge flow and speed models for signalized intersection. Proceedings of 15th International Symposium on transportation and traffic flow theory, Adelaide, 2002.
-
Fornalchyk Y., Mohyla I., Hilevy V. The saturation flow volume as a function of the intersection passing speed. Transport Problems, Vol. 8, Issue 3, 2013, p. 43-51.
-
Romanov A. G. Road Traffic in Cities: Regularities and Tendencies. Transport, Moscow, 1984.
-
Dolgushin D. Multivariable Modeling of Road Traffic on the Base of the Cellular Automata. Ph.D. Thesis, Omsk Siberian State Automobile and Highway Academy (SibADI), 2011.
-
Tracz M., et al. The Method of Estimating the Capacity of Signalized Intersections. GDDKiA, Warszaw, 2004.
-
Polish National Regulation of the Minister of Transport and Maritime Economy on Technical Conditions for Public Roads and Their Location, 1999.
-
Sobota A. Functional Analysis of Four-Approach Intersections Located on Multilane Arteries in Case of Traffic Congestion. Ph.D. Thesis, UTP University of Science and Technology, Bydgoszcz, 2012.
-
Highway Capacity Manual. Transportation Research Board, Highway Capacity Committee, Washington, 2010.
-
Highway Capacity Manual. FGSV, Cologne, 2001, (in German).
-
Teply S., Allingham, D. I., Richardson, D. B., Stephenson B. W. Canadian Capacity Guide for Signalized Intersections. Third Edition, Institute of Transportation Engineers, Washington, 2008.
-
Tracz M., et al. The Method of Estimating the Capacity of Roundabout. GDDKiA, Warsaw 2004.
-
Internet Maps of Spatial Information System of Katowice, http://mapserver.um.katowice.pl/kjarc /mapviewer.jsf.
-
Sobota A., Molecki A. Days to take measurements. How to choose a day and time interval to make an analysis of traffic volume to the roads of I and II technical class in cities. Autostrady, Vol. 6, 2008, p. 17-22.
-
Daganzo C. Fundamentals of Transportation and Traffic Operations. Pergamon, New York, 1997.
-
Garber N. J., Hoel L. A. Traffic and Highway Engineering. Fifth Edition, Cengage Learing, Stamford, 2015.
-
Jacyna Gołda I. Evaluation of operational reliability of the supply chain in terms of the control and management of logistics processes. Safety and Reliability: Methodology and Applications, CRC Press Taylor & Francis Group, 549, p. 558-2015.
-
Jacyna Gołda I., Gołębiowski P., Izdebski M., Kłodawski M., Jachimowski R., Szczepański E. The evaluation of the sustainable transport system development with the scenario analyses procedure. Journal of Vibroengineering, Vol. 19, Issue 7, 2017, p. 5627-5638.
-
Jacyna M., Wasiak M., Lewczuk K., Kłodawski M. Simulation model of transport system of Poland as a tool for developing sustainable transport. Archives of Transport, Vol. 31, Issue 3, 2014, p. 23-35.
-
Quartieri J., Mastorakis N. E., Iannone G., Guarnaccia C., D’ambrosio S., Troisi A., Lenza T. L. L. A review of traffic noise predictive models. 5th WSEAS International Conference on Applied and Theoretical Mechanics, Puerto De La Cruz, Tenerife, 2009.
-
Garg N., Maji S. A critical review of principal traffic noise models: Strategies and implications. Environmental Impact Assessment Review, Vol. 46, 2014, p. 68-81.
-
Sobota A., Karoń G. The estimation of capacity of intersection during a temporary traffic organization. Science Zeszyty books of Silesian University of Technology, Vol. 74, 2012, p. 106-116.
-
Żochowska R. Multicriteria decision support in application to the planning of temporary traffic organization in urban networks. OWPW, Warsaw, 2015.
-
Jacyna M., Lewczuk K., Szczepański E., Gołębiowski P., Jachimowski, Kłodawski M., Pyza D., Sivets O., Wasiak M., Żak J., Jacyna Gołda I. Effectiveness of national transport system according to costs of emission of pollutants. Safety and Reliability: Methodology and Applications, 2014.
-
Żochowska R., Soczówka P. Method for identifying hazardous road locations at the intersection of tramlines and road traffic. Scientific Journal of Silesian University of Technology. Series Transport, Vol. 97, 2017, p. 201-213.
