Abstract
The problem of sustainable transport system development is currently very important and frequently analysed. It concerns promotion of such transport, which is efficient, cost effective and meets the expectations of the society. At the same time, such transport should minimize its negative impact on public health, environment, and economy or urban planning. This paper deals with selected aspects of developing sustainable transport systems and assessing them based on their negative impact on society (amount of pollution and noise emissions). A number of different scenarios for the sustainable transport system development were presented. In addition, a procedure for evaluating these scenarios was proposed (using appropriate evaluation criteria and indicators, including noise and pollutant emissions from road transport). The studies presented in this paper were carried out using the PTV Visum tool and transport models developed in it (e.g. EMITRANSYS or MTAW 2015).
1. Introduction
The development of sustainable transport systems is a frequently discussed subject in literature and recent scientific research. A sustainable transport system should be reliable, efficient, safety and at the same time should have a minimal environmental impact [1]. Unfortunately, due to the complexity of the transport system, experimenting on real systems is very difficult and very risky. Any organizational, technical or infrastructural changes should be preceded by a thorough analysis of the effects that will have on the functioning of the system, i.e. the economic, social and environmental effects. Limited availability and the ability to use analytical methods in the process of transport system development strategies impose the need to develop simplified models for particular transport modes. However, in order to accurately reflect the functioning of the real transport system, models should include the specific characteristics of each transport system and, above all, the interactions between them. Therefore, it is necessary to develop simulation models that allow for a comprehensive evaluation of the solutions that may affect the functioning of such systems.
The aim of the article is to present the possibility of using scenario analysis in simulation models and to show the impact of implemented changes on the functioning of the transport system and its impact on the environment. Researchers exploring these types of systems create models at different detail levels to fit the research objectives [2-5]. The development of transport systems, regardless of scale, requires tools to assist in modelling and taking into account different criteria. One such tool is the PTV VISUM environment that allows for the creation of dedicated models supporting the development of transport systems in the multiobjective and multivariate aspects. In this article, the research was based on the results obtained in the EMITRANSYS model. It is a model, prepared and tested as an efficient support for multiobjective analyses of sustainable transport systems development through scenario analysis.
Well-designed models can give a precise answer to the transport system's performance and impact on the environment and thus be used to shape transport policy. The impact of transport on the environment is an important criterion in planning activities aimed at improving its quality. The negative impact on the environment and the same on external costs of transport activities are dependent on transport volumes, a condition of infrastructure and technical equipment and also on a distribution of traffic into modes of transport within given network and expeditious switching it between the modes [6]. Evaluation of transport system development scenarios is a complex task and should be solved at the level of greater detail, including: required time, resources, regulations forcing or allowing switching modes, according to circumstances [2, 7-9].
Infrastructure investment has a major impact on improving the quality of transport systems. However, such actions are expensive and require spatial resources. This is especially important in urban systems where space is limited, and investments are very expensive. Therefore, it is necessary to take action on the proper organization of the traffic, to ensure the competitiveness of transport systems and to plan the nodal elements for goods and passenger transition between modes and places to enter and leave the system. This approach is characteristic for modern transport systems planning, which provides a harmonious interaction between different modes of transport [1, 7, 10-13].
Evaluation of the quality of the transport system requires defined criteria. These criteria cover the complexity of the transport system in an economic, social and environmental context. Each transport policy, whether a country or a region, determines the direction in which the system should be developed. Under the transport policy and the opportunities offered by the transport system, there are transport service providers whose offer is closely related to the quality of the transport system [2, 7, 14-15].
As a result, the growing demands of transport system users has led to the need to improve their operations and thus to build modern models that incorporate dynamic factors, including just in time strategies, increasing need of mobility and environmental constraints. Therefore, it is necessary to take into account the interests of all participants in the transport process. There are necessary significant improvements in terms of activities to reduce the negative impact of transport on the environment, i.e. harmful substances and noise emissions and their inclusion in external costs [1, 2, 15-17].
The article presents an example of an assessment of the urban transport system prepared on the base of MTAW 2015 model developed for Warsaw Traffic Research in 2015 in PTV VISUM. The experience gained through the development of the EMITRANSYS model has been used.
2. Scenario analysis
2.1. General assumptions
Long term European, national and regional transport policies are focused on establishing lasting interoperability between road transport and other modes, especially rail transport. Research on design of sustainable transport systems must be then in line with recommendations of the European Commission and international organizations [6]. In Poland freight and passenger segments are dominated by road and rail transport. Road transport is crucial for economy due to its features, but at the same time is the main source of transport-related air pollution and noise. Transport activities in EU generate about 28 % of carbon dioxide emitted to the atmosphere, in which road transport is responsible for about 84 % [18-19].
Increasing emission of pollutants and other disadvantages related to transport force change in thinking about transport planning, especially in particularly vulnerable areas like cities or natural areas [2, 14, 20]. International regulations offer tools for influencing transport planning like differentiated toll rates, which depend on the vehicle emission class. For example, the EURO 6 standard reduces nitrogen oxides by 80 % and particulate matter by 50 % compared to EURO 5 standard [18, 19].
Noise emissions from traffic pose an environmental problem of growing importance. Noise exposure is not only a disutility in the sense that it disturbs people; it can also result in health impairments and lost productivity and leisure. For example, cost of 75 dB noise exposure per year per person exposed in Poland is around 104 Euro [6].
Development of transport system is a complex decision problem embracing different points of view of limited resources. It must be supported by multi-variant and multi-faceted analysis of series of development scenarios, which reveals the rational way of proceeding. Carrying out reliable and advanced analysis requires dedicated tools. The tool should enable simulations under various conditions including social, economic, technical and ecological criteria formulated from the point of view of all participants of transport process.
2.2. Transport system development scenarios
Scenario analysis is used when system operation can be different under specific combinations of factors, dependent or independent on decision maker. During scenario analysis expected values of evaluation criteria are estimated after a given period of time. Scenario analysis is commonly used in business analyses, but when used to transport system development must be fitted to. The scenario method consists of a step, first of which is a description of examined system and specifying factors affecting it, and then outlining the development possibilities and justification of given decision situation. As a result, many potential images of the future are obtained [10, 15, 21-24].
Scenarios of the future situation in transport system include [23] overview of the state of system elements during established time, under projected volumes of goods or passengers, interpretation of predicted phenomena, their consequences and planned investment expenditures.
The advantage of scenario analyse is possibility of examining effects of decisions in variable conditions and their risk characteristics. It is used for studies on effectiveness of the investment projects, changes in law regulations, behaviour of buyers and providers of transport services, changes in stock vehicles stock and volumes with different initial data [22].
Scenario planning of transport systems implemented into dedicated tool is an important help for identifying risk factors and areas of uncertainty related to the activity of a particular industries, organizations, enterprises or market segments.
The literature review offers many types of scenario analyse [21-24]. Review of applied methods and their modifications in the practice of risk analysis was carried out by Bishop, Hines and Collins (2007), which identified eight groups of scenario techniques and their variants [10]. Taking into account the creation methodology and applicability to the analysis of transport systems, three main categories of techniques can be distinguished [21]:
1) Scenarios based on Intuitive Logics,
2) Scenarios based on Probabilistic Modified Trends – PMT,
3) Scenarios based on so called potential thinking (franc. La Prospective).
The systematics of scenarios for transport systems development includes: time horizon, mode of transport system, market segments, scope or purpose (Table 1).
Short-term scenarios are examined for operational tasks, while the long-term scenarios are set for strategic tasks. Both types are usually extended to optimistic realistic and pessimistic version according to probabilistic assumptions for parameters defining development of transport system. Scenario analyses involve economic and social-sociological determinants characteristic for a given region, province or country.
3. Procedure for scenario analysis
The procedure for scenario analysis is divided into three stages according to the systematic analysis (Fig. 1):
I – formulation of research objectives (technical, economic, social, environmental),
II – building a model (with appropriate tool or techniques) supporting scenario analyses,
III – evaluation of scenarios based on a multi-criterion evaluation of modelled situation.
The problem formulated for scenario analyses must take into account not only the set of goals to be achieved defined by evaluation criteria, but also the purpose of analyses at all. Long-term and short-term analysis of different types have different purposes resulting from technical, economic, organizational and legal determinants that should be taken into account when defining an appropriate model for the development of transport system (stage II of scenario analysis).
Especially the stage II (Fig. 1) is important and complex. Model must contain features of transport system common for all scenarios, be scalable and ensure a reasonable amount of certainty regarding the change in system elements.
Table 1Scenarios of analysing transport system development
Type of scenario | Long-term (more than 5 years) | Short-term (less than five years) | ||||
Uncertainty of factors | Optimistic | Pessimistic | Realistic | |||
Field of application | Commune (local) | District | Province/state | |||
Mode of transport | Road | Rail | Air | Two modes together | Three modes together | Other |
Segment of the market | Freight | Passenger | Public | Private | Other | |
Purpose | Traffic forecasts | Transport infrastructure development forecasts | Financial analysis of transport investments | Other | ||
Users: | Marshal’s offices | Units of local government | Provincial governments | State administrative offices | ||
Evaluation criteria | Technical | Organizational | Ecological | Quality | Other | |
4. Integrated index evaluation for the scenario development
An important step in the procedure is establishing a system of criteria in relation to decision goals. Criteria represent interests of decision makers and system users. The set of criteria should reflect key aspects of undertaken decisions and be universal for all scenarios. Assessing effects (positive or negative) of scenarios, with regard to uncertainty factors, boils down to formal comparative analysis of different scenarios of development according to the values of defined criteria.
Different methods can be applied to select best development option, but multicriteria methods are preferred as long as they provide objective evaluation and possibility of matching seemingly incomparable criteria. Multicriteria methods led to aggregated criterion used for the evaluation of the variant of development scenario of the transport system.
To define this criterion, set of development scenarios of transport system is defined as { 1, 2, …, }. Each scenario includes different variants of solution (Fig. 1) given by set , , …, }.
Scenarios are described by goals and criteria measuring those goals. Set of goals is defined as { 1, 2, …, }. Each goal is described by weight (0, 1); weights sum up to 1. Goals are defined by sets of criteria measuring them {1, 2, …, , …, }. Each criteria is described by weight (0, 1); weights sum up to 1 for each goal .
Then, weight of particular criteria for whole evaluation system for given scenario is expressed as . Criteria are normalized to allow their comparison. is then a normalized assessment of th scenario according to th criterion in th goal. On that base aggregated evaluation index of development scenario for transport system can be defined as follows:
And used for evaluation purposes.
Fig. 1Algorithm for scenario research Source: [14]
![Algorithm for scenario research Source: [14]](https://static-01.extrica.com/articles/19275/19275-img1.jpg)
5. Application of scenario analysis for evaluation of proecological solutions in the aspect of infrastructure investments – case study
5.1. General assumption
Pro-ecological effects of selected infrastructure investments under changing demand for transport services can be examined with scenario analyses methods. The Warsaw Agglomeration Transport Model 2015 (MTAW [5, 9, 25]) was used as a base for scenario analyses in which levels of harmful emissions related to traffic distributions were observed. The model was developed in PTV VISUM for Warsaw Traffic Research 2015 by consortium of PBS company, Cracow University of Technology and Warsaw University of Technology. It covers complete Warsaw agglomeration, including city centre, suburbs and region and uses actual data on traffic.
The traffic was distributed to three vehicles categories: cars, light goods vehicles (LGV) and heavy goods vehicles (HGV). Traffic distribution was done for the morning peak hours (07:00-08:00). Analysis on MTAW were made for three scenarios. First scenario represented year 2015, second 2016, and third represented 2020. For each scenario:
1) The volume of vehicle streams,
2) The structure of vehicles adequate for urban areas,
3) The state of mapped and parameterized infrastructure,
4) Were known and adequate for the surveyed year.
For each year the demand for transport (expressed in number of vehicles) was forecasted. 42 predictive variables were estimated for each communication region in a model. Variables were selected for all 18 travel motivations in passenger traffic and 16 motivations in freight traffic. Structure of vehicles was standardized to the structure in HBEFA module in PTV VISUM. The structure was described by parameters including type of vehicle, engine capacity, fuel type or emission standard.
The road network model was mapping the state of network in particular years. As a result, all possible sections of roads (existing and planned) were included, but some of them were inactive if not present in actual network (e.g. in the first scenario one of eight road bridges was closed, in the third scenario full South Warsaw Ring Road is opened [8]).
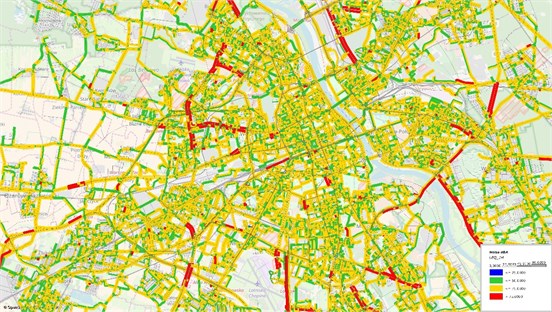
The analysis was subjected to assess the impact of changes in the state of infrastructure and traffic volumes on the harmful emissions level and noise. The following substances were considered: carbon dioxide (CO2) – blue in Fig. 2, carbon monoxide (CO) – violet, hydrocarbons (HC) – red, nitrogen oxides (NOx) – yellow and particulate matter (PM) – green. For every link of the transport network, the equivalent noise level in dBA was presented. Noise level was divided into four groups (≤ 25 dBA; ≤ 50 dBA; ≤ 75 dBA, > 75 dBA).
5.2. Results for defined development scenarios
Traffic distribution for 2015 in MTAW 2015 is shown in Fig. 2.
The level of emission of harmful compounds for the first scenario (2015) is shown in Fig. 3. Total emission is presented in Table 2.
Noise level for 2015 is shown in Fig. 4.
Fig. 2Traffic distribution for 2015. Source: MTAW 2015 in PTV VISUM
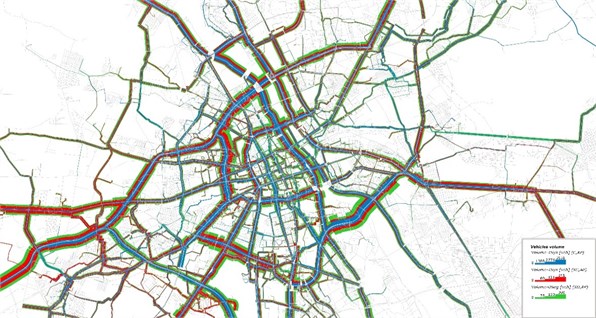
Fig. 3Emission of pollutants for the traffic distribution in first scenario. Source: MTAW 2015 in PTV VISUM
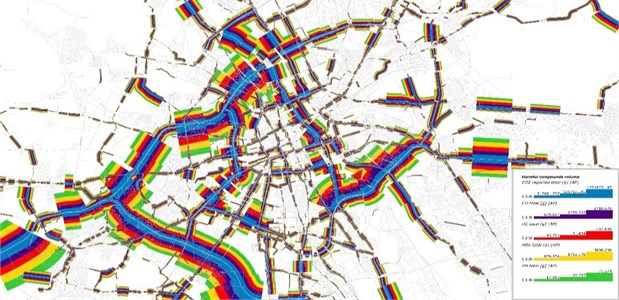
Table 2Emissions of pollutants for the traffic distribution in first scenario
Harmful compound | Cars | LGV | HGV |
CO2 [g] | 311 595 087 | 25 295 480 | 53 174 954 |
CO [g] | 567 254 | 29 788 | 113 762 |
HC [g] | 43 039 | 4 533 | 7 884 |
NOx [g] | 621 714 | 105 510 | 318 413 |
PM [g] | 10 925 | 4 090 | 5 822 |
Source: MTAW 2015 in PTV VISUM | |||
Fig. 4Noise level for the traffic distribution in first scenario. Source: MTAW 2015 in PTV VISUM
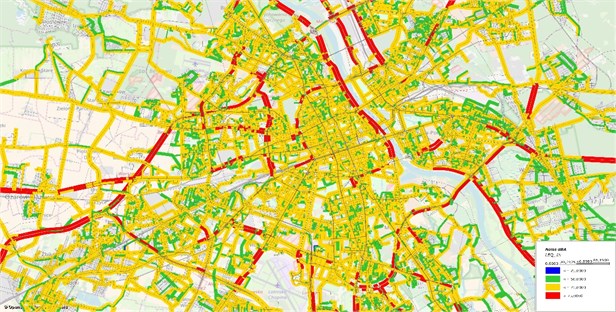
Fig. 5Traffic distribution for 2016. Source: MTAW 2015 in PTV VISUM
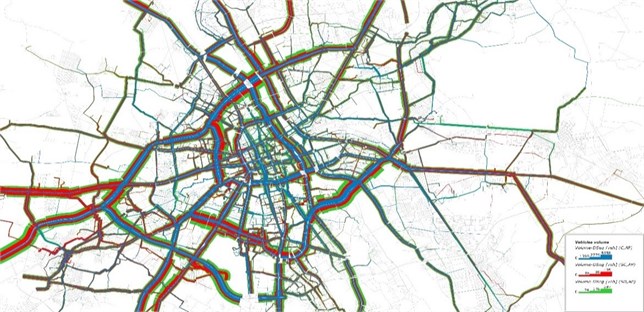
Traffic distribution for 2016 in MTAW 2015 is shown in Fig. 5.
The level of emission of harmful compounds for the second scenario (2016) is shown in Fig. 6. Total emission is presented in Table 3.
Noise level for 2016 is shown in Fig. 7.
Table 3Emissions of pollutants for the traffic distribution in second scenario
Harmful compound | Cars | LGV | HGV |
CO2 [g] | 321 754 869 | 25 329 559 | 53 600 135 |
CO [g] | 540 066 | 26 265 | 105 318 |
HC [g] | 40 124 | 4 172 | 6 543 |
NOx [g] | 600 366 | 101 103 | 263 722 |
PM [g] | 10 113 | 5 145 | 3 272 |
Source: MTAW 2015 in PTV VISUM. | |||
Fig. 6Emission of pollutants for the traffic distribution in second scenario. Source: MTAW 2015 in PTV VISUM
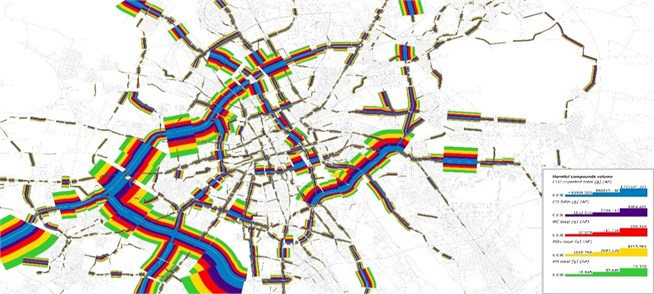
Fig. 7Noise level for the traffic distribution in second scenario. Source: MTAW 2015 in PTV VISUM
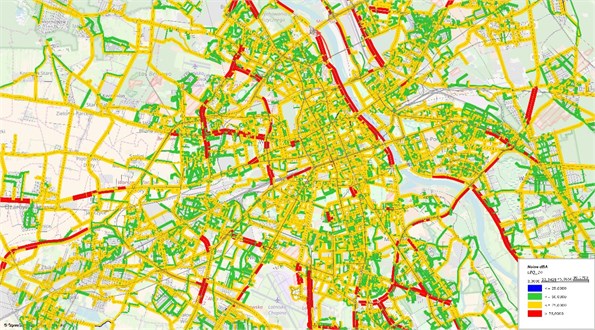
Fig. 8Traffic distribution for 2020 Source: MTAW 2015 in PTV VISUM
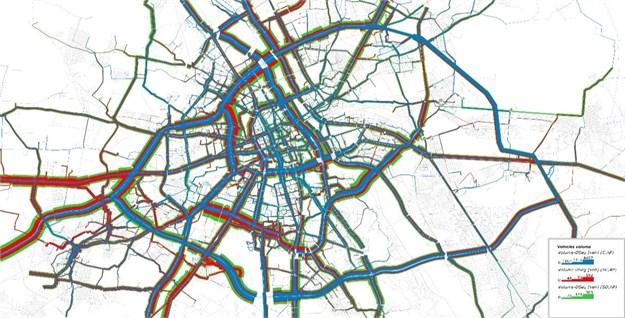
Traffic distribution for 2020 in MTAW 2015 is shown in Fig. 8.
The level of emission of harmful compounds for the third scenario (2020) is shown in Fig. 9. Total emission is presented in Table 4.
Noise level for 2020 is shown in Fig. 10.
Obtained results show that infrastructure development in 2016 has contributed to reduced negative environmental impact of transport in the city in comparison to the first scenario as a reference point. This does not apply to carbon dioxide emissions for passenger cars and goods vehicles, as well as particulate matter for LGV. Infrastructure development in 2020 seems to be beneficial because the impact on the environment is considerably lower than in other options. The largest decrease was noted for HGV sector.
Table 4Emissions of pollutants for the traffic distribution in third scenario
Harmful compound | Cars | LGV | HGV |
CO2 [g] | 2 85 394 853 | 21 181 387 | 52 305 337 |
CO [g] | 404 999 | 15 724 | 85 782 |
HC [g] | 28 769 | 2 679 | 3 922 |
NOx [g] | 439 007 | 67 698 | 136 668 |
PM [g] | 5753,075 | 2699,509 | 1504,012 |
Source: MTAW 2015 in PTV VISUM. | |||
Fig. 9Emission of pollutants for the traffic distribution in third scenario. Source: MTAW 2015 in PTV VISUM
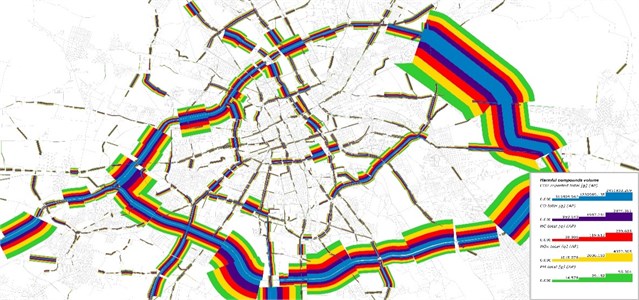
Fig. 10Noise level for the traffic distribution in third scenario. Source: MTAW 2015 in PTV VISUM
A detailed juxtaposition of values for 2016 compared to 2015 is presented in Table 5, while the values for 2020 compared to 2015 in Table 6. It should be noted that the peaks in emissions on particular sections result, among others, from traffic congestion (e.g. due to the modernization of two lanes on the three-lane road).
Percentage share of active transportation network links in the whole number of active links with appropriate noise level is shown in Table 7.
Obtained results show that infrastructure development in 2016 has contributed to reduced share of active links in transport network with noise level more than 50 dBA. The equivalent level of noise significantly decreased. Comparing 2015 and 2020, it should also be noted that the number of active links with a noise level greater than 50 dBA is also reduced.
Table 5Harmful compounds emission level in 2016 compared to 2015
Harmful compound | Cars | LGV | HGV |
CO2 [g] | 103 % | 100 % | 101 % |
CO [g] | 95 % | 88 % | 93 % |
HC [g] | 93 % | 92 % | 83 % |
NOx [g] | 97 % | 96 % | 83 % |
PM [g] | 93 % | 126 % | 56 % |
Source: MTAW 2015 in PTV VISUM. | |||
Table 6Harmful compounds emission level in 2020 compared to 2015
Harmful compound | Cars | LGV | HGV |
CO2 [g] | 92 % | 84 % | 98 % |
CO [g] | 71 % | 53 % | 75 % |
HC [g] | 67 % | 59 % | 50 % |
NOx [g] | 71 % | 64 % | 43 % |
PM [g] | 53 % | 66 % | 26 % |
Source: MTAW 2015 in PTV VISUM. | |||
Table 7Percentage share of transportation network links
Noise level | 2015 | 2016 | 2020 |
≤ 25 dBA | 0,2 % | 0,3 % | 0,1 % |
≤ 50 dBA | 26,4 % | 37,6 % | 34,7 % |
≤ 75 dBA | 70,8 % | 59,8 % | 63,3 % |
> 75 dBA | 2,7 % | 2,4 % | 1,9 % |
Source: MTAW 2015 in PTV VISUM. | |||
6. Conclusions
The research presented in this article shows, that scenario analysis enables carrying out multifaceted analyses of cargo and passengers flow in the transport network. To perform such analysis, the simulation tools are required. One of the universal tools that can be used in this type of problem is the PTV VISUM environment. This tool allows analysis of scenarios of transport system takin into account different technological, economic and environmental criteria. Noise level considered in this article can be used as one of these criteria (EMITRANSYS, MTAW 2015). Extensive software capabilities share the possibility of detailed analysis and evaluation of alternative traffic distribution in different scenarios of development. Such analyses can then facilitate decision-making, regarding transport infrastructure investment in a given area of the transport network. Additional economic projections may indicate the direction of changes in the demand for transport services.
Because each participant in the decision-making process can represent different partial criteria functions, it is difficult to indicate a solution that will satisfy each transport system user. That is why the multi-criteria methods gain interests according to assessment of decision based on contrary criteria, which represent different expectations of transportation network users. In practice, the implementation of the multi-criteria objective function is problematic, because a mutual conformity of partial criteria of the objective function appear only in rare cases.
Thus, the inclusion into the multi-criteria mathematical programming model more than a single criterion will not lead to the unequivocally best solution from the point of view of all the partial criteria at the same time.
References
-
Jacyna M., Wasiak M., Lewczuk K., Kłodawski M. Simulation model of transport system of Poland as a tool for developing sustainable transport. Archives of Transport, Vol. 31, Issue 3, 2015, p. 23-35.
-
Jacyna M., Wasiak M. Multi-criteria evaluation of variants of infrastructure investments in transport. Scientific Works, Transportation, Vol. 63, 2007, p. 119-124.
-
Sawicki P., Kiciński M., Fierek S. Selection of the most adequate trip-modelling tool for integrated transport planning system. Archives of Transport, Vol. 37, Issue 1, 2016, p. 55-66.
-
Wasiak M., Kłodawski M., Lewczuk K., Jachimowski R., Szczepański E. Chosen aspects of simulation model to designing proecological transport system. Journal of KONES Powertrain and Transport, Vol. 21, Issue 4, 2014, p. 525-532.
-
Żochowska R. Selected issues in modelling of traffic flows in congested urban networks. Archives of Transport, Vol. 29, Issue 1, 2015, p. 77-89.
-
Update of the Handbook on External Costs of Transport. European Commission, Final Report, 2014.
-
Jacyna M. Some aspects of multicriteria evaluation of traffic flow distribution in a multimodal transport corridor. Archives of Transport, Vol. 10, Issues 1-2, 1998, p. 37-52.
-
Kucharski R., Gentile G. Indirect observation of rerouting phenomena in traffic networks – case study of Warsaw bridges. Archives of Transport, Vol. 32, Issue 4, 2015, p. 29-41.
-
Ambroziak T., Jachimowski R., Pyza D., Szczepański E. Analysis of the traffic stream distribution in terms of identification of areas with the highest exhaust pollution. Archives of Transport, Vol. 32, Issue 4, 2015, p. 7-16.
-
Bishop P., Hines A., Collins T. The current state of scenario development: an overview of techniques. Foresight, Vol. 9, Issue 1, 2007, p. 5-25.
-
Jachimowski R., Kłodawski M., Lewczuk K., Szczepański E., Wasiak M. Implementation of the model of proecological transport system. Journal of KONES Powertrain and Transport, Vol. 20, Issue 4, 2013, p. 129-139.
-
Jacyna Gołda I., Lewczuk K., Szczepański E., Gołębiowski P. Distribution of Traffic in the Transport Network Using the EMITRANSYS Model in the Context of Transport System Development Scenarios. Publishing House of the Warsaw University of Technology, Warsaw, 2014.
-
Magnanti T. L., Wong R. T. Network design and transportation planning: model and algorithm. Transportation Science, 1984, https://doi.org/10.1287/trsc.18.1.1.
-
Chamier Gliszczyński N., Bohdal T. Mobility in urban areas in environment protection. Rocznik Ochrona Środowiska/Annual set The Environment Protection, Vol. 18, 2016, p. 387-399.
-
Jacyna Gołda I., Żak J., Gołębiowski P. Models of traffic flow distribution for various scenarios of the development of proecological transport system. Archives of Transport, Vol. 4, Issue 32, 2014, p. 17-28.
-
Jacyna M., Lewczuk K., Szczepański E., Gołębiowski P., Jachimowski, Kłodawski M., Pyza D., Sivets O., Wasiak M., Żak J., Jacyna Gołda I. Effectiveness of national transport system according to costs of emission of pollutants. Safety and Reliability: Methodology and Applications, CRC Balkema, 2014, p. 559-567.
-
Jacyna Gołda I. Evaluation of operational reliability of the supply chain in terms of the control and management of logistics processes. Safety and Reliability: Methodology and Applications, CRC Balkema, 2014, p. 559-567.
-
Merkisz J., Merkisz Guranowska A., Pielecha J., Nowak M., Jacyna M., Lewczuk K., Żak J. Exhaust emission measurements in the development of sustainable road transport. Journal of KONES Powertrain and Transport, Vol. 20, Issue 4, 2013, p. 277-284.
-
Merkisz J., Pielecha J., Radzimirski S. New Trends in Emission Control in the European Union. Springer Tracts on Transportation and Traffic, 2014.
-
Chamier Gliszczyński N., Bohdal T. Urban mobility assessment indicators in the perspective of the environment protection. Rocznik Ochrona Środowiska/Annual set the Environment Protection, Vol. 18, 2016, p. 670-681.
-
Bradfield R., Wright G., Burt G., Cairns G., Van Der Heijden K. The origins and evolution of scenario techniques in long range business planning. Futures, Vol. 37, 2005, p. 795-812.
-
Pisano G. P. Knowledge, integration, and the locus of learning: An empirical analysis of process development. Strategic Management Journal, Vol. 15, Issue 2, 1994, p. 85-100.
-
Van Der Heijden K., Bradfield R., Burt G., Cairns G., Wright G. The Sixth Sense: Accelerating Organisational Learning with Scenarios, Wiley, Chichester, 2002.
-
Worthington W. J., Collins J. D., Hitt M. A. Beyond risk mitigation: Enhancing corporate innovation with scenario planning. Business Horizons, Vol. 52, 2009, p. 444.
-
Jacyna M., Wasiak M., Kłodawski M., Gołębiowski P. Modelling of bicycle traffic in the cities using VISUM. Procedia Engineering, Vol. 187, 2017, p. 435-441.
Cited by
About this article
Ilona Jacyna Gołda prepared a description of the procedure for scenario analysis and integrated index evaluation for the scenario development. Piotr Gołębiowski prepared an emission level of pollutants for the traffic distribution in each scenarios. Mariusz Izdebski prepared general assumptions for scenario analysis and description of transport system development scenarios. Michał Kłodawski prepared a noise level for the traffic distribution in each scenarios. Roland Jachimowski prepared a conclusions about noise level and emission level of pollutants for the traffic distribution in each scenarios. Emilian Szczepański prepared a traffic distribution for each analysed years.
