Abstract
To eliminate or reduce the sound in the buildings, sound insulators are used. In designing the buildings two points should be considered. The absorption and transfer of the sound are as the key points in this connection. Therefore, we should the materials in the buildings which are able to meet our needs to reduce sound pollution. These materials would absorb the sound and reduce it getting into the building. These materials are known as acoustic materials. The nonwovens are one of the most important acoustic materials. This paper reports the effect of different configurations of layers placed in the panels on their NAC.
1. Introduction
The acoustic materials which absorb some part of sound wave energy when it passes through them are known as sound absorbent. These materials are usually applied in a surrounded area to reduce the amplitude of the reflected sound waves. Nonwovens, fiberglass, rock-wool felts and foams are some acoustic materials [1].
As mentioned earlier, the surfaces of the rooms, halls, etc. through which the sound waves passes are covered by sound insulators. One of the vital points in connection with these acoustic covers is their thickness. The low volume or thin layers are more desirable and are preferred since it reduces the consumed materials. Therefore, using the porous materials or panels having configured layers is more desirable.
A lot of research work has been carried out on the effect of the parameters of the layers in the panels. In a work, the effect of textile density, fineness and cross section of the fibres on the sound absorption was studied [2]. The results of this research suggest that the finer fibres with irregular cross section are better sound absorbents. Another finding of this work shows that the higher dense textile materials absorb more sound.
The composites can also be suitable acoustic materials. The measurement of the coefficients of sound absorption of the composites containing PET and PP fibres, indicated the increase in the thickness of the layer, the sound absorption increases somewhat, and this property reduces when the density of the layers is increased [3].
2. Methods and materials
The majority of the research workers have applied two methods of tube impedance and reflection room to measure the sound properties of the fabrics.
The first method is used for small samples with 10 centimeter diameter, however the measurement procedure is not so suitable, as each frequency is measured on particular amount. Therefore, the frequency range of 1-1000 Hz has been tested; however the minimum range of 15-20 Hz should be used.
The reflection room method is used to measure the sound property of the acoustic material with larger dimensions [2].
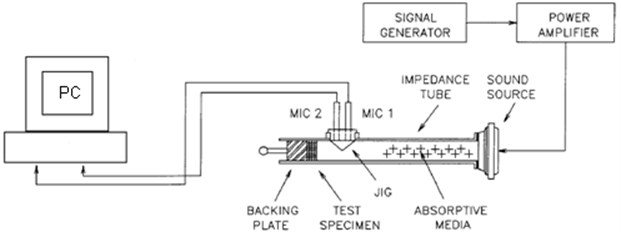
This method of measuring NAC based on ASTM E 1050[4] is used for measuring absorption of sound waves. The equipment was designed and manufactured at Textile Engineering Dept. of Yazd University. Fig. 1 shows this equipment and the set-up used to measure NAC. The equipment includes a steel tube with 80 centimeter long and 10 centimeter diameter, a signal generator, two microphones, a speaker and a PC/Laptop.
Fig. 1The tube impedance with 2 microphones and the set-up used to measure NAC
We produced the nonwoven layers by needle punching of 10 denier PET. The fibres were needle punched 180 strokes/cm2, under which the thickness of the layers became 50 mm and the samples weights were 700 g/cm2.
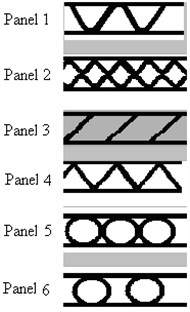
In continue of previous research work [5], the layers were used as raw materials in the panels. Six different panels with configurations shown in Fig. 2 were made. Then the panels were cut as circles with 9 centimeter diameter from random places in the panels. Table-1 illustrates the configurations of the panels and their NAC at different frequencies.
Fig. 2The configurations of nonwoven layers used in the panels
3. Results and discussion
Generally speaking when a sound wave has an incident to an acoustic material, one of three following cases may occur:
1) Some part of the sound is reflected,
2) Some part of the sound passes,
3) Some part of the sound is absorbed.
Fig. 3 shows the above mentioned cases. When sound is absorbed during passing through a material the acoustic energy is transformed into heat. As the sound enters in the fibrous materials, due to pressure of the sound, the air molecules inside the empty spaces of the material will be oscillated with the same frequency of the relevant sound wave. These vibrations lead to friction dissipations. The change in the passage way of the sound wave and the phenomenon of expansion and contraction of the sound wave throughout the irregular pores in the material, result in dissipating the movement magnitude. Due to stimulation of the sound waves, the air molecules in the pores are expanded and contracted which causes the temperature to vary.
To investigate the sound absorption of the panels, shown in Fig. 2, they were tested under frequencies of 250, 500, 1000 and 1600 Hz. The incident and reflective signals in the tube impedance were saved by PC for next process. The data were processed using MATLAB software and NAC of the samples were determined. Table 1 shows NAC of the panels at the mentioned frequencies.
Fig. 3Three cases may occur for an incident sound wave to a surface
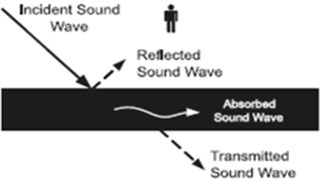
Table 1The panels and their NAC at different frequencies
1600 Hz | 1000 Hz | 500 Hz | 250 Hz | Panel No. |
0.71 | 0.81 | 0.72 | 0.85 | 1 |
0.79 | 0.82 | 0.85 | 0.75 | 2 |
0.70 | 0.78 | 0.67 | 0.64 | 3 |
0.90 | 0.94 | 0.91 | 0.89 | 4 |
0.82 | 0.84 | 0.79 | 0.83 | 5 |
0.79 | 0.83 | 0.90 | 0.84 | 6 |
As mentioned before, comparing the reflective signals from the surface of the sample with the initial signal generated by signal generator indicates that the amplitude of two signals are different. The first microphone illustrates the incident waves, while the second microphone shows the resultant wave due to combination of the incident and reflective waves. Fig. 4 and Fig. 5 illustrate the signals recorded by microphones 1 and 2 respectively.
Fig. 4The signal recorded by microphone no. 1, located near sound source on the tube
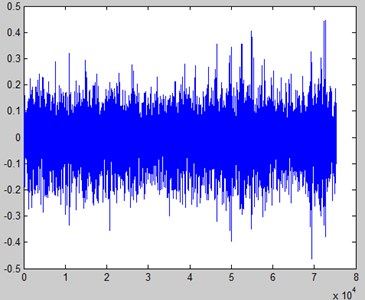
Fig. 5The signal recorded by microphone no. 2, located near the sample holder on the tube
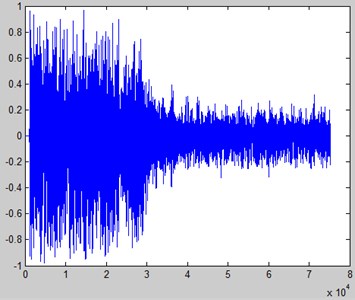
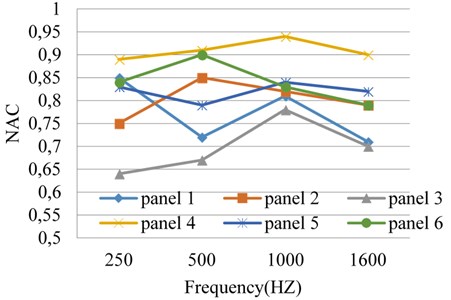
Fig. 6 indicates the variation of NAC in six panels at different frequencies. As can be observed from this figure, the behaviour of panels can be classified in two groups. While NAC of panels 2 and 6 increases at 500 Hz in comparison with 250 Hz, NAC of panels 1 and 5 decrease. Another point which can be seen from this figure is that NAC of the most panels are roughly similar at 1000 Hz, although some of them increase and some of them decrease compared with their NAC at 500 Hz. It also can be observed that NAC of all panels have decreased at 1600 Hz in comparison with NAC of the panels at 1000 Hz.
Considering Fig. 6, indicates the panel no. 4 has the highest NAC, although other panels had a good performance. A statistical investigation using Duncan-Test suggest the panels are different and the difference between their NAC is significant. This test is based on the mean of NAC in the panels which can be calculated from following relation:
Fig. 6The effect of layer configuration on NAC of the panels
4. Conclusions
Analyzing NAC of the samples suggests the thickness of the panels and the portion of the air in the panels play a vital role on their acoustic property. In fact, NAC of the panels were dependent on the applied configuration of layers in the relevant panel. It was observed that the panel 3 has lowest NAC and panel 4 has the highest NAC among panels.
References
-
Russel S. J. Hand Book of Nonwoven. Woodhead Publication, 2007.
-
Tascan M., Vaghn E. A. Effects of total surface area and fabric density on the acoustical behavior of needle punched nonwoven fabrics. Textile Research Journal, Vol. 78, Issue 4, 2008, p. 289-296.
-
Lou C., Lin J., Su K. Recycling polyester and polypropylene nonwoven selvages to produce functional sound absorption composites. Textile Research Journal, Vol. 75, Issue 5, 2005, p. 390-394.
-
Standard Test Method for Impedance and Absorption of Acoustical Materials Using a Tube, Two Microphones, and a Digital Frequency Analysis System. ASTM E1050-12, 2012.
-
Mirjalili S. A., Mohammad Shahi M. Investigation on the acoustic characteristics of multi-layer nonwoven structures. Part 1 – multi-layer nonwoven structures with the simple configuration. Fibres and Textiles in Eastern Europe, Vol. 20, Issues 3-92, 2012, p. 73-77.

