Abstract
The microscopic damage of materials will induce changes in the macroscopic mechanical characteristics of rock material. When simulating engineering problems using the discrete element method, to explore the macroscopic mechanical response of rock material, the microscopic parameters that match the macro material characteristics must be obtained. In this paper, the influence of macroscopic mechanical properties of rock materials is studied through the variation of microscopic parameters, and the quantitative relation between macroscopic parameters of rock material is discussed. The results show that, (1) In accordance with the order of influencing factors, the parameters affecting the elastic modulus of the specimen are parallel bond elastic modulus, particle contact modulus, and parallel bond stiffness ratio. (2) The Poisson’s ratio of the specimen was most influenced by the parallel bond stiffness ratio, and their relation was nonlinear. The influence of parallel bond modulus and friction factor on the Poisson’s ratio was negatively correlated. (3) The effect of particle contact stiffness ratio, parallel bond stiffness ratio, and particle contact modulus on the uniaxial compressive strength was less than that of the particle friction factor.
1. Introduction
Understanding the failure mechanism of rock materials is significant in mechanics theory, underground engineering construction, and geological disaster management [1-7]. Based on the non-continuum theory, rock materials can be divided into rigid particles. Numerical experiments using the discrete element method from the microscopic view have become an important breakthrough in solving medium failure, such as rock failure [8-11]. In 1971, Cundall [12] first proposed the discrete element method. The method is applied to mechanical problems of the joint system or block assembly under quasi-static or dynamic conditions and initially used to analyze the movement of a rock. Fan, Kulatilake [13] performed numerical stress analysis on blocks having multi flaws under uniaxial loading using PFC3D. Hamdi, Scholtès [14] investigated the mode I fracture propagation in brittle rocks using numerical simulations based on the discrete element method. However, when simulating engineering problems, the microscopic parameters that match the macro material characteristics must be obtained [15-18]. However, the process is time consuming. The microscopic view of materials and the macroscopic mechanical properties do not correspond with each other, and the rational determination of mechanical parameters has been a constantly difficult aspect in geotechnical engineering [14, 19, 20]. The complex and diverse join forms of the particles have resulted in the complex physical and mechanical properties and macroscopic mechanical responses of the geotechnical materials. Given the limitation of current testing technology, the mechanical parameters of the rock and soil materials cannot be accurately determined by indoor or field tests. Many scholars have established the qualitative relationship between the microscopic parameters and macroscopic parameters of adhesive particles [8, 21-23]. However, these studies mainly consider the influence of microscopic strength parameters on macroscopic mechanical properties. The properties of stiffness between particles affect the propagation properties of particles and hence influence the macroscopic appearance of the material. Therefore, the influence of the rigidity properties of a particle on the strength and deformation of the material is investigated. In this paper, a numerical simulation method of the particle flow discrete element (PFC) is adopted to study the quantitative effects of rock parameters on elastic modulus and strength.
2. Modeling
The microscopic damage of materials will induce a change in the macroscopic mechanical characteristics of rock material [24-28]. To explore the macroscopic mechanical response of rock material, we must establish the evolution law of the corresponding microscopic parameters. Therefore, the elastic modulus, Poisson’s ratio, stress-strain curve, and failure form of macroscopic mechanical properties are analyzed. In this paper, the influence of macroscopic mechanical properties of rock materials is studied through the variation of microscopic parameters, and the quantitative relation between macroscopic parameters of rock material is discussed. The mesoscopic parameters used in this paper are referred to the work by Bahaaddini, Sharrock [8], and Cundall [12] are shown in Table 1. Fig. 1 shows the numerical stimulation model with the height of 100 mm and diameter of 50 mm. The particle minimum diameter Dmin= 0.28 mm, the maximum particle size of the particle is Dmax= 0.42 mm, and the particle radius ratio is 1.5, which is randomly generated between the maximum radius and the minimum radius. Also, the uniform distribution can be followed. Moreover, embedded Fish language by servo control method is used to control the model of the “wall” movement to realize the uniaxial and conventional triaxial and the numerical simulation of the direct shear test [13, 29-33]. A parallel bond model is used for particle bonding and the parallel bonding radius is set to 1.0. The results of numerical simulation in this paper are compared with the indoor test results shown in Table 2 to verify the reliability of the model. In addition, the model used by Bahaaddini, Sharrock [8] was 42 mm in diameter and 82 mm in height. The result of numerical simulation was that the uniaxial compressive strength of the rock was USC = 27.45 mPa, the elastic modulus E= 4.25 GPa, and Poisson's ratio was 0.198. Table 2 shows that the numerical simulation results of this paper are smaller than those of the indoor test results, but the difference between them is very small.
Fig. 1Granular aggregate
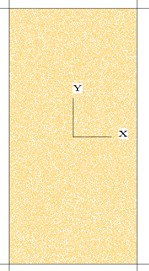
Table 1Microscopic parameters
Particle microscopic parameters | – | Parallel bonding microscopic parameters | – |
Particle density (kg/m3) | 2205 | Parallel bond elastic modulus (GPa) | 2.8 |
Particle contact modulus (GPa) | 2.8 | Normal strength (MPa) | 20±4.5 |
Friction factor μ | 0.6 | Shear strength (MPa) | 20±4.5 |
Particle contact stiffness ratio kn / ks | 1.45 | Parallel bond stiffness ratio kn/ ks | 1.45 |
Table 2Comparision for the simulation model and the results of laboratory model
– | – | USC (MPa) | E (GPa) | υ |
Laboratory results | Average value | 27.40 | 4.20 | 0.20 |
Numerical results | Average value | 26.64 | 4.28 | 0.17 |
Standard deviation | 0.76 | 0.08 | 0.03 | |
Standard deviation factor | 0.028 | 0.019 | 0.150 | |
Note: Standard deviation factor = (Standard deviation / Laboratory results) | ||||
3. Results and discussions
3.1. Effect of microscopic parameters on the elastic modulus
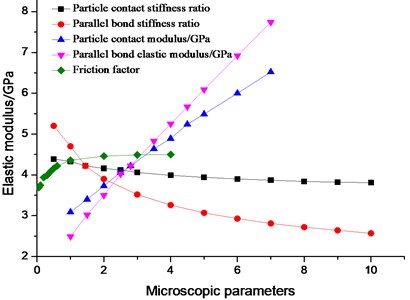
Through numerical simulation test and control variable method, different microscopic parameters were varied to obtain different macroscopic elastic moduli. The influence of the change of microscopic parameters on the elastic modulus E of the simulated specimens is shown in Fig. 2.
The influence of the particle contact modulus EC and the elastic modulus of the parallel bond ¯Ec on the elastic modulus of the specimen was the most significant and most linear. The effect of the elastic modulus of the parallel bond was the greatest, whereas that of the particle contact stiffness ratio kn/ks was the lowest. Under constant parameters, the elastic modulus E of the specimen increased with enlarging elastic modulus of the parallel bond ¯Ec, particle contact modulus EC, and friction factor μ. The elastic modulus of the specimen decreased with the particle contact stiffness ratio kn/ks and the parallel bonding stiffness ¯kn/¯ks. The effect of the parallel bond stiffness ratio ¯kn/¯ks and friction factor μ was relatively large at some stage. The stage for the ¯kn/¯ks was about 0.5-4 and 0.1 ≤ μ ≤ 1. In accordance with the order of influencing factors, the parameters affecting the elastic modulus E of the specimen are parallel bond elastic modulus ¯Ec, particle contact modulus EC, and parallel bond stiffness ratio ¯kn/¯ks. The influence factor of the elastic modulus of parallel bond ¯Ec on the elastic modulus E was greater than that of the particle contact modulus EC. With rising parallel bond stiffness ratio ¯kn/¯ks, the “rigidity” of the specimen gradually increased, and the “elasticity” gradually diminished, that is, the macro elastic modulus E decreased. On the basis of linear and nonlinear fitting, the relation of ¯Ec, EC, and ¯kn/¯ks with the elastic modulus E is as follows:
Fig. 2Influence of microscopic parameters on elastic modulus
3.2. Influence of microscopic parameters on Poisson’s ratio
We used the discrete element numerical simulation test to prepare the Poisson’s ratio of the specimen. The influence of the variation of each parameter on the sample’s Poisson’s ratio was compared (Fig. 3).
Fig. 3The influence of microscopic parameters on Poisson’s ratio
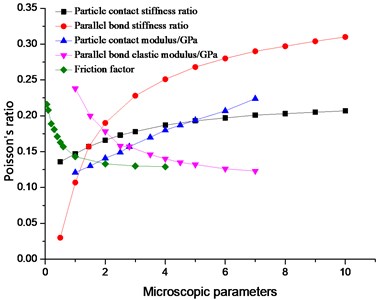
The Poisson’s ratio of the specimen was most influenced by the parallel bond stiffness ratio ¯kn/¯ks, and their relation was nonlinear. The Poisson’s ratio of the specimen rose with increasing parallel bond stiffness ratio. This is result was achieved because the parallel bond stiffness incrementally exceeded the shear stiffness; the number of normal cracks in the specimen was greater than that of the tangential crack. On the macro level, the transverse strain gradually enlarged, and the axial strain gradually reduced; as a result, the Poisson’s ratio rose. The particle contact modulus EC, parallel bond elastic modulus, and friction factor all influenced the Poisson’s ratio, but the effect was less than that of the parallel bond stiffness. The relation between the particle contact modulus (EC) and the Poisson’s ratio was linear. The properties of the specimen remained unchanged, and with the rising particle contact modulus EC, the overall performance and strength of the specimen were enhanced. Therefore, the Poisson’ ratio was augmented because of the parallel bond stiffness ratio ¯kn/¯ks, and the contact modulus EC was altered. With rising ¯kn/¯ks, the properties of the specimen changed, but the increased EC only improved the overall specimen performance. The influence of parallel bond modulus and friction factor on the Poisson’s ratio was negatively correlated. Similar to their influence on elastic modulus, the two factors were extremely influential at a certain stage. The elastic modulus of the parallel bond was approximately 1-4 GPa, and the friction factor was in the 0.1-1 stage. When the parallel bond elastic modulus ¯Ec > 4 GPa, the friction factor μ > 1, the change in Poisson’s ratio of the specimen was relatively slow. Fig. 3 reveals that the particle contact stiffness was less than kn/ks. However, with the rise in particle contact stiffness ratio of kn/ks, the Poisson’s ratio of the specimens gradually enlarged. This result was achieved because the axial strain diminished, and the Poisson’s ratio of the specimen gradually increased. The analysis showed that the factors that exerted the greatest impact on the specimens’ Poisson’s ratio (on the basis of impact factor order) are the parallel bond stiffness ratio ¯kn/¯ks, parallel bond elastic modulus, and particle contact modulus EC. Given the fitting, the effects of ¯kn/¯ks, ¯Ec, and EC to the Poisson’s ratio are as follows:
3.3. Influence of microscopic characteristic parameters on the uniaxial compressive strength
The effects of the microscopic parameters on the uniaxial compressive strength of uniaxial compressors were compared (Fig. 4). The effect of particle contact stiffness ratio of kn/ks, parallel bond stiffness ratio ¯kn/¯ks, and particle contact modulus EC on the uniaxial compressive strength was less than that of the particle friction factor μ. The effect of ¯kn/¯kson the uniaxial compressive strength was slightly smaller than that of the friction factor. The variation range of uniaxial compressive strength was 9.55 MPa and decreased with increasing ¯Ec. When kn/ks= 1, the uniaxial compressive strength obtained its maximum value of 28.48 MPa and decreased with increasing kn/ks= 1. When the parallel bond stiffness ratio ¯kn/¯ks= 2, the uniaxial compressive strength achieved its maximum value of 28 MPa. When 0 < ¯kn/¯ks ≤ 2, the uniaxial compressive strength increased with ¯kn/¯ks. However, when ¯kn/¯ks > 2, the uniaxial compressive strength was negatively correlated.
Fig. 4Influence of the microscopic parameters on uniaxial compressive strength
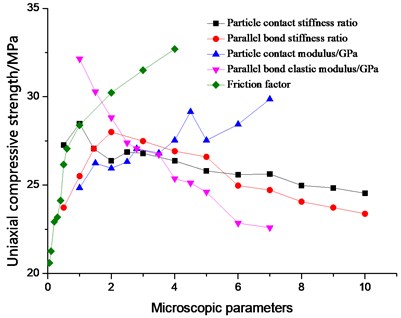
As shown in Fig. 4, the uniaxial compressive strength was positively correlated with the particle contact modulus EC but negatively correlated with the parallel bond elastic modulus, which was due to the parallel bonding model used in this paper. ¯Ec determines the nature of the specimen to a certain extent, and as the parameter’s value increases, the “rigidity” of the simulation specimen is simulated, and the mode of destruction becomes brittle failure. The increase in EC raises the compressive strength of the specimen, that is, the uniaxial compressive strength increases with enlarging EC. In these five microscopic parameters, μ exerted the most major influence on uniaxial compressive strength. With increasing μ between particles, the bite force between particles enlarges, and the peak strength of the material rises. Given the fitting, the effects of μ on the uniaxial compressive strength are as follows:
3.4. Effect of parallel bond strength on uniaxial compressive strength
The effects of the parallel normal bond strength and tangential bond strength on the uniaxial compressive strength were analyzed. The corresponding average bond strength ratio was 0.1-3.0 when the σ was 2-60 MPa. Meanwhile, the corresponding average bond strength ratio was 0.1-4.0 when the τ was 5-200 MPa. The influence of average bond strength on the macroscopic mechanical properties of specimens (Tables 3 and 4) and the parameter’s effect on uniaxial compression strength is shown in Fig. 5.
Table 3The effect of the average bond strength ratio on the macroscopic mechanical properties (τ= 20 MPa)
Average normal bond strength (MPa) | Average bond strength ratio | Uniaxial compressive strength (MPa) | Poisson’s ratio | Elastic modulus (GPa) |
2 | 0.1 | 2.73 | 0.148 | 4.67 |
4 | 0.2 | 6.90 | 0.152 | 4.23 |
6 | 0.3 | 10.66 | 0.154 | 4.22 |
8 | 0.4 | 13.39 | 0.153 | 4.22 |
10 | 0.5 | 16.76 | 0.153 | 4.22 |
12 | 0.6 | 19.71 | 0.154 | 4.22 |
14 | 0.7 | 21.85 | 0.155 | 4.22 |
16 | 0.8 | 23.67 | 0.156 | 4.22 |
18 | 0.9 | 25.68 | 0.157 | 4.22 |
20 | 1.0 | 27.06 | 0.157 | 4.22 |
25 | 1.25 | 28.97 | 0.157 | 4.22 |
30 | 1.5 | 31.53 | 0.158 | 4.22 |
40 | 2.0 | 34.41 | 0.158 | 4.22 |
50 | 2.5 | 36.47 | 0.159 | 4.22 |
60 | 3.0 | 37.83 | 0.159 | 4.22 |
Table 4The effect of the average bond strength ratio on the macroscopic mechanical properties (σ= 20 MPa)
Average tangential bond strength (MPa) | Average bond strength ratio | Uniaxial compressive strength (MPa) | Poisson’s ratio | Elastic modulus (GPa) |
200 | 0.1 | 33.98 | 0.158 | 4.21 |
100 | 0.2 | 33.88 | 0.158 | 4.22 |
67 | 0.3 | 34.00 | 0.158 | 4.22 |
50 | 0.4 | 34.61 | 0.158 | 4.22 |
40 | 0.5 | 34.38 | 0.158 | 4.22 |
35 | 0.57 | 33.35 | 0.158 | 4.22 |
30 | 0.67 | 32.70 | 0.158 | 4.22 |
25 | 0.8 | 29.86 | 0.158 | 4.22 |
20 | 1.0 | 27.06 | 0.157 | 4.22 |
15 | 1.33 | 23.11 | 0.156 | 4.22 |
10 | 2.0 | 17.05 | 0.154 | 4.22 |
8 | 2.5 | 14.57 | 0.153 | 4.22 |
5 | 4.0 | 10.03 | 0.153 | 4.21 |
Fig. 5Relation between bond strength ratio and uniaxial compressive strength
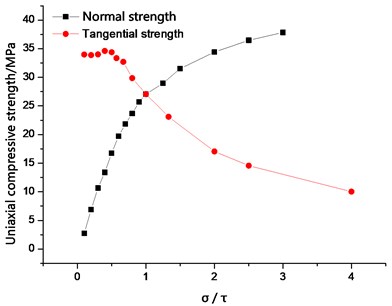
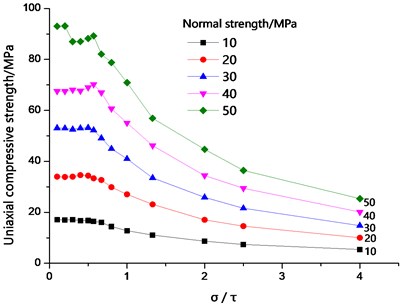
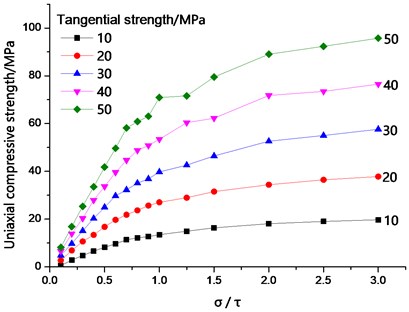
Tables 3 and 4 indicate that the average normal bond strength and the tangential bond strength only slightly affect the Poisson’s ratio. However, between the two factors, the average bond strength exerts a greater influence than on the uniaxial compression strength (Fig. 5). At 0 < σ/τ ≤ 0.67, the variation of the uniaxial compressive strength was large and exponential with the increase in average normal bond strength. The average tangential bond strength exerts no effect on the uniaxial compressive strength. This result was achieved because when the average tangential bond strength was greater than the normal bond strength, the main factor of the failure of the specimen was the normal bond strength, and the ultimate failure mode was tensile failure (Fig. 6). When the average tangential bond strength was less than the normal bond strength, the specimen achieved a small amount of tangential crack, but mainly, normal failure. When σ/τ > 0.67, the sample was mainly affected by the average tangential bond strength, and when the average normal bond strength increased, the specimen was transformed from brittle deformation to plastic deformation, and the failure mode changes to the shear failure mode (FIG. 7). The crack initiation was gradually increased, and the quantity was greater than the number of normal cracks. The average normal bond strength (10-50 MPa) and average tangential bond strength (10-50 MPa) were changed, and the relationship between bond strength ratio and peak strength was analyzed (Fig. 8). The average bond strength ratio was set to 0.1-4, and the average normal bond strength was assigned to 10-40 MPa. When the average bond strength ratio was 0 < σ/τ ≤ 0.67, the uniaxial compressive strength was mainly affected by the average normal bond strength. When the average bond strength ratio was σ/τ > 0.67, the uniaxial compressive strength decreased with decreasing average tangential bonding strength. As the average bond strength between particles rose, the effect of the average tangential bond strength on the uniaxial compressive strength also increased.
Fig. 6Uniaxial compression failure crack (mainly normal failure)
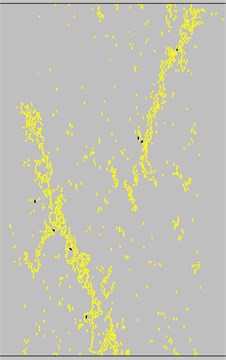
Fig. 7Uniaxial compression failure crack (mainly tangential failure)
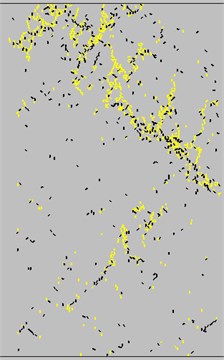
Fig. 8Relationship between bond strength ratio and peak strength with different normal bond strength
The relationship between bond strength ratio and peak strength of different tangential bond strengths was analyzed (Fig. 9). The average bond strength ratio was set to 0.1-3.0. When the average bond strength ratio was 0 < σ/τ ≤ 1.0, the uniaxial compressive strength increased with increasing average normal bond strength. The average normal bond strength augmented with rising average tangential bond strength. At the same time, the total bond strength of the particles increased, and the uniaxial compressive strength of the specimen increased. When 0 < σ/τ ≤ 1.0, as the bonding strength between particles enlarged, the effect of the average normal bond strength on the uniaxial compressive strength also intensified. When σ/τ > 1, the uniaxial compressive strength was mainly affected by the average tangential bond strength.
Fig. 9The relationship between bond strength ratio and peak strength for different tangential bonding strength
4. Conclusions
1) The influence of the particle contact modulus EC and the elastic modulus of the parallel bond ¯Ec on the elastic modulus of the specimen was the most significant. The relation between the particle contact modulus (EC) and the Poisson’s ratio was linear. The influence of parallel bond modulus and friction factor on the Poisson’s ratio was negatively correlated.
2) The uniaxial compressive strength was positively correlated with the particle contact modulus EC but negatively correlated with the parallel bond elastic modulus. With increasing friction factor μ between particles, the bite force between particles enlarges, and the peak strength of the material rises.
3) The variation of the uniaxial compressive strength was large and exponential with the increase in average normal bond strength. The average tangential bond strength exerts no effect on the uniaxial compressive strength. When the average tangential bond strength was less than the normal bond strength, the specimen achieved a small amount of tangential crack, but mainly, normal failure.
References
-
Zhao Y., Wang Y., Wang W., Wan W., Tang J. Modeling of non-linear rheological behavior of hard rock using triaxial rheological experiment. International Journal of Rock Mechanics and Mining Sciences, Vol. 93, 2017, p. 66-75.
-
Yang S. Q., Xu T., He L., Jing H. W., Wen S., Yu Q. L. Numerical study on failure behavior of brittle rock specimen containing pre-existing combined flaws under different confining pressure. Archives of Civil and Mechanical Engineering, Vol. 15, Issue 4, 2015, p. 1085-1097.
-
Zhao L. H., Zuo S., Li L., Lin Y. L., Zhang Y. B. System reliability analysis of plane slide rock slope using Barton-Bandis failure criterion. International Journal of Rock Mechanics and Mining Sciences, Vol. 88, 2016, p. 1-11.
-
Basahel H., Mitri H. Application of rock mass classification systems to rock slope stability assessment: A case study. Journal of Rock Mechanics and Geotechnical Engineering, Vol. 9, Issue 6, 2017, p. 993-1009.
-
Tian Y., Liu Q., Ma H., Liu Q., Deng P. New peak shear strength model for cement filled rock joints. Engineering Geology, Vol. 233, 2018, p. 269-280.
-
Wang Y., Guo P., Ren W., Yuan B., Yuan H., Zhao Y., et al. Laboratory investigation on strength characteristics of expansive soil treated with jute fiber reinforcement. International Journal of Geomechanics, Vol. 17, Issue 11, 2017, https://doi.org/10.1061/(ASCE)GM.1943-5622.0000998.
-
Wang Y. X., Guo P. P., Dai F., Li X., Zhao Y. L., Liu Y. Behaviour and modelling of fiber reinforced clay under triaxial compression by using the combining superposition method with the energy based homogenization technique. International Journal of Geomechanics, Vol. 17, 2017, p. 04017101.
-
Bahaaddini M., Sharrock G., Hebblewhite B. K. Numerical investigation of the effect of joint geometrical parameters on the mechanical properties of a non-persistent jointed rock mass under uniaxial compression. Computers and Geotechnics, Vol. 49, Issue 20, 2013, p. 206-225.
-
Cao R., Cao P., Lin H., Fan X. Experimental and numerical study of the failure process and energy mechanisms of rock-like materials containing cross un-persistent joints under uniaxial compression. PLOS ONE, Vol. 12, Issue 12, 2017, p. e0188646.
-
Luding S. Introduction to discrete element methods. European Journal of Environmental and Civil Engineering, Vol. 12, Issues 7-8, 2008, p. 785-826.
-
Donzé F. V. Impacts on cohesive frictional geomaterials. European Journal of Environmental and Civil Engineering, Vol. 12, Issues 7-8, 2008, p. 967-985.
-
Cundall P. A computer model for simulating progressive large scale movement in block rock systems. Proceedings of the International Symposium on Rock Mechanics, Nancy, 1971.
-
Fan X., Kulatilake P. H. S. W., Chen X., Cao P. Crack initiation stress and strain of jointed rock containing multi-cracks under uniaxial compressive loading: A particle flow code approach. Journal of Central South University, Vol. 22, Issue 2, 2015, p. 638-645.
-
Hamdi J., Scholtès L., Souley M., Al Heib M. Effect of discretization at laboratory and large scales during discrete element modelling of brittle failure. International Journal of Rock Mechanics and Mining Sciences, Vol. 100, 2017, p. 48-61.
-
Tawadrous A. S., Degagné D., Pierce M., Mas Ivars D. Prediction of uniaxial compression PFC3D model micro‐properties using artificial neural networks. International Journal for Numerical and Analytical Methods in Geomechanics, Vol. 33, Issue 18, 2009, p. 1953-1962.
-
Park J. W., Song J. J. Numerical simulation of a direct shear test on a rock joint using a bonded-particle model. International Journal of Rock Mechanics and Mining Sciences, Vol. 46, Issue 8, 2009, p. 1315-1328.
-
Cao R.-H., Lin H. Experimental and numerical study of failure behavior and energy mechanics of rock-like materials containing multiple joints. Advances in Materials Science and Engineering, Vol. 2017, 2017, p. 6460150.
-
Cheng Y., Yang W., He D. Influence of structural plane microscopic parameters on direct shear strength. Advances in Civil Engineering, Vol. 2018, 2018, p. 9178140.
-
Yang B., Jiao Y., Lei S. A study on the effects of microparameters on macroproperties for specimens created by bonded particles. Engineering Computations, Vol. 23, Issue 6, 2006, p. 607-631.
-
Müller C., Frühwirt T., Haase D., Schlegel R., Konietzky H. Modeling deformation and damage of rock salt using the discrete element method. International Journal of Rock Mechanics and Mining Sciences, Vol. 103, 2018, p. 230-241.
-
Hamdi P., Stead D., Elmo D., Töyrä J. Use of an integrated finite/discrete element method-discrete fracture network approach to characterize surface subsidence associated with sub-level caving. International Journal of Rock Mechanics and Mining Sciences, Vol. 103, 2018, p. 55-67.
-
Lee H. P., Olson J. E., Schultz R. A. Interaction analysis of propagating opening mode fractures with veins using the Discrete Element Method. International Journal of Rock Mechanics and Mining Sciences, Vol. 103, 2018, p. 275-288.
-
Rojek J., Oñate E., Labra C., Kargl H. Discrete element simulation of rock cutting. International Journal of Rock Mechanics and Mining Sciences, Vol. 48, Issue 6, 2011, p. 996-1010.
-
Lin H., Cao P., Wang Y. Numerical simulation of a layered rock under triaxial compression. International Journal of Rock Mechanics and Mining Sciences, Vol. 60, Issue 6, 2013, p. 12-18.
-
Miao S., Cai M., Guo Q., Wang P., Liang M. Damage effects and mechanisms in granite treated with acidic chemical solutions. International Journal of Rock Mechanics and Mining Sciences, Vol. 88, 2016, p. 77-86.
-
Sahara D. P., Schoenball M., Gerolymatou E., Kohl T. Analysis of borehole breakout development using continuum damage mechanics. International Journal of Rock Mechanics and Mining Sciences, Vol. 97, 2017, p. 134-143.
-
Wang G., Zhang L., Zhang Y., Ding G. Experimental investigations of the creep-damage-rupture behaviour of rock salt. International Journal of Rock Mechanics and Mining Sciences, Vol. 66, 2014, p. 181-187.
-
Lin H., Wang H., Fan X., Cao P., Zhou K. Particle size distribution effects on deformation properties of graded aggregate base under cyclic loading. European Journal of Environmental and Civil Engineering, 2017, https://doi.org/10.1080/19648189.2016.1276480.
-
Yoon J. Application of experimental design and optimization to PFC model calibration in uniaxial compression simulation. International Journal of Rock Mechanics and Mining Sciences, Vol. 44, Issue 6, 2007, p. 871-889.
-
Sarfarazi V., Ghazvinian A., Schubert W. Numerical simulation of the process of fracture of echelon rock joints. Rock Mechanics and Rock Engineering, Vol. 47, Issue 4, 2014, p. 1355-1371.
-
Wang Y. X., Guo P. P., Dai F., Li X., Zhao Y. L., Liu Y. Behavior and modeling of fiber-reinforced clay under triaxial compression by combining the superposition method with the energy-based homogenization technique. International Journal of Geomechanics, Vol. 18, Issue 12, 2018, p. 04018172, https://doi.org/10.1061/(asce)gm.1943-5622.0001313.
-
Chen Y., Lin H. Consistency analysis of Hoek-Brown and equivalent Mohr-coulomb parameters in calculating slope safety factor. Bulletin of Engineering Geology and the Environment, 2018, p. 1-13, https://doi.org/10.1007/s10064-018-1418-z.
-
Wang M., Cao P., Chen Y. Anisotropy of rock profile JRC values and its empirical formula: a case study on yellow rust granite. Geotechnical and Geological Engineering, Vol. 35, Issue 4, 2017, p. 1645-1655, https://doi.org/10.1007/s10706-017-0199-7.

