Abstract
In modern societies, underground structures like subways, water transport and urban tunnels are using widely due to the rapid population growth and limitations of above ground spaces. Although these structures especially urban tunnels have been reported to experience less damages in comparison with above-ground structures during earthquakes, their damages have direct effects on human lives. In this study, 2D plane strain simulation of a NATM tunnel subjected to harmonic loading is employed to investigate the dynamic effects of the presence of tunnel on the ground responses and on the drift values of a tunnel section using advanced hardening soil constitutive model. The surface settlement, acceleration and drift in both tunnel section and free field are presented as time histories for different PGA and results have been discussed.
1. Introduction
Urban tunnels have become common remedy to answer the growing demands of underground transportation system. Considering their seismic behavior in comparison with the above-ground structures, it should be noticed that there are fundamental differences in design and analysis [1]. Many researchers have been studied the effects of presence of underground structures on the ground settlement and drift responses by using physical and numerical modeling [2-4]. Due to the complexity of the soil-structure interaction and effects of the pseudo-static deformation of the ground on the seismic behavior of the under-ground structures, the ground strains (ground displacements) govern the under-ground structures seismic responses [5]; Therefore, using an advanced soil constitutive model such as soil hardening model (HS) is inevitable to simulate the soil-structure interactions correctly. In this study, a series of dynamic analyses were performed on a 2-lane NATM tunnel using soil hardening constitutive model and harmonic loading with different PGA. The surface settlement and drift time histories are presented and compared for different PGA. Also, the maximum drift values were compared at both tunnel section and free field.
2. Tunnel section
2-lane NATM tunnel section with height of 8.14m and width of 10.35m has been used in analyses. Construction stages related to this tunneling method is numbered in Fig. 1 and the cross section of the tunnel with final lining is brought in Fig. 2. As can be seen in Fig. 1 the section excavated partially with respect to the best stability condition and executive limitations.
3. Numerical modeling
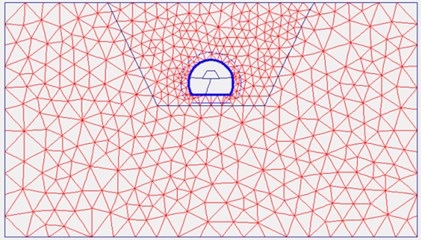
Finite element software Plaxis has been used in order to simulate the numerical model. This software can properly model the soil-tunnel interaction. The plane strain condition was assumed in modeling the soil deposit and the tunnel lining has been represented by beam element. Stages of the excavation and construction of tunnel lining have been modeled according to the actual conditions that exists in projects. Fig. 3 shows the schematic of model mesh at the end of stage construction and the beginning of dynamic loading. As can be seen in Fig. 3, 15-noded triangular elements has been chosen for modeling.
Fig. 1Construction sequences of the tunnel
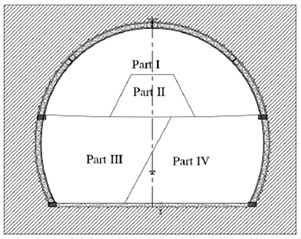
Fig. 2Cross section of the tunnel with final lining
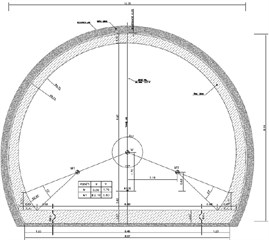
Fig. 3A schematic of model mesh
3.1. Soil properties
In order to simulate the soil deposit, hardening soil constitutive model (HS) have been employed. Table 1 shows the soil properties used in the modeling.
Table 1Soil properties used in the simulation
Parameters | Name | Value |
(kPa) | Effective cohesion | 25 |
(°) | Effective friction angle | 37 |
(°) | Dilatancy angle | 7 |
(–) | Power of the stress-level dependency of stiffness | 0.5 |
(kPa) | Reference secant stiffness | 70000 |
(kPa) | Reference tangent stiffness | 70000 |
(kPa) | Reference unloading/reloading stiffness | 210000 |
(–) | Poisson ratio | 0.2 |
3.2. Final lining properties
Final lining of the tunnel, which has been simulated by using beam element, is consist of five different sections due to their location in tunnel. Top heading of the lining (top curve part of the tunnel) has a section with 40 cm thickness and the other sections has variable thickness of 45-60 cm located on the side walls and floor slab (thicknesses increase in the lower parts). The section properties are brought in Table 2.
4. Results
Harmonic wave presented in Fig. 4 has been scaled to 0.1 g, 0.2 g, 0.35 g, 0.5 g and 0.6 g then applied to the model base in order to obtain the soil surface settlement and the drift responses.
Table 2Different final lining section properties used in the simulation
Section thickness | EI (kN.m2/m) | EA (kN/m) | W (kN/m/m)) |
40 | 75327.32 | 11299804 | 9.6 |
45 | 107260 | 12712279.5 | 10.8 |
50 | 147133 | 14124755 | 10.8 |
60 | 254246 | 16949706 | 14.4 |
57 | 217521.23 | 16102220.7 | 13.68 |
Fig. 5 shows the acceleration time history at the surface of the model on top of the tunnel section. As can be seen, ground responses have been amplified due to the PGAs increase around 60 %, 30 % and 18 % respectively for 0.2 g, 0.35 g and 0.5 g of base acceleration. It is obvious that the increasing rate was higher for the least PGA.
Fig. 4Harmonic wave used in the analyses

Fig. 5Surface acceleration time histories on top of tunnel section for harmonic loading with different PGAs

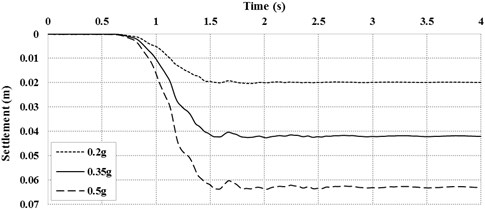
Surface settlement time histories have been depicted in Fig. 6 for three PGAs. The value of permanent settlement has increased by increasing the PGA but the trends are the same in all diagrams.
Fig. 6Surface settlement time history on top of tunnel section for harmonic loading with different PGA
Some additional analyses have been done with low (0.1 g) and high (0.6 g) PGA to investigate the racking deformations of the model for wide range of PGA as well as to estimate the ratio of underground structure deformation to ground deformations. Underground structures when subjected to shear distortions during dynamic loading will undergo transverse racking deformations [6]. Fig. 7 shows the drift or racking distortion for a schematic rectangular and circular tunnel. In the case of circular tunnel (almost similar to the mentioned tunnel case), racking is the ratio of lining diametric deflection and free field diametric deflection [6].
Fig. 7Schematic of drift deformation for a rectangular and circular tunnel [6]
![Schematic of drift deformation for a rectangular and circular tunnel [6]](https://static-01.extrica.com/articles/19810/19810-img7.jpg)
![Schematic of drift deformation for a rectangular and circular tunnel [6]](https://static-01.extrica.com/articles/19810/19810-img8.jpg)
Figs. 8-9 depicted the time histories of the drift distortion in tunnel section and also on free field section for all PGAs in the same depth. It is obvious that the distortion in both sections increases when the PGA get larger and also, the direction of drift distortions at the tunnel section the free field section at any particular time. This is due to different stiffness of the soil body and the tunnel structure which resulted in the different periods of the soil column and the tunnel structure.
Fig. 8Drift time history at the tunnel section for harmonic loading with different PGA

Fig. 9Drift time history at free field for harmonic loading with different PGA

Racking ratio which is defined as the normalized structure racking distortion with respect to the free field ground distortion can be expressed as [6]:
where is angular distortion and is lateral racking deformation. Wang [7] has presented series of curves which showed normalized circular lining deflection curves versus flexibility ratio. Due to these curves, the relative stiffness between the soil and the structure placed in it (flexibility ratio) has the most significant influence on the distortion of the structure due to the racking deformation (Fig. 10). Table 3 presented the definition of the flexibility ratio ranges and its effects on the soil structure interactions.
The maximum values of the drift in tunnel section, free field section and also, the racking distortion ratio have been brought in Table 4 for all PGAs. Depicted curves in Fig. 11 relate to these maximum drift values versus the equivalent PGAs for the tunnel and the free field sections. Considering the curves, it is worth mentioning that the decrease in the slope of the curve of the free field section is due to decrease in the soil stiffness by entering into the plastic phase. On the other hand, the tunnel lining maximum drift which defined as an elastic element increased with a lower slope in respect to the corresponding free field curve.
Referring to Fig. 10, considering Poisson ratio 0.2, equivalent values of flexibility ratio for all evaluated racking ratio mentioned in Table 4 are in range 1.5-2.5.
Fig. 10Normalized lining deflection vs. flexibility ratio, circular lining and full slip interface
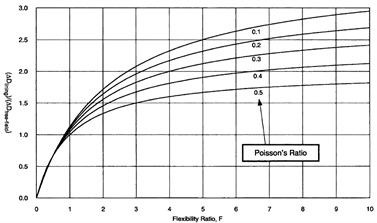
Fig. 11Maximum drift values versus PGA for tunnel and free field sections
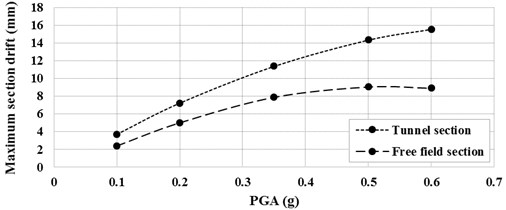
Table 3Flexibility ranges and their explanations [7]
value | Explanation |
0.0 | The structure is rigid, so it will not rack regardless of the distortion of the ground |
1.0 | The structure is considered stiff relative to the medium and will therefore deform less |
1.0 | The structure and medium have equal stiffness, so the structure will undergo approximately free field distortions |
1.0 | The racking distortion of structure is amplified relative to the free field, though not because of dynamic amplification. Instead, the distortion is amplified because the medium now has a cavity, providing lower shear stiffness than non-perforated ground in the free field |
∞ | The structure has no stiffness, so it will undergo deformation identical to the perforated ground |
Table 4Maximum drift values of both sections
PGA | Max. value of drift in sections (mm) | ||
Tunnel section | Free field section | ||
0.1 g | 3.69 | 2.42 | 1.53 |
0.2 g | 7.21 | 5.02 | 1.40 |
0.35 g | 11.37 | 7.89 | 1.44 |
0.5 g | 14.34 | 9.05 | 1.58 |
0.6 g | 15.56 | 8.91 | 1.75 |
5. Conclusions
In this paper general behavior of the NATM tunnel has been evaluated under harmonic wave excitation. Ground responses have been considered as surface settlement, surface acceleration and section drifts. The permanent settlement increased by PGA increase and acceleration has been amplified due to the PGA increase around 60 %, 30 % and 18 % related to 0.2 g, 0.35 g and 0.5 g. Also, sections including tunnel and free field condition have been considered in order to measure the drift distortion and racking ratio and comparing with available flexibility ratio charts. The results show that the racking distortion of structure is amplified relative to the free field, though not because of dynamic amplification. Instead, the distortion is amplified because the medium now has a cavity, providing lower shear stiffness than non-perforated ground in the free field. Considering the drift curves, it is worth mentioning that the decrease in the slope of the curve of the free field section is due to decrease in the soil stiffness by entering into the plastic phase. On the other hand, the tunnel lining maximum drift which defined as an elastic element increased with a lower slope in respect to the corresponding free field curve.
References
-
Mohammadi Haji B., Ardakani A. Numerical prediction of circular tunnel seismic behavior using hypoplastic soil constitutive model. International Journal of Geotechnical Engineering, 2018, https://doi.org/10.1080/19386362.2018.1438152.
-
Abuhajar O., El Naggar H., Newson T. Effects of underground structures on amplification of seismic motion for sand with varying density. Pan-Am CGS Geotechnical Conference, 2011.
-
Smerzini C., Aviles J., Sanchez, Sesma P. J., Paolucci R. Effect of underground cavities on surface earthquake ground motion under SH wave propagation. Earthquake Engineering and Structural Dynamics, Vol. 38, Issue 12, 2009, p. 1441-1460.
-
Sica S., Russo A. D., Rotili F., Simonslli A. L. Ground motion amplification due to shallow cavities in nonlinear soils. Natural Hazards, Vol. 71, 2014, p. 1913-1935.
-
Corigliano M., Scandella L., Lai C. G., Paolucci R. Seismic analysis of deep tunnels in near field fault conditions: a case study in southern Italy. Bulletin of Earthquake Engineering, Vol. 9, Issue 4, 2011, p. 975-995.
-
Hashash Y. M. A., Hook J. J., Schmidt B., Chiang Yao I.-J. Seismic design and analysis of underground structures. Tunneling and Underground Space Technology, Vol. 16, 2001, p. 247-293.
-
Wang J. N. Seismic Design of Tunnels: a State-Of-The-Art Approach. Parsons, Brinckerhoff, Quade and Douglas Inc., New York, 1993.
