Abstract
Starting with the analysis on sound pressure level (SPL) spectrum of surface-mounted permanent magnet synchronous motors (SMPMSMs), the reasons for producing main peaks are investigated. According to different causes, different methods for reducing noise are proposed. Firstly, the SPL spectrum of SMPMSMs is obtained by experiment under the conditions of 2000 rpm rated speed, full load and 4 kHz switching frequency. Meanwhile, the frequencies corresponding to main peaks are found out. Secondly, the reasons for generating peaks in the SPL spectrum are researched from three aspects, namely, force sources, natural frequencies, coefficient of relative sound intensity. Then, on the basis of different causes for generating noise, different measures for decreasing noise are presented, namely, single cutting of two end rabbets of motor case in single clamping, waveform reconstruction of radial electromagnetic force density, enhancing of switching frequency, changing of natural frequency and decreasing of the length-diameter ratio of stator. Furthermore, the effectiveness for these methods is studied. Finally, a comprehensive method is proposed to decrease noise. The noise value of SMPMSMs is reduced by 4.7 dB(A) at the rated speed of 2000 rpm, full load and switching frequency of 4 kHz. In addition, the sharpness and loudness are respectively decreased by 0.522 acum and 6.97 sone at no load. The study provides references for the design of SMPMSMs with low noise.
1. Introduction
As compared to other motors, due to their high-power density, good dynamic performance and high energy conversion efficiency, surface-mounted permanent magnet synchronous motors (SMPMSMs) have been more and more widely used in many fields, such as home appliances, machine tools, automobile, military and other fields [1, 2]. However, SMPMSMs will generate noise during their operation, which can affect their application areas. Therefore, noise generating reasons and noise reducing methods for SMPMSMs should be analyzed.
Noise reduction has always been one of the main contents of SMPMSMs research. The noise producing reasons for motors are classified by mechanical causes, aerodynamic causes and electro-magnetic causes. The mechanical causes include uneven mass distribution within the rotor, motor balancing, bearing defect and so on. The aerodynamic causes cover the fan rotation, rotor rotation and so on. The electro-magnetic causes include an unbalance of electric source, the harmonic components of phase current, an unbalance of air-gap and etc. [3]. Many experts and scholars carried out extensive research and obtained certain achievements. Lipo T. A. et al. [4, 5] analyzed the influence of radial electromagnetic force on the electromagnetic noise of a permanent-magnet synchronous motor (PMSM). Zhu Ziqiang, professor of the University of Sheffield, proved that the radial electromagnetic force acting on the stator surface and various order modes of stator structure were two key reasons for the electromagnetic noise of PMSM [6]. Tang Renyuan, academician, et al. [7, 8] investigated the influence of power supply by inverter, rotating frequency and coefficient of relative sound intensity on noise of motors. Huang Surong, professor, and other scholars presented a method with coupling of electromagnetism and structure to predict and discuss noise of motors [9, 10]. According to [8], the unbalanced magnetic pull produced by rotor whirling was analyzed using the theory and experiment which can cause noise. However, the above literatures only describe the methods for predicting noise and the causes of noise generation, the effective measures for denoising are not proposed.
This paper investigates the reasons of noise generation for SMPMSMs and the measures for noise reduction of SMPMSMs. A surface-mounted permanent magnet synchronous motor (SMPMSM) with 36 slots and 8 poles is taken as an example in this paper. The causes for producing main peaks of SPL spectrum are studied from three aspects, namely, force sources (rotating frequency, radial electromagnetic force, switching frequency), natural frequency of stator structure and coefficient of relative sound intensity. In the light of different reasons for producing main peaks, different methods for noise reduction are presented, those are single cutting of two end rabbets of motor case in single clamping which can increase concentricity, waveform reconstruction of radial electromagnetic force density that can reduce the power spectrum peaks of radial electromagnetic force density, changing the switching frequency of inverter and natural frequency of stator structure for the sake of avoiding resonance, decreasing the length-diameter ratio of stator in order to get a lower coefficient of relative sound intensity.
The remaining of this paper is organized as follows. Section 2 briefly presents the characteristics of SMPMSM. Section 3 shows the experimental methodology with details of natural frequency test and noise test. Section 4 explains the reasons for generating noise of SMPMSM from three aspects and describes the methods of noise reduction on the basis of these causes. Section 5 gives a comprehensive method of noise reduction, and this method combines the measures presented in Section 4. This section also analyzes the sharpness and loudness of SMPMSM. The conclusions are depicted in the last section.
2. Characteristics of SMPMSM
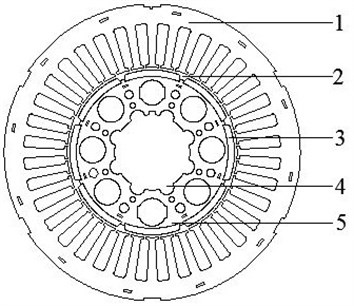
The motor used in this paper is a SMPMSM with 8 poles and 36 slots. The cross-section view is illustrated in Fig. 1. The permanent magnets are NdFeB with N35UH, and the soft magnetic material of stator core and rotor core is the non-oriented silicon steel DW470-50. The rotating shaft material is No. 45 steel. The structural parameters are shown in Table 1.
Fig. 1Cross-section view of SMPMSM: 1 – stator core, 2 – air gap, 3 – permanent magnet, 4 – rotating shaft, 5 – rotor core
3. Experimental methodology
In order to describe the causes of noise production for a SMPMSM, the natural frequencies and noise of SMPMSM should be tested.
Table 1Structural parameters of SMPMSM
Parameters | Values |
Stator outer diameter / mm | 182 |
Stator inner diameter / mm | 104.8 |
Rotor outer diameter / mm | 93.6 |
Number of stator slots | 36 |
Number of poles | 8 |
Stator length / mm | 143 |
Rated speed / (rpm) | 2000 |
Remanent flux density / T | 1.22 |
Coercive force / (A/m) | 0.876×10⁶ |
3.1. Natural frequency test
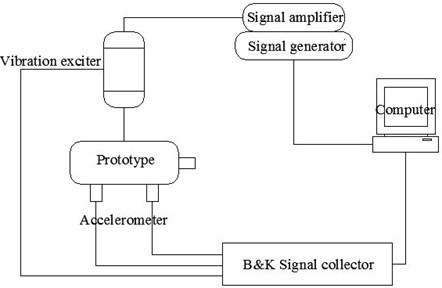
The modal testing software of vibration and noise test system 7753 of Danish B&K Company is used to test motor modes through the vibration exciter method in this paper. The modal testing system consists of prototype, signal collector, vibration exciter, signal generator, signal amplifier, accelerometer and computer. The B&K modal testing system is depicted in Fig. 2.
Fig. 2B&K modal testing system
Stator structure (motor case, stator core and windings) is the main carrier of noise emission. Therefore, the natural frequency of stator structure is only analyzed by experiment.
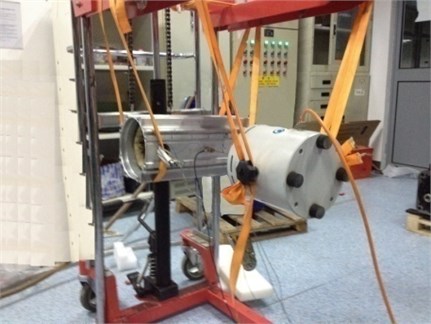
In this paper, the free mode of prototype is studied, so the tested stator structure is hanged in the midair by elastic rope, as shown in Fig. 3. The experiment adopts the method with one point excitation and multipoint recording response to test the circumferential modes of SMPMSM.
Fig. 3Modal testing spot on stator structure
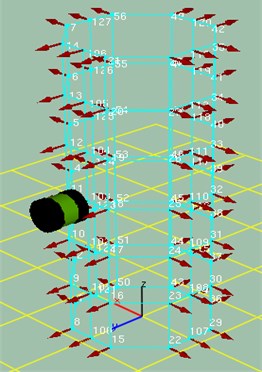
Firstly, the simplified model of the tested stator structure is modeled in the B&K Labshop software. Then, the circumference of the measured stator structure is the average set of 81 testing points, as depicted in Fig. 4. The occurring signal is set as a random signal. Average 100 times vibration is as one step, and each step uses three acceleration transducers to record the signals of 3 testing points. Finally, the frequency response function of each testing point and the established experimental simplified model are imported into the post processing software Reflex of the B&K [11, 12]. Pulse Reflex Modal Analysis software analyzes the measured natural frequency data. Each frequency response function is attached to the corresponding to testing point of the model. When the modes are chosen, Polyference Time is used to extract the modes of each interval.
Fig. 4Diagrammatic sketch of exciting point and testing points in modal test
3.2. Noise test
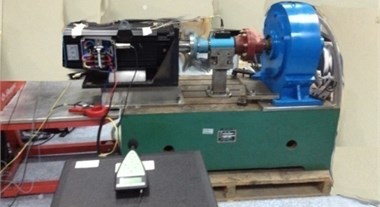
The noise of SMPMSM is tested through the hemispherical method. Firstly, the sound level meter (B&K2239) is placed at the distance of 1000 mm from the rotating shaft center of motor, 1000 mm from the ground. The angle between the sound level meter and the axial direction of motor is 45 degrees. Then, the noise signals are directly transmitted to the data acquisition system (B&K3050-A-060) through a sound level meter. Meanwhile, the noise values can be directly read by the sound level meter. Finally, all the noise signals are inputted into the computer by the data acquisition system for spectrum analysis. The testing system on vibration and noise of SMPMSM is shown in Fig. 5, and the testing spot on vibration and noise of SMPMSM is presented in Fig. 6.
Fig. 5Testing system on vibration and noise of SMPMSM
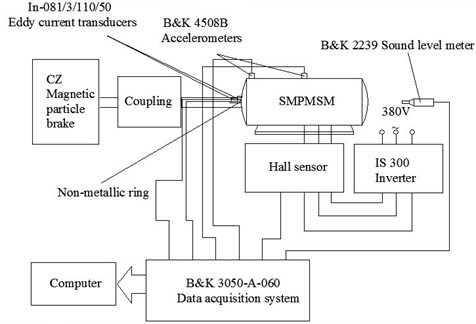
Fig. 6Testing spot on vibration and noise of SMPMSM
The vibration and noise of SMPMSM are tested through the Pulse Labshop software. In addition, the Pulse Reflex Core software analyzes the tested vibration and noise data. The SPL spectra and noise values of prototype at different speeds, loads and switching frequencies are obtained. Furthermore, the signal-to-noise separation is carried out by MatLab to filter the background noise. Table 2 contains the noise values of prototype at different speeds, loads and switching frequencies.
Table 2Measured noise values of prototype
Speeds / (rpm) | Working conditions | ||||||||
No load | Half load | Full load | |||||||
Switching frequencies | Switching frequencies | Switching frequencies | |||||||
2 kHz | 3 kHz | 4 kHz | 2 kHz | 3 kHz | 4 kHz | 2 kHz | 3 kHz | 4 kHz | |
Noise values / dB(A) | Noise values / dB(A) | Noise values / dB(A) | |||||||
100 | 58.3 | 55.4 | 54.3 | 56.5 | 55.3 | 54.9 | 58.1 | 57.8 | 57.4 |
300 | 65.1 | 61.3 | 55.6 | 61.8 | 60.9 | 60.3 | 64.4 | 63.2 | 62.5 |
500 | 68.2 | 65.2 | 56.3 | 65.1 | 64.6 | 64.2 | 67.7 | 66.5 | 65.5 |
1000 | 71.4 | 69.8 | 62.1 | 71.5 | 69.8 | 69 | 75.5 | 73.6 | 72.3 |
1500 | 72.3 | 71.7 | 65.2 | 78.5 | 75.4 | 74.5 | 78 | 77.8 | 76.3 |
2000 | 73 | 70.3 | 69.1 | 80.6 | 79.4 | 78.1 | 79.8 | 78.5 | 77.8 |
From the Table 2, it can be seen that noise values are larger. Therefore, appropriate measures should be taken to decrease the noise of SMPMSM.
4. Analysis on noise generating reasons and reducing methods for SMPMSM
In order to decrease the noise of SMPMSM, the reasons of noise generation for SMPMSM should be firstly researched. Fig. 7 is the SPL spectrum of prototype at the rated speed of 2000 rpm, full load and switching frequency of 4 kHz. Table 3 contains the main peaks of SPL spectrum extracted from Fig. 7.
Fig. 7SPL spectrum of prototype at rated speed of 2000 r/min, full load and switching frequency of 4 kHz
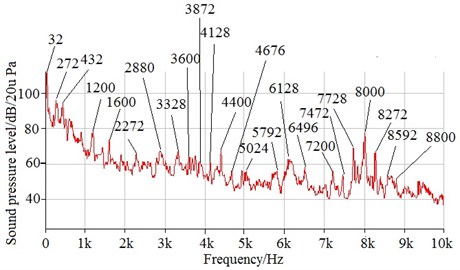
Table 3List of main peaks of SPL spectrum extracted from Fig. 7
Frequency / Hz | SPL / dB(A) | Frequency / Hz | SPL / dB(A) | Frequency / Hz | SPL / dB(A) |
32 | 111.7 | 3600 | 65.6 | 6496 | 58.2 |
272 | 95.7 | 3872 | 61.5 | 7200 | 56.4 |
432 | 94.7 | 4128 | 61.5 | 7472 | 54.0 |
1200 | 78.7 | 4400 | 68.8 | 7728 | 69.2 |
1600 | 73.6 | 4672 | 56.7 | 8000 | 77.6 |
2272 | 66.1 | 5024 | 56.3 | 8272 | 67.4 |
2880 | 67.3 | 5792 | 56.2 | 8592 | 53.4 |
3328 | 68.8 | 6128 | 63.0 | 8800 | 51.9 |
There are many reasons of motor noise generation, such as electromagnetic noise sources, mechanical noise sources and aerodynamic noise sources [13, 14]. In addition, the electromagnetic noise sources are the most important causes of noise generation. Therefore, this section mainly investigates the electromagnetic reasons of noise generation. Firstly, the causes for producing main peaks are investigated from three aspects, namely, force sources, natural frequency and coefficient of relative sound intensity. Then, on the basis of different reasons for producing main peaks, different noise reduction methods are presented.
4.1. Force sources
The main force sources related to the producing noise of SMPMSM include rotating frequency, radial electromagnetic force and switching frequency.
4.1.1. Rotating frequency
4.1.1.1. Influence of rotating frequency on noise
The rated speed of SMPMSM is 2000 rpm, the rotating frequency is:
32 Hz of SPL peaks is caused by rotating frequency (fr= 2000/60 = 33.33 Hz); the SPL peak produced by the product (2p×fr= 2×4×2000/60 = 266.67 Hz) of pole number and rotating frequency is 272 Hz; SPL peak of 432 Hz is generated by the product (Z1/s×fr= 36/3×2000/60 = 400 Hz) of the number of stator slots corresponding to each phase and rotating frequency; 1200 Hz of SPL peaks is produced by the product (Z1×fr= 36×2000/60 = 1200 Hz) of the number of stator slots and rotating frequency. Due to the existence of resolving power for a frequency of SPL spectrum, there is a certain error between the calculated values and measured values.
4.1.1.2. Influence of single cutting of two end rabbets of motor case in single clamping on noise
The rotating frequency is generated by the eccentricity of rotor bearing journals, misalignment of two end rabbets of motor case and misalignment between rabbets and bearing bores of two ends and so on. In order to decrease the influence of rotating frequency on the noise, the original processing technique should be improved.
In order to reduce the effect of rotating frequency on noise, the method of single cutting of two end rabbets of motor case in single clamping can be adopted. The noise values and SPL spectra of improved motor with applying this method at different speeds, loads and switching frequencies are obtained by experiment.
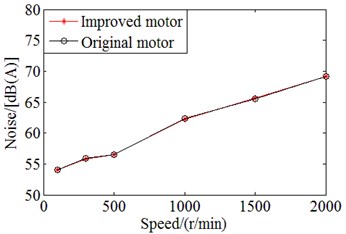
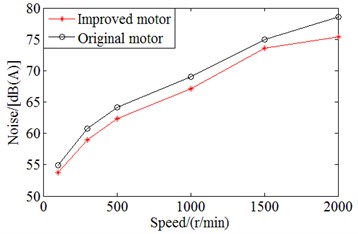
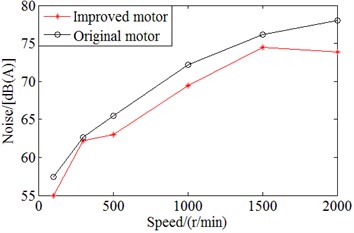
Fig. 8 is the comparison on noise values between original motor and improved motor at different speeds and loads, switching frequency of 4 kHz.
Fig. 8Comparison on noise values between original motor and improved motor with applying single cutting of two end rabbets of motor case in single clamping at switching frequency of 4 kHZ
a) No load
b) Half load
c) Full load
In Fig. 8, it can be seen that the noise values of improved motor are smaller than those of original motor at half and full loads, different speeds and switching frequency of 4 kHz. In order to better display the advantages in noise reduction of improved motor at half load and full load, Table 4 shows the ratio of improvement in noise reduction with the improved motor as compared to the original motor. From the table, it can be seen that at the rated speed of 2000 rpm, full load and switching frequency of 4 kHz, the noise value is decreased by 4.1 dB(A), the reduction in percentage is about 5.26 % as compared to the one with the original motor. However, the noise values of improved motor are almost the same as those of the original motor at different speeds, no load and switching frequency of 4 kHz, as illustrated in Fig. 8(a). This is because the electromagnetic force has a little effect on the noise at no load. Therefore, the method of single cutting of two end rabbets of motor case in single clamping can effectively reduce the noise at different speeds, half and full loads and switching frequency of 4 kHz.
Table 4Comparison on noise values between original motor and improved motor with applying single cutting of two end rabbets of motor case in single clamping at different speed, half load and full load and switching frequency of 4 kHz
Speed/ (rpm) | Working conditions | |||||
Half load | Full load | |||||
Original motor / dB(A) | Improved motor / dB(A) | Decrease rate / % | Original motor / dB(A) | Improved motor / dB(A) | Decrease rate / % | |
100 | 54.9 | 53.8 | 2.00 | 57.4 | 55 | 4.18 |
300 | 60.8 | 59 | 2.96 | 62.6 | 62.2 | 0.64 |
500 | 64.2 | 62.4 | 2.80 | 65.5 | 63 | 3.82 |
1000 | 69 | 67.1 | 2.75 | 72.2 | 69.4 | 3.88 |
1500 | 75 | 73.6 | 1.87 | 76.2 | 74.5 | 2.23 |
2000 | 78.6 | 75.4 | 4.07 | 78 | 73.9 | 5.26 |
4.1.2. Radial electromagnetic force
4.1.2.1. Influence of radial electromagnetic force on noise
In order to calculate the radial electromagnetic force acting on the stator surface with a different time, the magnetic field distribution of SMPMSM at a different time must be gained. In general, the effect of the eddy current on the magnetic field is not considered. The model is transformed into a two-dimensional static magnetic field solution when the rotor is located at different places, that is, time-stepping finite element method [15].
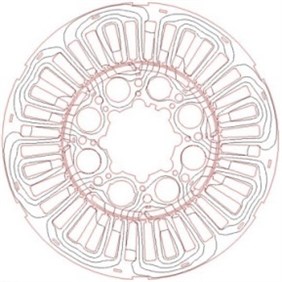
In the process of numerical analysis, rotor needs to be rotated, so the mesh of the stator and rotor needs to be rehandled. In this paper, the motion boundary method is adopted. After calculating, the magnetic force-line distribution of prototype is gained, as illustrated in Fig. 9. On the basis of the Eq. (2), the radial electromagnetic force density is calculated, and the power spectrum is analyzed by MatLab using Eq. (3) and Eq. (4). Fig. 10 is the radial electromagnetic force density varying with time and its power spectrum of a point at the inner surface of stator when the rotor rotates:
Fig. 9Magnetic force-line distribution of SMPMSM
The peak frequencies on power spectrum of radial electromagnetic force density are the products of the number of poles, rotating frequency and harmonic orders, that is:
In order to confirm whether radial electromagnetic force is the cause of noise generation of prototype or not, the peaks of SPL spectra at the rated speed of 2000 rpm, different loads and switching frequency of 4 kHz gained by experiment are compared, as depicted in Table 5.
From the table, it can be seen that at frequencies from 272 Hz to 2880 Hz, peaks of SPL spectrum at half load are greater than those of no load 1.6 dB(A)-23.2 dB(A); peaks of SPL spectrum at full load are greater than those of half load 2.1 dB(A)-14.9 dB(A); peaks of SPL spectrum at full load are greater than those of no load 3.7 dB(A)-38.1 dB(A). Therefore, the radial electromagnetic force is the main reason of noise generation in this frequency range.
In order to further investigate the influence of radial electromagnetic force on the noise of SMPMSM, according to Eq. (6)-Eq. (13) [16-18], the electromagnetic force wave of SMPMSM is analyzed, as shown in Table 6:
Here, c/d is fraction in the lowest terms.
Fig. 10Radial electromagnetic force density varying with time and its power spectrum of SMPMSM

a)

b)
When d is even number, T=2p/d:
when d is odd number, T=p/d:
In the harmonic magnetic field of air gap, it has both the magnetomotive force harmonic magnetic field, and the magnetic guide tooth harmonic magnetic field [19], that are:
Therefore:
From the table, it can be seen that, the electromagnetic force waves which can cause the noise of SMPMSM are mainly 0-order force wave and 4-order force wave. In some literatures [2, 6], they give the following formula (Eq. (14)). As described in Eq. (14), the amplitude of vibration acceleration (A) is proportional to the amplitude of radial electromagnetic force wave (F) and is inversely proportional to the fourth power of the force wave order (γ4). That is, under the certain stiffness conditions, the lower the order of force waves is, the greater the deformation of stator core is; the bigger the amplitude of the radial electromagnetic force wave is, the greater the deformation of stator core is:
Table 5Comparison on peaks of measured SPL spectra at the rated speed of 2000 rpm, different loads and switching frequency of 4 kHz and frequencies from 272 Hz to 2880 Hz
Simulated peak frequencies of radial electromagnetic force density / Hz | Measured peak frequencies of SPL spectra / Hz | Measured peaks of SPL spectra / dB(A) | ||
No load | Half load | Full load | ||
266.6 | 272 | 57.6 | 80.8 | 95.7 |
1600 | 1600 | 53.4 | 65.9 | 73.6 |
2133 | 2048 | 49.1 | 57.8 | 66.1 |
2933 | 2880 | 63.6 | 65.2 | 67.3 |
Table 6Frequency and order of radial electromagnetic force wave
Frequency / Hz | Order |
266.6 | 4 |
1600 | 0 |
2133 | 4 |
2933 | 4 |
4.1.2.2. Influence of waveform reconstruction of radial electromagnetic force density on noise
Through the above analysis, the low order electromagnetic force harmonics should be avoided as far as possible in the design of the motor [20]. In this paper, a method of waveform reconstruction of radial electromagnetic force density is proposed, and it can improve the structure of SMPMSM and reduce the amplitude of lower order harmonics. Firstly, the fast Fourier transform (FFT) of radial electromagnetic force density is carried out by MatLab. Secondly, on the basis of the above analysis, the harmonic components of 266.6 Hz, 1600 Hz, 2133 Hz and 2933 Hz need to be reduced. Then, the inverse Fourier transform is carried out and the reason for generating noise is found out. Finally, by opening a slot in the middle position of the stator tooth, the requirement for reducing power spectrum peaks of the radial electromagnetic force density can be achieved. A comparison on the power spectrum of radial electromagnetic force density before and after improvement is shown in Fig. 11.
From Fig. 11, it can be seen that the amplitudes of low order harmonics after improvement are decreased, and thus the noise of SMPMSM will be reduced.
4.1.3. Switching frequency
4.1.3.1. Influence of switching frequency on noise
When the inverter is used to supply power, a lot of harmonic components related to the switching frequencies are generated in the magnetic field of armature reaction of stator of the SMPMSM. The electromagnetic force harmonics produced by the harmonics interacting with the harmonics of the magnetic field produced by permanent magnets result in higher noise. There is a kind of relationship among frequencies of electromagnetic force harmonics, switching frequencies and fundamental frequency of the motor. The frequencies of electromagnetic force harmonics can be expressed as [7]:
On the basis of Eq. (15), the mainly characteristic frequencies on noise generation of SMPMSM are obtained in the vicinity of switching frequency and its harmonics.
Fig. 11Comparison on power spectrum of radial electromagnetic force density varying with time of SMPMSM before and after improvement

a) Power spectrum of radial electromagnetic force density varying with time of SMPMSM before improvement

b) Power spectrum of radial electromagnetic force density varying with time of SMPMSM after improvement
Table 7 contains a comparison among modulated switching frequencies by fundamental frequency, simulated peak frequencies of radial electromagnetic force density and measured peak frequencies of SPL. From Table 7 and Fig. 7, it can be seen that there are many larger peaks in the SPL spectrum in the vicinity of switching frequency and its harmonics. These peaks are generated by resonance produced by modulated switching frequencies by fundamental frequency coinciding with simulated peak frequencies of radial electromagnetic force density.
Table 7Comparison among modulated switching frequencies by fundamental frequency, simulated peak frequencies of radial electromagnetic force density and measured peak frequencies of SPL
Modulated switching frequencies by fundamental frequency / Hz | Simulated peak frequencies of radial electromagnetic force density / Hz | Measured peak frequencies of SPL / Hz |
3333.3 | 3200 | 3328 |
3600 | 3733 | 3600 |
3866.7 | 4000 | 3872 |
4133.3 | 4266 | 4128 |
4400 | 4533 | 4400 |
4666.7 | 4800 | 4672 |
7200 | 7199 | 7200 |
7466.7 | 7466 | 7472 |
7733.3 | 7733 | 7728 |
8000 | 7999 | 8000 |
8266.7 | 8266 | 8272 |
8533.3 | 8532 | 8592 |
8800 | 8799 | 8800 |
4.1.3.2. Influence of high and low of switching frequencies on noise
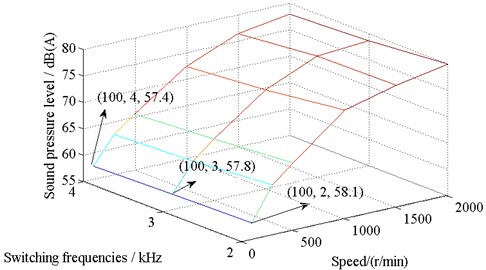
Fig. 12 contains a comparison on the noise values of SMPMSM with different speeds and switching frequencies at full load. From Fig. 12 and Table 2, it can be seen that under the conditions of the same speed and the same load, the higher the switching frequencies are, the smaller the noise values are. However, the increase of switching frequency will cause the loss of power devices and the influence of voltage dead zone on output waveforms. At the same time, when the switching frequency is increased, the excessive energy loss will be produced and most of the energy will be converted to heat energy. Therefore, under the premise of ensuring the operating performance of SMPMSM, the switching frequencies of inverter can be appropriately enhanced for the sake of noise decrease.
Fig. 12Comparison on noise values of SMPMSM with different switching frequencies and speeds at full load
4.2. Natural frequency
4.2.1. Influence of natural frequency of stator structure on noise
When the simulated peak frequencies of radial electromagnetic force density of SMPMSM are close to the natural frequencies of SMPMSM, it will produce resonance and then lead to noise generation. In addition, when the modulated switching frequencies by fundamental frequency are close to the natural frequencies of SMPMSM, it will also generate resonance and lead to the noise production. Therefore, the natural frequency of the SMPMSM is one of reasons of noise generation.
According to the modal test (Section 3.1), the vibration mode (m= 2, 3, 4, 5) shapes of stator structure are obtained, as depicted in Fig. 13.
Fig. 13First four vibration mode (m= 2, 3, 4, 5) shapes of stator structure obtained by experiment
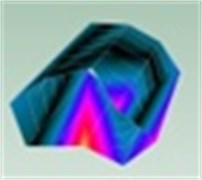
a)m= 2
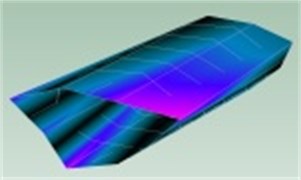
b)m= 3
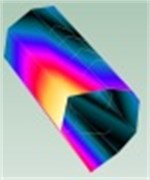
c)m= 4
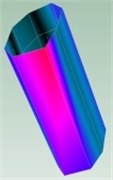
d)m= 5
4.2.1.1. Comparison on frequencies
Table 8 contains a comparison among measured natural frequencies of stator structure, modulated switching frequencies by fundamental frequency, simulated peak frequencies of radial electromagnetic force density and measured peak frequencies of SPL. As illustrated in Table 8, the SPL peak frequencies of 1600 Hz, 2272 Hz, 2880 Hz, 5024 Hz, 5792 Hz, 6128 Hz and 6496 Hz are caused by resonance generated by simulated peak frequencies of radial electromagnetic force density coinciding with measured natural frequencies of stator structure; the SPL peak frequencies of 3328 Hz, 3600 Hz, 3872 Hz, 4128 Hz, 4400 Hz, 4672 Hz, 7200 Hz, 7472 Hz and 7728 Hz are produced by resonance generated by simulated peak frequencies of radial electromagnetic force density consistent with measured natural frequencies of stator structure and modulated switching frequencies by fundamental frequency. Therefore, in order to decrease the noise of SMPMSM, the natural frequencies of stator structure should be not consistent with the simulated peak frequencies of radial electromagnetic force density and modulated switching frequencies by fundamental frequency to avoid resonance.
4.2.2. Influence of wall thickness of stator structure on noise
In order to avoid resonance, the natural frequency of stator structure should be changed. Fig. 14 shows the relationship between the circumferential natural frequencies of stator structure and the wall thickness of stator structure [21].
Table 8Comparison on frequencies
Measured natural frequencies of stator structure / Hz | Simulated peak frequencies of radial electromagnetic force density / Hz | Modulated switching frequencies by fundamental frequency / Hz | Measured peak frequencies of SPL / Hz |
1540.1 | 1600 | – | 1600 |
2201.4 | 2133 | – | 2272 |
2954 | 2933 | – | 2880 |
3253.4 | 3200 | 3333.3 | 3328 |
3593.3 | 3733 | 3600 | 3600 |
3855.8 | 4000 | 3866.7 | 3872 |
4225.3 | 4266 | 4133.3 | 4128 |
4548 | 4533 | 4400 | 4400 |
4710.6 | 4800 | 4666.7 | 4672 |
5129.6 | 5066 | – | 5024 |
5732.1 | 5866 | – | 5792 |
6107.3 | 6133 | – | 6128 |
6378.1 | 6399 | – | 6496 |
7151.9 | 7199 | 7200 | 7200 |
7600.2 | 7466 | 7466.7 | 7472 |
7722.3 | 7733 | 7733.3 | 7728 |
Fig. 14Circumferential natural frequencies of stator structure with different wall thickness
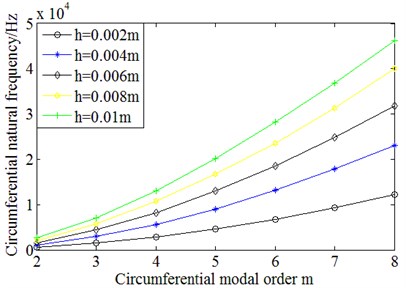
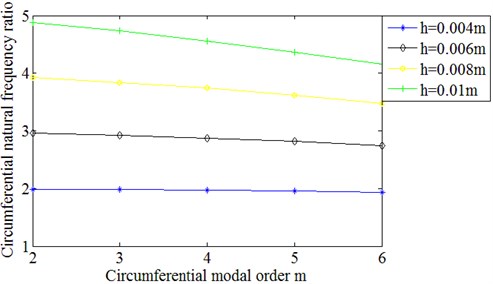
For the further analysis, the circumferential natural frequencies of stator structure with different wall thickness are divided by the circumferential natural frequencies corresponding to the orders of stator structure with 0.002 m wall thickness. The results are shown in Fig. 15.
From Fig. 15, it can be seen that the ratio of the circumferential natural frequencies of stator structure with different wall thickness is approximately equal to the ratio of the wall thickness of stator structure. Therefore, the circumferential natural frequencies of stator structure are approximately linearly proportional to its wall thickness. The expression is as follows:
However, with the increase of circumferential modal order, the ratio slightly declines.
The method of increasing the wall thickness of stator structure can be applied to change the natural frequencies of stator structure. This method can make the natural frequencies of stator structure not to agree with simulated peak frequencies of radial electromagnetic force density and modulated switching frequencies by fundamental frequency, which can avoid resonance generation and so as to achieve the purpose of noise reduction.
Fig. 15Ratio between circumferential modal frequencies of stator structure with different wall thickness and those of 0.002 m wall thickness
4.3. Coefficient of relative sound intensity
4.3.1. Analysis on coefficient of relative sound intensity
The bigger the coefficient of relative sound intensity is, the greater the noise emission is. Therefore, the coefficient of relative sound intensity is one of factors influencing on the noise magnitude of SMPMSM.
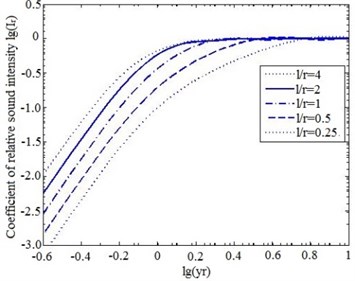
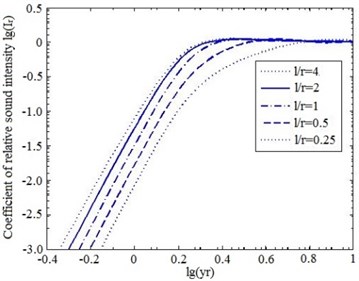
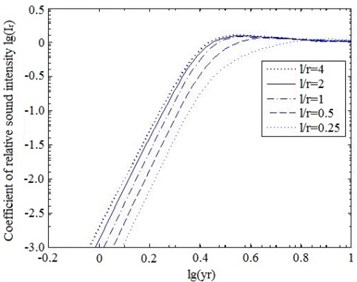
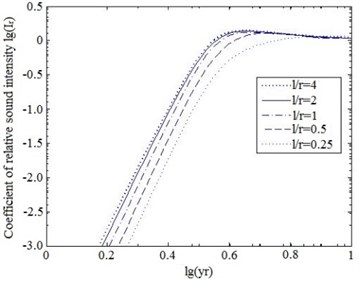
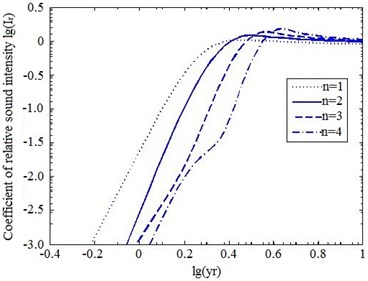
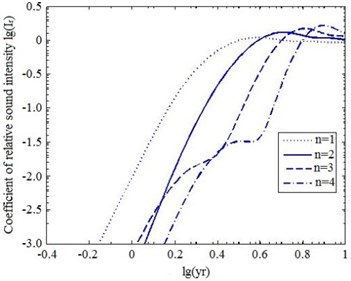
The coefficient calculation method for relative sound intensity considering the axial modes is presented [22], as depicted in Eq. (17). The relationship among the coefficient of relative sound intensity, length-radius ratio of stator and the order of circumferential and axial modes is analyzed (as shown in Fig. 16):
From Fig. 16, it can be seen that the smaller the length-radius ratio of stator is, the smaller the coefficient of relative sound intensity is. The higher the order of axial and circumferential modes is, the smaller the coefficient of relative sound intensity is. This provides the theoretical basis for determining the size of the SMPMSM with low noise.
Fig. 16Curves of coefficient of relative sound intensity
a)m= 1, n= 1
b)m= 2, n= 1
c)m= 3, n= 1
d)m= 4, n= 1
e)m= 2, l/r= 2
f)m= 2, l/r= 1
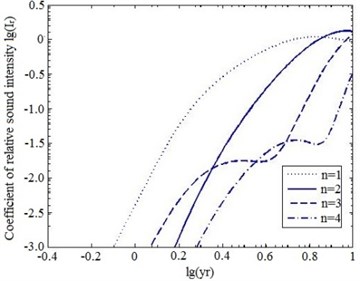
g)m=2, l/r= 0.5
4.3.2. Method for decreasing coefficient of relative sound intensity
The coefficient of relative sound intensity is related to the modal orders of motor vibration, the effective radius of stator surface and the length-radius ratio of stator. During the design of the motor, the length-radius ratio of stator can be properly reduced, namely, the radius of stator is increased and the length of stator is decreased, but the volume of stator is kept unchanged, so that the coefficient of relative sound intensity of motor is reduced, and then the purpose of noise reduction is achieved.
5. Comprehensive noise reduction method for SMPMSM
According to the above analysis, a comprehensive method including single cutting of two end rabbets of motor case in single clamping, opening a slot in the middle position of the stator tooth, increasing the wall thickness of stator structure and decreasing the length-radius ratio of stator, is proposed. The noise values and SPL spectra of improved motor with applying the comprehensive method at different speeds, loads and switching frequencies are tested.
Fig. 17 and Table 9 contain a comparison on noise values between the original motor and the improved motor with applying the comprehensive method at different speeds, loads and switching frequency of 4 kHz.
Fig. 17Comparison on noise values between original motor and improved motor with applying comprehensive method at different speeds, loads and switching frequency of 4 kHz
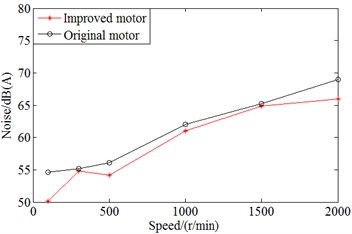
a) No load
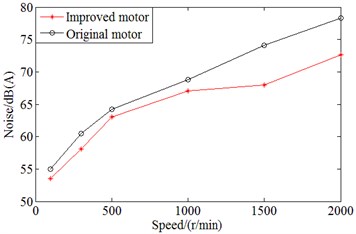
b) Half load
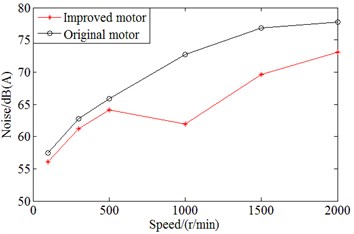
c) Full load
As displayed in Fig. 17 and Table 9, noise values of improved motor are smaller than those of original motor at different speeds, loads and switching frequency of 4 kHz. In addition, as compared to the noise value of original motor, at the speed of 1000 rpm, full load and switching frequency of 4 kHz, the noise value is reduced the most, namely, 10.8 dB(A); the relative reduction in percentage of noise value is about 14.86 %. At the rated speed of 2000 rpm, full load and switching frequency of 4 kHz, the noise value is reduced by 4.7 dB(A); the relative reduction in percentage of noise value is about 6.04 %.
Fig. 18 shows the comparison on SPL spectra with motor before and after applying the comprehensive method at the rated speed of 2000 rpm, full load and switching frequency of 4 kHz. From Fig. 18, it can be seen that the number of peak points and peaks on SPL spectrum of improved SMPMSM with applying the comprehensive method are significantly lower than the original motor’s one.
Table 9Comparison on noise values between original motor and improved motor with applying comprehensive method at different speeds, loads and switching frequency of 4 kHz
Speed/ (rpm) | Working conditions | ||||||||
No load | Half load | Full load | |||||||
Original motor / dB(A) | Improved motor / dB(A) | Decrease rate / % | Original motor / dB(A) | Improved motor / dB(A) | Decrease rate / % | Original motor / dB(A) | Improved motor / dB(A) | Decrease rate / % | |
100 | 54.6 | 50.1 | 8.24 | 55 | 53.5 | 2.73 | 57.5 | 56.1 | 2.43 |
300 | 55.2 | 54.8 | 0.72 | 60.5 | 58.1 | 3.97 | 62.8 | 61.2 | 2.55 |
500 | 56.1 | 54.2 | 3.39 | 64.2 | 63 | 1.87 | 65.9 | 64.1 | 2.73 |
1000 | 62 | 61 | 1.61 | 68.8 | 67.1 | 2.47 | 72.7 | 61.9 | 14.86 |
1500 | 65.2 | 64.9 | 0.46 | 74.1 | 68 | 8.23 | 76.8 | 69.6 | 9.38 |
2000 | 69 | 66 | 4.35 | 78.3 | 72.6 | 7.28 | 77.8 | 73.1 | 6.04 |
Fig. 18Comparison on SPL spectra of SMPMSM before and after improvement at the rated speed of 2000 rpm, full load and switching frequency of 4 kHz
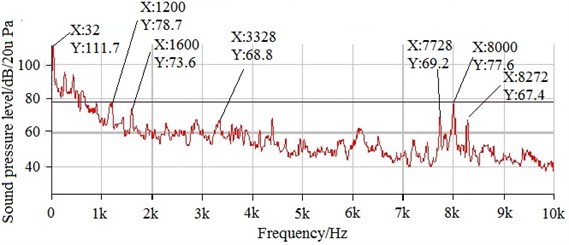
a) SPL spectrum of SMPMSM before improvement at the rated speed of 2000 rpm, full load and switching frequency of 4 kHz
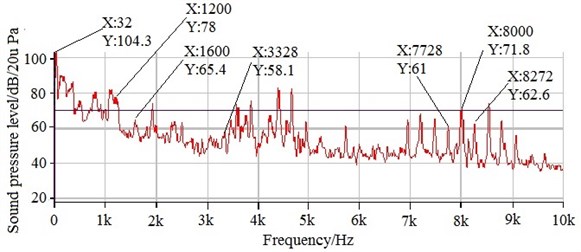
b) SPL spectrum of SMPMSM after improvement at the rated speed of 2000 rpm, full load and switching frequency of 4 kHz
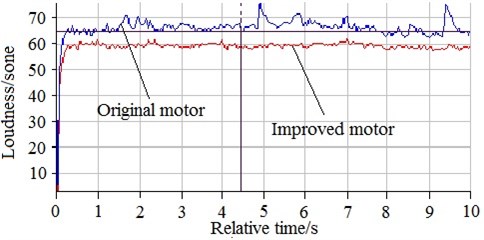
In order to better describe the influence of applying the comprehensive method on noise of the original motor, the indexes of auditory perception are also tested, namely, the sharpness and loudness of the original motor and the improved motor with applying the comprehensive method at no load are respectively tested, as depicted in Fig. 19 and Fig. 20. Furthermore, sharpness mainly considers the contribution of the high-frequency energy to the total energy; loudness refers to the intensity of auditory sound of psychological perception.
Table 10 shows the comparison on the average values of sharpness and loudness between original motor and improved motor with applying the comprehensive method at no load. From Table 10, it can be seen that the average values on sharpness and loudness of improved motor with applying the comprehensive method are respectively reduced by 0.522 acum and 6.97 sone as compared to those of original motor. Therefore, applying the comprehensive method can effectively reduce the noise of SMPMSM.
Table 10Comparison on average values of sharpness and loudness between original motor and improved motor with applying the comprehensive method
Motor | Average sharpness / acum | Average loudness / sone |
Improved motor | 2.472 | 60.56 |
Original motor | 2.994 | 67.53 |
Fig. 19Comparison on sharpness between original motor and improved motor with applying the comprehensive method at no load
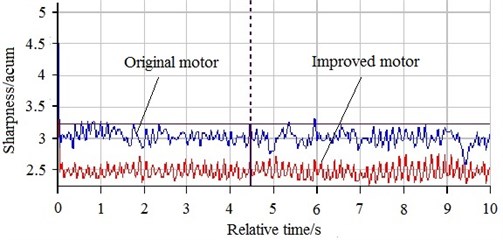
Fig. 20Comparison on loudness between original motor and improved motor with applying the comprehensive method at no load
6. Conclusions
Through the above analysis on causes for noise generation and application of methods for suppressing noise of SMPMSM, the following conclusions are obtained:
1) The rotating frequency of SMPMSM, and the rotating frequency interaction with stator slots, magnetic poles can cause the noise generation. Applying the method of single cutting of two end rabbets of motor case in single clamping can effectively reduce noise at half and full load, different speeds and switching frequency of 4 kHz. In addition, at the rated speed of 2000 rpm, full load and switching frequency of 4 kHz, the noise value is reduced the most, about 4.1 dB(A); the reduction in percentage is about 5.26 %.
2) The radial electromagnetic force is the main reason of noise generation of low-and-middle frequencies. The MatLab signal processing technology is used to reconstruct radial electromagnetic force density waveform, and then the cause of SMPMSM noise generation is found out. The structure of SMPMSM is improved, namely, opening a slot in the middle position of the stator tooth. Therefore, the power spectrum density corresponding to the frequencies which generate peaks in the SPL spectrum is decreased.
3) When the natural frequencies of stator structure are consistent with peak frequencies of the radial electromagnetic force density and modulated switching frequencies by fundamental frequency, the resonance which causes the noise will be produced. Through enhancing switching frequencies and increasing the wall thickness of stator structure, the resonance can be avoided, and then the noise will be reduced.
4) The coefficient of relative sound intensity has some influence on noise emission. The coefficient of relative sound intensity can be reduced through decreasing the length-radius ratio of stator, so that it can reduce the noise.
5) A comprehensive method including single cutting of two end rabbets of motor case in single clamping, opening a slot in the middle position of the stator tooth, increasing the wall thickness of stator structure and decreasing the length-radius ratio of stator is proposed to reduce noise of SMPMSM. As compared to it of original motor, the noise value at the rated speed of 2000 rpm, full load and switching frequency of 4 kHz is reduced by 4.7 dB(A); the values of loudness and sharpness at no load are respectively reduced by 6.97 sone and 0.522 acum with improved motor.
References
-
Bianchini C., Immovilli F., Lorenzani E., et al. Review of design solutions for internal permanent-magnet machines cogging torque reduction. IEEE Transactions on Magnetics, Vol. 48, Issue 10, 2012, p. 2685-2693.
-
Tang Renyuan Modern Permanent Magnet Machines: Theory and Design. China Machine Press, Beijing, 2016.
-
Lee S. H., Han K. K., Ahn H. J., et al. A study on reduction of vibration based on decreased cogging torque for interior type permanent magnet motor. Industry Applications Society Meeting, 2008.
-
Huang S., Aydin M., Lipo T. A. Low noise and smooth torque permanent magnet propulsion motors: comparison of non-slotted and slotted radial and axial flux topologies. International Aegean Conference on Electrical Machines and Power Electronics, 2001
-
Delfa P. L., Hecquet M., Gillon F., et al. Analysis of radial force harmonics in PMSM responsible for electromagnetic noise. Proceedings of 10th International Conference on Ecological Vehicles and Renewable Energies, 2015.
-
Chen Yongxiao, Zhu Ziqiang, Ying Shancheng Analysis and Control of Motor Noise. Zhejiang University Press, Zhejiang, 1987.
-
Tang Renyuan, Song Zhihuan, Yu Shenbo, et al. Study on source of vibration and acoustic noise of permanent magnet machines by inverter. Electric Machines and Control, Vol. 14, Issue 3, 2010, p. 12-17.
-
Yu Shenbo Researches on Behavior of Vibration and Noise in Permanent Magnet Synchronous Motor. Ph.D. Thesis, Shenyang University of Technology, Shenyang, 2006.
-
Li Xiaohua, Huang Surong, Li Liangzi Calculation and analysis of vehicle vibration and noise of permanent magnet synchronous motor applied in electric vehicle. Electric Machines and Control, Vol. 17, Issue 8, 2013, p. 37-42.
-
Boesing M., Kasper K. A., De Doncker R. W. Vibration excitation in an electric traction motor for a hybrid electric vehicle. Proceedings of Inter-Noise and Noise-Con Congress and Conference Proceedings, 2008, p. 2451-2562.
-
Yu Shenbo, Wang Weiqi, Zhong Shuangshuang, et al. Modal analysis of permanent magnet synchronous motorized spindle based on experimental and finite element method. Heavy Machinery, Vol. 5, 2016, p. 68-71.
-
Dai Ying, Cui Shumei, Song Liwei Finite element method modal analysis of driving motor for electric vehicle. Proceedings of the Chinese Society for Electrical Engineering, Vol. 31, Issue 9, 2011, p. 100-104.
-
Chen Shikun Motor Design. China Machine Press, Beijing, 1985.
-
Gieras J. F., Wang C., Lai J. C. Noise of Polyphase Electric Motors. CRC Press, Boca Raton, 2006.
-
Yang Haodong Electromagnetic Vibration Analysis of Permanent Magnet Synchronous Motor. Ph.D. Thesis, Zhejiang University, Hangzhou, 2011.
-
Yu Shenbo, Duan Wei, Zhong Shuangshuang Research on electromagnetic vibration of permanent magnet synchronous motorized spindle. Machinery, Vol. 42, Issue 4, 2015, p. 5-8.
-
Yu Shenbo, Jiang Feifei, Wang Hui, et al. Analysis of radial electromagnetic force of fractional slot motor for permanent magnet synchronous motorized spindle. Modular Machine Tool and Automatic Manufacturing Technique, Vol. 5, 2014, p. 1-5.
-
Chen Zhiyu, Huang Kaisheng, Tian Yanfei, et al. Research on vibration and noise suppression of permanent magnet synchronous motor. Micromotors, Vol. 47, Issue 3, 2014, p. 20-24.
-
Huang Guozhi, Fu Fengli Technical Manual of Y2 Series Three-Phase Asynchronous Motor. China Machine Press, Beijing, 2004.
-
Song Zhihuan Research on Recognition of Electromagnetic Noise and Vibration of Permanent Magnet Synchronous Machine. Ph.D. Thesis, Shenyang University of Technology, Shenyang, 2010.
-
Yu Shenbo, Wang Hui Investigation of circumferential mode frequencies of circular cylindrical shells of stator in electric motor. Electric Machines and Control, Vol. 18, Issue 6, 2014, p. 102-107.
-
Yu Shenbo, Hu Weilong, Zhong Shuangshuang Calculation of the noise of the permanent magnet synchronous motor spindle with the influence of the axial modal. Modular Machine Tool and Automatic Manufacturing Technique, Vol. 5, 2015, p. 66-68.
About this article
The paper has been supported by the National Natural Science Foundation of China (Grant No. 51175350) and the Science and Technology Plan Project of Shenyang (Grant No. F15-199-1-13).

