Abstract
Histological thickness of cutaneous melanoma (CM), known as the Breslow index (pT), represents the most important prognostic factor. The objective of this study is to evaluate the reliability of automatic algorithm based on B-scan image processing of 22 MHz ultrasound (US) for measuring the thickness of CM and melanocytic nevi (MN). The thickness of CM ( = 54) and MN ( = 91) has been measured manually (mT) and automatically (aT) using an algorithm based on B-scan image processing of 22 MHz US. All melanocytic skin tumours (MST) were surgically excised and their histological thicknesses (pT) according to Breslow were evaluated. The investigated parameters were expressed as medians with interquartile range (IQR) because of their asymmetric distribution, Spearman’s correlation coefficient was determined as well. An agreement between values of mT/aT and mT/pT was evaluated by using the Bland-Altman plots. We found a good agreement of aT and mT with the moderate bias of 0.08 mm and relatively small range (95 % CI –0.01 to 0.18) in CM, accordingly 0.03 mm (95 % CI 0.00 to 0.07 mm) regarding MN. The medians of mT/pT in cases of CM and MN were 0.96 mm (IQR: 0.65-1.52) / 0.97 (IQR: 0.66-1.62) and 0.51 mm (IQR: 0.37-0.67) / 0.69 mm (IQR: 0.46-1.01) respectively. The parameters of the thickness correlated better in CM ( = 0.86) than in MN ( = 0.64) cases. The difference between manual (mT) and automatic (aT) measurements while evaluating the thickness of MST was non-significant. Therefore, automatic algorithm based on B-scan image processing of 22 MHz US is a reliable tool for measuring the thickness of MST by less experienced operators.
1. Introduction
Histological thickness of cutaneous melanoma (CM), known as the Breslow index (pT), represents the most important prognostic factor for TNM staging. Therefore, it is necessary first to perform the excision of CM for evaluation of pT, and then to plan re-excision with or without the biopsy of the sentinel lymph node [1]. A 15 MHz ultrasound (US) examination was first proposed in the 1970s for the measurement of skin thickness [2]. Nowadays, US of 20 MHz and higher is an effective tool for measuring the thickness of melanocytic skin tumours (MST) [3-6]. US transducers of 20-100 MHz frequency allow for the resolution of 16-80 μm and achieve the skin penetration depth of 1 to 6 mm. The spatial resolution of the US increases with increasing frequency, while the penetration depth decreases [4, 7].
The review of Jasaitiene et al [7] and the recent studies [3, 5, 8, 9-16] showed a good correlation between pT and manually (mT) measured US thickness of MST using a 20-100 MHz transducer (Table 1). An overestimation of mT resulting from the impossibility of differentiating lymphocytic infiltrate or underlying melanocytic nevus cells from CM tissue has been reported in most studies [3, 5, 9-11]. Some authors reflected that cutaneous appendages such as sebaceous glands or hair follicles might affect the differences between mT and pT [5, 6] It has been discussed that sources of error in the acoustic measurements, including hydrophone calibration and spatial averaging, as well as nonlinear distortions and mechanical alignment could also be the cause of discrepancies between mT and pT [17].
Table 1Correlation of tumor thicknesses between 20-100 MHz ultrasound and histological examination in melanocytic skin tumours: a review of clinical studies
Authors, year | Frequency of ultrasound (MHz) | Type and number of investigated skin tumours | Correlation coefficient (r) or agreement † | Number of investigators | |
mT | pT | ||||
Serrone et al., 2002 (10) | 20 | Melanoma ( 139) | 0.95 | – | – |
Pellacani et al., 2003 (6) | 20 | Melanoma ( 40) | 0.89 | – | – |
Bessound et al., 2003 (8) | 20 | Melanocytic skin tumours ( 130) | 0.96 | – | – |
Gambichler et al., 2007 (11) | 20 and 100 | Melanoma ( 13), melanocytic nevi ( 37) | 0.99 (equal with both US frequencies), 20 MHz ultrasound revealed higher bias comparing with 100 MHz | One | – |
Guitera et al., 2008 (13) | 75 | Melanoma ( 52), melanocytic nevi ( 36) | 0.91 | Two | – |
Machet et al., 2009 (3) | 20 | Melanoma ( 31) | Moderate * (0.18 mm; limits of agreement were estimated at –1.4 and 1.8 mm) | Four | Two |
Hayashi et al., 2009 (12) | 30 | Melanoma ( 68) | 0.89 | – | Unknown number of different pathologists |
Crisan et al., 2013 (5) | 20 | Basal cell carcinoma ( 18), melanoma ( 28) | Linear correlation 98.4 % | – | – |
Meyer et al., 2014 (14) | 25 | Melanoma ( 67), melanocytic nevi ( 54) | Very good * (–0.01 mm; 95% CI: –0.157 to 0.137 mm) | Two (the same sample size) | – |
Botar-Jid et al., 2016 (15) | 40 | Melanoma ( 42) | Very good * (–0.05 mm; 95 % CI: –0.24 to 0.13 mm) | One | – |
Andrekute et al., 2016 (16) | 22 | Melanoma ( 6) Melanocytic nevi ( 46) (all skin tumours were up to 1 mm in thickness) | 0.68 (0.06 mm; limits of agreement were estimated at –0.4 and 0.51 mm) | One | Two (the same sample size) |
As far as we know, in all previously described studies, US thickness of MST was measured manually by marking the boundaries with electronic calipers on B-scan images. The limitation of this technique is that such procedure requires highly experienced operators, and image analysis is time- consuming. The intention of our study was to evaluate the reliability of an automatic algorithm based on the processing of 22 MHz US B-scan images for measuring the thickness of CM and melanocytic nevi (MN) in comparison with mT and pT values. The automatic algorithm could save the time for analysis and act as a support tool for the final decision. To the best of our knowledge, so far there have been no data published on that approach.
2. Materials and methods
2.1. Study design and subjects
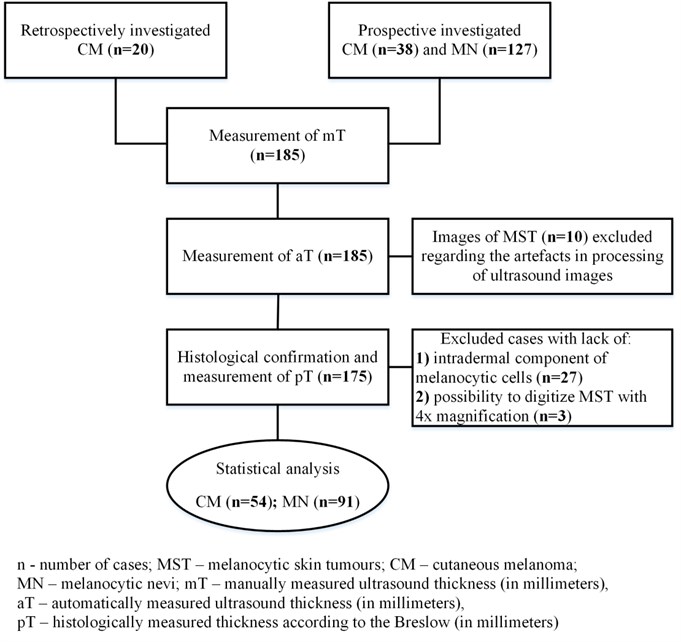
The cases of clinically and dermatoscopically suspicious MST ( 165) were investigated prospectively before excision from September 2014 until the end of July 2015. The MST with exophytic growth, ulceration, diameter ≥2 cm, or localized on the scalp or other areas that prevent full contact with a US transducer were not included in the study. Twenty cases of CM whose US images and histological samples had been collected during 2013-2014 were additionally included retrospectively. After US and histologic examination, 54 cases of CM and 91 of MN were selected for the final statistical analysis (Fig. 1). All measurements were performed with the approval of the Institutional Review Board after patients’ informed consent has been obtained and in accordance with the Declaration of Helsinki protocols.
Fig. 1The methodology of the study
2.2. Ultrasonic examination
US images of MST were acquired by a single dermatologist using a US scanner and a broadband mechanically steered single-element focused transducer with 22 MHz central frequency (DUB-USB, Taberna Pro Medicum, Germany). US velocity of 1580 m/s was set during the scanning. Each skin tumor was scanned along the longitudinal axis with the US transducer applied perpendicular to the MST. Several B-scans were acquired for each case in order to define the highest thickness (mT) from the surface of the MST to its deepest point. All MST were hypo-echoic and the majority of them were well-delimited from the adjacent dermis (Fig. 2(a)). The mT was evaluated with 0.01 mm accuracy using the original imaging and analysis software supplied by the manufacturer (Fig. 2(a)). Another dermatologist estimated the mT of 15 % of randomly selected B-scan images of the MST. The raw US data were converted to the digital B-scan image in the Digital Imaging and Communications in Medicine (DICOM) format, and were sent to the automated Picture Archiving and Communication System (PACS) workstation [18, 19] using Meddream software (Softneta, Lithuania). In order to perform the automated analysis of the spatial dimensions of the MST within the acquired US B-scan images, the software based on thresholding, spatial filtering, and contour detection of the MST was developed by the authors of this study (Fig. 2(b)).
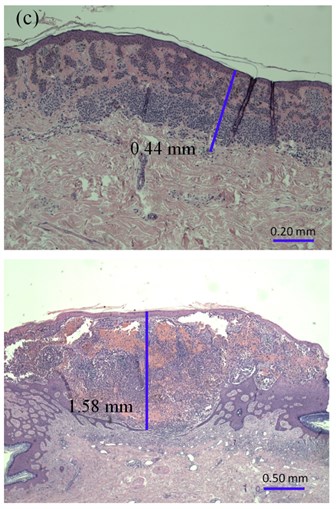
Fig. 2The thickness of: a) melanocytic nevi (above) and melanoma (below) estimated manually, b) automatically using 22 MHz ultrasound, c) histologically by QCapture Pro 7 software


The acquired US B-scan image had a two-dimensional region of interest within the cross-section of superficial skin tissue. Each point (pixel) in such image had a particular value of amplitude within the range from 0 up to 255 levels, limited by the number of quantization levels of the US system. The main steps of US image processing for estimation of aT of the MST are listed in Table 2. During the automatic analysis, calibration of US images was performed by defining particular pixels size in lateral and axial directions. The pixel size in the lateral direction corresponded to the lateral scanning step of the US transducer, and was equal to 33 μm. The pixel size of approximately 8 μm in the axial direction corresponded to the ratio of the maximum axial length of the available region of interest (8 mm) and the number of the samples of the digitized US radiofrequency signal (1022 samples). The velocity of the US signal in human skin was assumed to be 1580 m/s [23].
2.3. Histological estimation
After excision, all MST samples were fixed in 10 % formalin solution for 2 days. The fixed material was cut into 2 parts along the Y axis before paraffin embedding. The sections of 3 µm from the thickest part of the MST were stained with hematoxylin and eosin (H&E). A single experienced pathologist evaluated all the prepared samples by using the Olympus BX43 microscope (Germany) and a 10× magnification ocular with a micrometer. The smallest graduation value of the micrometer was 0.01 mm. The thickness of the MST (pT) was assessed from the top of the granular layer of the epidermis to the deepest part of the tumor. All samples were digitized, and the Breslow index (pT1) of the MST was measured using QCapture Pro 7 software (QImaging, Canada) (Fig. 2(c)). An independent pathologist estimated the thickness (pT2) in 15 % of the indiscriminately selected MST with the Olympus BX51 microscope (Germany). The micrometer was integrated on the pad of the microscope with the accuracy of 0.1 mm. The investigators were blinded to each other’s results.
Table 2Steps of B-scan image processing by an automatic segmentation algorithm for measuring MST thickness
Steps | Description |
Image pre-processing | Noise reduction, thresholding, application of spatial mean filter (size 3×3) |
Detection of the skin surface | Procedure of adaptive image binarization [20], edge detection and estimations of contour line [21] |
Detection of the first boundary (beginning) of the MST | |
Detection of the second boundary (bottom) of the MST | Thresholding, iterative application of spatial dilation, erosion and mean filters (size 3×3) [22] |
Evaluation of the lesion’s shape according to the detected boundaries | Iterative reconstruction of the shape region, contouring and segmentation |
Estimation of thickness, size and contour of the MST | Evaluation of the area and the widest and deepest cross-sections of the reconstructed contour. Indication of estimates and visualization of the contour |
MST – melanocytic skin tumours | |
2.4. Statistical analysis
The statistical data were analyzed with SPSS Version 22 (SPSS Inc., USA) and MedCalc (Belgium). Because of the insufficient quality factors of the acquired US B-scan images due to the presence of noise, blurring effects, and low hypo-echogenicity of the MST, 10 cases were excluded from the comparative analysis of the US measurements. During histological evaluation, MST without the intradermal component ( 27) and tumors (pT > 3.5 mm) that could not fit into the digital camera’s range of vision with 4× magnification ( 3) were excluded from the final statistical analysis (Fig. 1).
The measurement values of mT and pT were expressed as medians with interquartile (IQR) range because the Kolmogorov-Smirnov test confirmed their asymmetric distribution. Spearman’s correlation coefficient was used to determine correlations between parameters of the thickness. An agreement between values of mT/aT and mT/pT was evaluated by using the Bland-Altman plots. This method is more useful and informative than correlation alone because it includes the numerical identity between the test results of two different methods [24]. The intra-class correlation coefficient (ICC) was used to assess the variability of the quantitative measurements between different observers.
3. Results
In total, 127 patients with the mean age of 47.3 years (SD: 17.58) were included in the study. The localizations and morphological characteristics of the MST are provided in Table 3.
The value of the intra-class correlation coefficient of mT compared between two dermatologists was 0.98 (95 % CI 0.96 to 0.99). The inter-observer variability between pT and pT1 (measurement by using the software) was equal to 1, and between pT and pT2 (measurement performed by independent pathologist) –0.94 (95 % CI 0.86 to 0.97). Therefore, we used pT values as the reference measurement.
The median thickness of mT and aT in cases of CM was, correspondingly, 0.96 mm (IQR: 0.65-1.52) and 0.98 mm (IQR: 0.62-1.65), and in MN- 0.51 (IQR: 0.37-0.67) and 0.50 mm (IQR: 0.36-0.74), accordingly. A strong correlation was detected between mT and aT in cases of CM ( 0.84) and MN ( 0.87). We found a very good agreement of mT and aT with the bias of 0.08 mm and relatively small range (95 % CI –0.01 to 0.18) in CM; in MN, it was 0.03 mm (95 % CI 0.00 to 0.07 mm) (Fig. 3(a, b)). As the difference between mT and aT was non-significant in CM and MN, we used manual US thickness as a reference parameter in comparison with pT.
Table 3Characteristics of the investigated melanocytic skin tumours
Features | % | ||
Type of melanocytic skin tumours | Superficial spreading CM | 29 | 20 |
Nodular CM | 1 | 1 | |
Lentigo maligna melanoma | 5 | 3 | |
Malignant melanoma, NOS | 19 | 13 | |
Intradermal MN, non-dysplastic | 1 | 1 | |
Compound MN, non-dysplastic | 49 | 34 | |
Compound MN, dysplastic | 41 | 28 | |
Anatomical location of melanocytic skin tumours | Trunk | 82 | 57 |
Upper limbs | 27 | 18 | |
Lower limbs | 33 | 23 | |
Face | 3 | 2 | |
In total | 145 | 100 | |
– number of cases, CM – cutaneous melanoma; MN – melanocytic nevi; NOS – not otherwise specified | |||
Fig. 3Bland-Altman plots showing differences between manually and automatically measured ultrasound thickness in: a) 54 cutaneous melanomas, b) 91 melanocytic nevi. SD – standard deviation
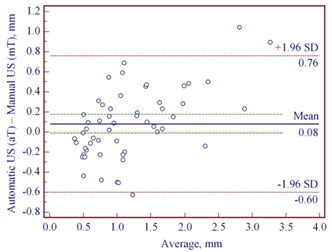
a)
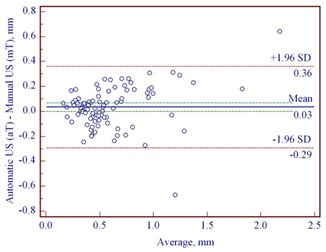
b)
Table 4 shows the correlation between manual and histological thicknesses of CM and MN. The thicknesses of MN were lower than CM according to the median values, and the correlation between mT and pT was better in cases of CM, with the median thickness of 0.97 mm (Table 4).
Table 4Comparison of the thickness of the investigated melanocytic skin tumours (n= 145) measured manually and histologically
Melanocytic skin tumours | Measurement parameters (mm) | |||||||
mT | pT | |||||||
Median | First quartile | Third quartile | Median | First quartile | Third quartile | |||
Cutaneous melanoma | 54 | 0.96* | 0.65 | 1.52 | 0.97* | 0.66 | 1.62 | 0.86 |
Melanocytic nevi | 91 | 0.51* | 0.37 | 0.67 | 0.69* | 0.46 | 1.01 | 0.64 |
– number of cases; mT – manually measured ultrasound thickness; pT – histologically measured thickness according to the Breslow; – Spearman’s correlation coefficient between mT and pT ( 0.001); *statistically significant difference ( 0.05) between medians of cutaneous melanoma and melanocytic nevi | ||||||||
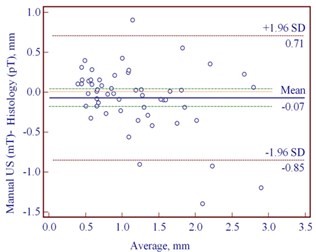
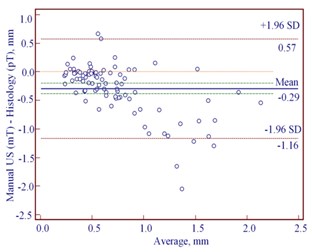
The Bland-Altman plots revealed the mean difference of manually estimated US thickness to be –0.07 mm (95 % CI –0.18 to 0.04 mm) in reference with pT in cases of CM (Fig. 4(a)). In contrast, we found greater mean difference of –0.29 mm (95 % CI –0.39 to –0.20) between mT and pT in cases of MN (Fig. 4 (b)). Table 4 shows that MN with the median histological thickness of 0.69 mm was underestimated while measuring manually by US. Manual US thickness in 73/91 cases of MN was underestimated comparing with pT ( 0.001). We found 27/54 underestimated and 27/54 overestimated mT in reference with pT in cases of CM, but this difference was not statistically significant.
Fig. 4Bland-Altman plots showing differences between manually measured ultrasound thickness and histology in: a) 54 cutaneous melanomas, b) 91 melanocytic nevi. SD – standard deviation
a)
b)
4. Discussion
High frequency (20 MHz and higher) US allows for measuring the thickness of CM and MN in vivo, but its precision depends on the experience of the observer [5, 13, 16]. Therefore, Wortsman et al. recommend that a physician a dermatologist or a radiologist- should be the person to perform ultrasonic examination [25]. The differences between mT measurements by two experienced dermatologists were found to be irrelevant in our study as well as in studies by other researchers [13, 14]. In addition, we found non-significant differences between mT and aT measurements regarding the analyzed MST. Consequently, the automatic US algorithm could be offered for less trained observer.
One recent study has proposed an automated analysis of 22 MHz US based on radiofrequency (RF) signals for an effective thickness measurement of MST up to 1 mm [16]. Differently from the technique analyzed in the present study, this method is under improvement for implementation in clinical practice. The authors have found an underestimation of thinner than 1 mm MST by US in comparison with pT [16]. In our study, MN of the median histological thickness of 0.69 mm were underestimated as well when measuring manually and automatically by US. Lower values of mT in comparison with pT of CM were found in some other studies as well [5, 6]. Researchers have hypothesized that underestimation could occur in cases when small groups of melanocytic cells penetrate into the dermis [16]. It is known, that B-scan images are acquired by moving the US transducer across the skin tumour and searching for the thickest cross-section. In our opinion, this fact could have an influence on the mismatch between the cross-sections of B-scan image and pathological sample, and at the same time the differences between mT/aT and pT as well.
In this study, the pT of MN was significantly lower than that of CM. Therefore, the correlation between mT and pT measurements was stronger in cases of CM with median pT of 0.97 mm. Some authors found a weaker correlation between mT and pT in cases of MST thinner than 1 mm by using 20 MHz US [9, 10]. Thus, the use of 75 MHz and 100 MHz US for MST less than 1 mm in thickness has been proposed to [11-13]. The guidelines for US examination in dermatology recommend the minimum frequency of 15 MHz [25]. Schmid-Wendtner, Dill-Muller et al. suggested that the use of extremely high frequencies might limit US penetration and adequate observation [26, 27]. Some authors found strong correlations between mT and pT using 12-15 MHz US but only in MST thicker than 1 mm [28, 29].
Color Doppler ultrasound (CDU) has been recommended in previous reports for the differentiation between the benign and malignant nature of MST [30, 31]. Lassau et al. found the relationship between thickness and the extent of vascularization in cases of CM [32]. When used in conjunction with CDU to measure skin tumor vascularity, 20 MHz US correlated well with histological analysis in measuring tumour depth in 27 CM ranging from 0.26 to 8.0 mm in thickness [33]. The angiogenesis evaluated with CDU could be used to identify CM with a high metastatic potential [34]. Further development of high frequency US coupled with CDU might provide a solution to the analysis of vascularization, thickness, and structure of MST.
Compared to high frequency US, optical coherence tomography has a lower accuracy in predicting mT [14]. Therefore, high frequency US is still an advanced tool for the estimation of CM thickness in vivo in cases of tumours of around 1 mm and thicker.
This study could not avoid some limitations. One of them was the usage of 22 MHz US for the evaluation of MN less than 1mm in thickness without possibility to compare it with higher frequency US. In addition, we included 20 US images of CM retrospectively in order to collect a statistically sufficient number of cases. However, the same observer performed US examination of these cases.
5. Conclusions
Therefore, it can be concluded that manual and automatic 22 MHz US has a strong correlation with histological examination in measuring the thickness of CM with the median thickness of around 1 mm. An automatic algorithm based on the processing of 22 MHz US B-scan images is a reliable tool for measuring the thickness of MST by less experienced operators.
References
-
Ge L., Vilain R. E., Lo S., Aivazian K., Scolyer R. A., Thompson J. F. Breslow Thickness Measurements of Melanomas around American Joint Committee on Cancer Staging Cut-Off Points: Imprecision and Terminal Digit Bias Have Important Implications for Staging and Patient Management. Annals of Surgical Oncology, 2016, (in Press).
-
Alexander H., Miller D. L. Determining skin thickness with pulsed ultra sound. The Journal of Investigative Dermatology, Vol. 72, 1979, p. 17-19.
-
Machet L., Belot V., Naouri M., Boka M., Mourtada Y., Giraudeau B., Laure B., Perrinaud A., Machet M. C., Vaillant L. Preoperative measurement of thickness of cutaneous melanoma using high-resolution 20 MHz ultrasound imaging: a monocenter prospective study and systematic review of the literature. Ultrasound in Medicine and Biology, Vol. 35, 2009, p. 1411-1420.
-
Wortsman X., Wortsman J. Clinical usefulness of variable-frequency ultrasound in localized lesions of the skin. The Journal of the American Academy of Dermatology, Vol. 62, 2010, p. 247-256.
-
Crisan M., Crisan D., Sannino G., Lupsor M., Badea R., Amzica F. Ultrasonographic staging of cutaneous malignant tumors: and ultrasonographic depth index. Archives of Dermatological Research, Vol. 305, 2013, p. 305-313.
-
Pellacani G., Seidenari S. Preoperative melanoma thickness determination by 20-MHz sonography and digital videomicroscopy in combination. Archives of Dermatological Research, Vol. 139, 2003, p. 293-298.
-
Jasaitiene D., Valiukeviciene S., Linkeviciute G., Raisutis R., Jasiuniene E., Kazys R. Principles of high-frequency ultrasonography for investigation of skin pathology. Journal of the European Academy of Dermatology and Venereology, Vol. 25, 2011, p. 375-382.
-
Bessoud B., Lassau N., Koscielny S., Longvert C., Avril M. F., Duvillard P., Rouffiac V., Leclère J., Roche A. High-frequency sonography and color Doppler in the management of pigmented skin lesions. Ultrasound in Medicine and Biology, Vol. 29, 2003, p. 875-879.
-
Krahn G., Gottlober P., Sander C., Peter R. U. Dermatoscopy and high frequency sonography: two useful non-invasive methods to increase preoperative diagnostic accuracy in pigmented skin lesions. Pigment Cell Research, Vol. 11, 1998, p. 151-154.
-
Serrone L., Solivetti F. M., Thorel M. F., Eibenschutz L., Donati P., Catricalà C. High frequency ultrasound in the preoperative staging of primary melanoma: a statistical analysis. Melanoma Research, Vol. 12, 2002, p. 287-290.
-
Gambichler T., Moussa G., Bahrenberg K., Vogt M., Ermert H., Weyhe D., Altmeyer P., Hoffmann K. Preoperative ultrasonic assessment of thin melanocytic skin lesions using a 100-MHz ultrasound transducer: a comparative study. Dermatologic Surgery, Vol. 33, 2007, p. 818-824.
-
Hayashi K., Koga H., Uhara H., Saida T. High-frequency 30-MHz sonography in preoperative assessment of tumor thickness of primary melanoma: usefulness in determination of surgical margin and indication for sentinel lymph node biopsy. The International Journal of Clinical Oncology, Vol. 14, 2009, p. 426-430.
-
Guitera P., Li L. X., Crotty K., Mellenbergh R., Pellacani G., Menzies S. W. Melanoma histological Breslow thickness predicted by 75-MHz ultrasonography. British Journal of Dermatology, Vol. 159, 2008, p. 364-369.
-
Meyer N., Lauwers-Cances V., Lourari S., Laurent J., Konstantinou M. P., Lagarde J. M., Krief B., Batatia H., Lamant L., Paul C. High-frequency ultrasonography but not 930-nm optical coherence tomography reliably evaluates melanoma thickness in vivo: a prospective validation study. British Journal of Dermatology, Vol. 171, 2014, p. 799-805.
-
Botar-Jid C. M., Cosgarea R., Bolboacă S. D., Şenilă S. C., Lenghel L. M., Rogojan L., Dudea S. M. Assessment of cutaneous melanoma by use of very-high-frequency ultrasound and real-time elastography. American Journal of Roentgenology, Vol. 11, 2016, p. 1-6, (in Press).
-
Andrekute K., Valiukeviciene S., Raisutis R., Linkeviciute G., Makstiene J., Kliunkiene R. Automated estimation of melanocytic skin tumor thickness by ultrasonic radiofrequency data. Journal of Ultrasound in Medicine, Vol. 35, 2016, p. 1-9, (in Press).
-
Nagle S. M, Sundar G, Schafer M. E, Harris G. R, Vaezy S, Gessert J. M, Howard S. M, Moore M. K, Eaton R. M. US Food and Drug Administration. Challenges and regulatory considerations in the acoustic measurement of high-frequency (>20 MHz) ultrasound. Journal of Ultrasound in Medicine, Vol. 32, 2013, p. 1897-1911.
-
Gale M. E., Gale D. R. DICOM modality worklist: an essential component in a PACS environment. Journal of Digital Imaging, Vol. 13, 2000, p. 101-108.
-
Gale D. R., Gale M. E., Schwartz R. K., Muse V. V., Walker R. E. An automated PACS workstation interface: a timesaving enhancement. American Journal of Roentgenology, Vol. 174, 2000, p. 33-36.
-
Sauvola J., Pietikainen M. Adaptive document image binarization. Pattern Recognition, Vol. 33, 2000, p. 225-236.
-
Douglas D., Peucker T. Algorithms for the reduction of the number of points required to represent a digitized line or its caricature. The Canadian Cartographer, Vol. 10, 1973, p. 112-122.
-
Gonzales R., Woods R. Digital Image Processing. Prentice Hall, Third Edition, 2007, p. 627-787.
-
Weichenthal M., Mohr P., Breitbart E. W. The velocity of ultrasound in human primary melanoma tissue-implications for the clinical use of high resolution sonography. BMC Dermatology, Vol. 1, 2001.
-
Bland J. M., Altman D. G. Measuring agreement in method comparison studies. Statistical Methods in Medical Research, Vol. 8, 1999, p. 135-160.
-
Wortsman X., Alfageme F., Roustan G., Arias-Santiago S., Martorell A., Catalano O., Scotto di Santolo M., Zarchi K., Bouer M., Gonzalez C., Bard R., Mandava A., Gaitini D. Guidelines for performing dermatologic ultrasound examinations by the DERMUS group. Journal of Ultrasound in Medicine, Vol. 35, 2016, p. 577-580.
-
Schmid-Wendtner M. H., Dill-Müller D. Ultrasound technology in dermatology. Seminars in Cutaneous Medicine and Surgery, Vol. 27, 2008, p. 44-51.
-
Dill-Müller D., Maschke J. Ultrasonography in dermatology. Journal der Deutschen Dermatologischen Gesellschaft, Vol. 5, 2007, p. 689-707.
-
Kaikaris V, Samsanavicius D, Maslauskas K, Rimdeika R, Valiukevičienė S, Makštienė J, Pundzius J. Measurement of melanoma thickness - comparison of two methods: ultrasound versus morphology. Journal of Plastic Reconstructive and Aesthetic Surgery, Vol. 64, 2010, p. 796-802.
-
Music M. M., Hertl K., Kadivec M., Pavlović M. D., Hocevar M. Pre-operative ultrasound with a 12-15 MHz linear probe reliably differentiates between melanoma thicker and thinner than 1 mm. Journal of the European Academy of Dermatology and Venereology, Vol. 24, 2010, p. 1105-1108.
-
Wortsman X. Common applications of dermatologic sonography. Journal of Ultrasound in Medicine, Vol. 31, 2012, p. 97-111.
-
Scotto di Santolo M, Sagnelli M, Mancini M, Scalvenzi M, Delfino M, Schonauer F, Molea G, Ayala F, Salvatore M. High-resolution color Doppler ultrasound for the study of skin growths. Archives of Dermatological Research, Vol. 307, 2015, p. 559-566.
-
Lassau N., Lamuraglia M., Koscielny S., Spatz A., Roche A., Leclere J., Avril M. F. Prognostic value of angiogenesis evaluated with high-frequency and colour Doppler sonography for preoperative assessment of primary cutaneous melanomas: correlation with recurrence after a 5 year follow-up period. Cancer Imaging, Vol. 6, 2006, p. 24-29.
-
Lassau N., Mercier S., Koscielny S., Avril M. F., Margulis A., Mamelle G., Duvillard P., Leclère J. Prognostic value of high-frequency sonography and color Doppler sonography for the preoperative assessment of melanomas. American Journal of Roentgenology, Vol. 172, 1999, p. 457-461.
-
Lassau N., Koscielny S., Avril M. F., Margulis A., Duvillard P., De Baere T., Roche A., Leclère J. Prognostic value of angiogenesis evaluated with high-frequency and color Doppler sonography for preoperative assessment of melanomas. American Journal of Roentgenology, Vol. 178, 2002, p. 1547-1551.
About this article
This work was partially sponsored by the Scientific Foundation of Lithuanian University of Health Sciences (LUHS) under the united LUHS and Kaunas University of Technology Project SkinTechSoft “The Significance of High Frequency Ultrasound in the Diagnostics of Skin Tumors”. Special thanks to the pathologist Gintaras Sabaliauskas for the control of histological observation. The study was carried out during 2014-2015 with the permission of Kaunas Regional Biomedical Research Ethics Committee No. P2-BE-2-25/2009, Lithuania. No author has any conflict of interest.
