Abstract
Seismic evaluation and collapse prediction of structures mostly includes determination of story displacement demands, and member forces and deformations for certain hazard levels. A few methods have been developed in the decades, such as modal pushover analysis (MPA), FEMA 440, and capacity spectrum. In general, non-linear pushover analyses are applied in these methods. This paper presents a seismic evaluation and collapse prediction method based on energy balance concept. In this method, the design base shear for any given hazard level can be obtained by associating the work necessary to push the structure to the design target drift with the energy needed in a structure of an equivalent SDOF oscillator. This work energy equation can be further applied to estimate responses of existing structures under certain earthquake excitations. In this procedure, an energy-displacement plot (Ec) can be converted with the force-displacement curve (capacity) of the structure obtained by static pushover analysis. This curve is then overlaid over the energy demand plot (Ed) for the specified hazard level to determine the ultimate displacement demand. This method can be also used to obtain the collapse margin ratio (CMR) without cumbersome time-history analyses, such as incremental dynamic analysis (IDA). The drift estimations and collapse predictions of two 20-story RC moment frame structures by applying this energy balance concept were in good agreement with those obtained from inelastic dynamic analyses and IDA using a set of representative ground motion records.
1. Introduction
Different nonlinear static seismic analysis procedures have been developed for evaluation and collapse prediction purposes. Static pushover method is one of the most widely accepted tools and can be used to estimate capacities of structures [1]. In terms of collapse prediction, to obtain the collapse margin ratio (CMR), intensive time-history analysis is required by scaling each ground motion to multiple levels of intensity in a set of ground motions. As proposed in FEMA P695 [2], the incremental dynamic analysis (IDA) [3] and adjusted collapse margin ratios (ACMR) are adapted in current practice. IDA involves subjecting a given structure model to a set of ground motions, then each scaled to different levels of intensity, generating responding curves versus intensity level. Since excessive inelastic analyses to scale ground motions are needed in IDA, time and resource consuming can be expected, particularly for high rise buildings.
This paper provides a simple and direct seismic evaluation and collapse prediction procedure based on the energy balance concept. This energy balance concept was originally stated by Hounser [4] to get the plastic energy as absorbed energy by structures with the difference of input energy and elastic strain energy. Goel et al. [5] further modified this concept and develop one new plastic design method, called Performance-Based Plastic Design (PBPD) method. One of the main component in the PBPD method is to obtain design base shear by equating the work required to push the structure to the target drift with the energy needed in a structure of an equivalent SDOF system. In addition, the nonlinear behavior of structures is directly considered at beginning in the PBPD method so no iteration and repetition are needed and verified by nonlinear analyses or time history dynamic analyses once the preliminary design is done. This work energy equation can be applied to approximate the drift demand and the margin against collapse of an existing structure.
An example of 20-story reinforced concrete (RC) moment frame structures is illustrated for seismic evaluation and collapse prediction by using this procedure. The results of seismic evaluation are compared with those obtained by traditional evaluation method, which is time-history dynamic analyses and the results of collapse prediction are also verified by those obtained by IDA and ACMR. The comparisons conclude that, even without cumbersome and intensive time-history analyses, this procedure based on PBPD energy balance concept has good agreement with the methods in current practice.
2. Energy balance concept
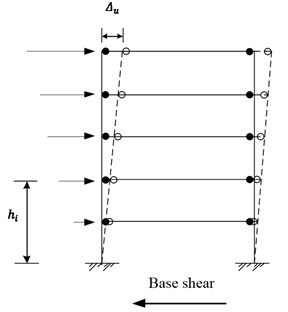
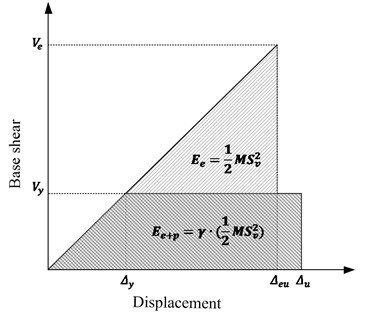
Compared to traditional design method, the target roof drift and designated yield mechanism are employed in the PBPD method at the beginning of design. These two key parameters are associated to the level and allocation of damages in a structure under seismic excitation, respectively. In traditional design procedure, the design base shear is usually given by design spectrum in the codes; while in the PBPD method, the design base shear is determined by equating the work necessary to monotonically push the structure to the target drift to the energy required by an equivalent EP-SDOF to achieve the same state (Fig. 1) for a specified hazard level. In addition, distribution of lateral design forces is also related to the structural response and it is simply a function of building height and period in the codes, which is unrealistic regarding complex inelastic and nonlinear behavior. Thus, a rational lateral forces pattern is then proposed in the PBPD method by relative distribution of ultimate story shears according to inelastic dynamic response results [6]. Detailing of structural members is then performed by traditional plastic design consistent with the initial designated yield mechanism.
The energy balance concept which is used to determine the design base shear is derived herein, since this equation can be further applied for evaluation and prediction purposes. More comprehensive discussion of the PBPD methodology can be found elsewhere [7].
Fig. 1Balance of input and absorbed energy by a given structure
a)
b)
3. Determination of design base shear
As mentioned earlier, the energy balance concept is used to determine the design base shear for certain hazard levels. It can be derived by equating the work necessary to push the structure to the target roof drift with the energy needed in a structure of an equivalent SDOF system to achieve the same state. Assuming a perfectly elastic-plastic (EPP) force displacement response of the oscillation system, this equation can be expressed as:
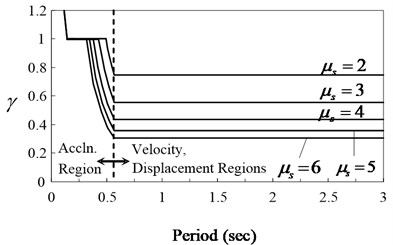
where Ee is the elastic component and Ep is the plastic component of the energy (work) needed to push the structure up to the target drift. Sv is the spectral velocity obtained from the elastic response spectrum; Sa is the pseudo spectral acceleration; T is the structure natural period; and M is the structure total seismic mass. In the PBPD method, the input energy is equal to a coefficient of the equation proposed by Housner [4], called the energy modification factor, γ. γ is the function of the structural ductility factor (μs) and the ductility reduction factor (Rμ). γ can be calculated as following:
As shown in Fig. 2, the spectra for EP-SDOF suggested by Newmark and Hall [8] is adapted to relate Rμ and μs thanks to its simplicity. Thus, γ can be calculated from Eq. (2) are shown in Fig. 3 [9]. It is noted that any inelastic spectra for EP-SDOF can be adapted as preferred [10].
Fig. 2Idealized inelastic spectra by Newmark and Hall for EP-SDOF [7]
![Idealized inelastic spectra by Newmark and Hall for EP-SDOF [7]](https://static-01.extrica.com/articles/19235/19235-img3.jpg)
Fig. 3Energy modification factor, γ, versus period
The work energy equation can be further organized as the following:
or:
By solving the Eq. (4) for Vy/W, the design base shear force in the PBPD method can be obtained as below:
where α is a dimensionless parameter given by:
where θp is the design plastic drift ratio, and h*=∑Ni=1(λihi). As mentioned, the energy balance concept was applied to derive Eq. (5) for Vy. All the spectrum used in the above procedure is based on an ideal EPP force deformation response, which usually presents full hysteretic loops without pinching under cyclic loading, of the system.
Unlike steel moment frames, hysteretic behaviors of reinforced concrete structures are characterized as pinched due to their complex and degrading mechanical behaviors under high deformation demands. Basically, the same procedure of PBPD method can be applied to design of RC moment frame structures. However, two modifications need to be considered for determination of design base shear to account for pinched hysteretic behavior and P-Delta effect.
RC structures presents strength and stiffness degrading hysteretic behaviors and it may result larger peak displacement compared to those with full hysteretic loops. In SDOF systems, it is found that the peak displacement with degrading hysteretic behavior is larger in the short period range and about equal for longer periods. C2 factor in FEMA 440 [1] (Fig. 4) is adapted in this study to represent effect of stiffness degradation and strength deterioration of RC structures. Therefore, the target design roof drift for a given structural system with pinched hysteretic loop can be divided by the C2 factor that would give design target drift for an equivalent non-pinched system. This modified target drift ratio is then used to calculate the design base shear.
Fig. 4Mean displacement ratio of SSD to EPP models (C2) calculated with 240 ground motions recorded [1]
![Mean displacement ratio of SSD to EPP models (C2) calculated with 240 ground motions recorded [1]](https://static-01.extrica.com/articles/19235/19235-img5.jpg)
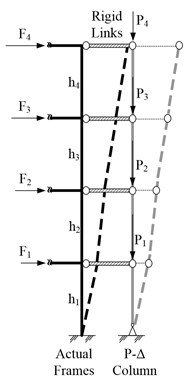
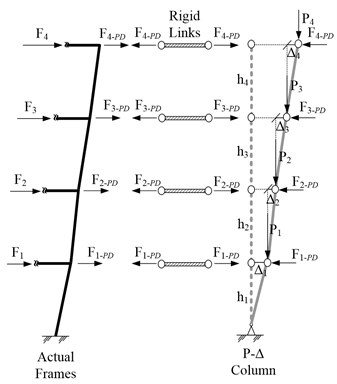
Due to stiffness degradation and strength deterioration at plastic hinges and high dead load in RC members, it is essential to include P-Delta effect to calculate required moment capacity of beams for the RC moment frames for plastic design. P-Delta effect should be considered in the determination of required moment capacity of beams, particularly for high-rise buildings. By implementation a P-Delta column connected to the main structure with rigid links, effects of overturning moments caused by gravity loads can be well described. Thus, “P-Delta lateral force”, Fi-PD, induced by P-Delta effect shall be added to the original design force, Fi (Fig. 5). The force Fi-PD can be simply calculated as Piθu, where Pi is the tributary gravity load at floor level i and θu is the target design roof drift ratio.
Fig. 5Additional lateral forces Fi-PD due to P-Delta effect
a)
b)
4. Seismic evaluation and collapse prediction
In the PBPD method, the work energy Eq. (1) can not only be used to determine the design base shear, but its energy balance concept can be also applied for seismic evaluation and collapse prediction purposes. For a given structure with its force displacement curve obtained from pushover analysis, its peak displacement and CMR for a specific seismic hazard can be easily predicted [11].
The Eq. (1) can be separated into two parts; the right hand side, Ed, can be seen as energy demand and the left hand side, Ec, represents the energy capacity of the given structure. Ed and Ec vary with roof displacement. By analytically solving the work energy equation, the desired peak roof displacement can be obtained. This peak roof displacement can be even graphing by establish Ed and Ec curves as a function of the roof displacement and resolving the intersection point of these two curves [12].
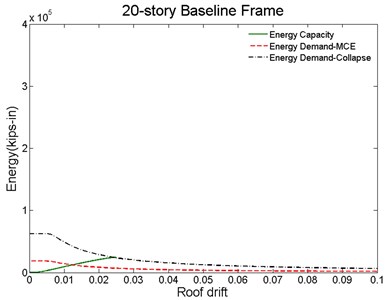
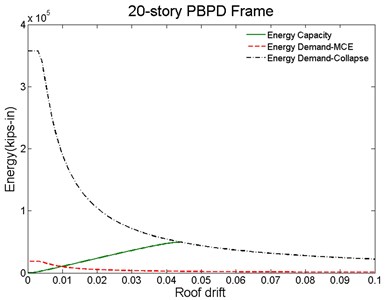
Similarly, this energy concept can be used for collapse prediction by scaling the value of Sa to correspond to collapse limit, Sa-collapse. The maximum roof displacement of Ec is employed into Eq. (1) to analytically solve the corresponding Sa, which represents the collapse limit. The graphing method is also applicable by scaling Ed to have the intersection at the end point of Ec at the maximum roof displacement [13].
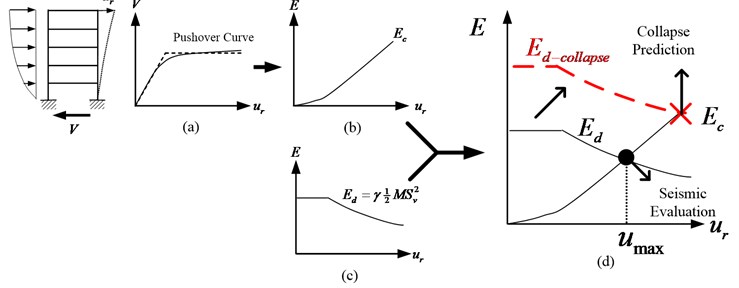
A graphical illustration of this energy based evaluation and prediction procedure is shown in Fig. 6. The curve of base shear versus roof displacement can be constructed by nonlinear static pushover analysis shown in Fig. 6(a), where V represents the total force (base shear), and urthe roof displacement, used as reference displacement. It is worth mentioning that the roof displacement can be substituted by any other floor which its force and displacement can be obtained. The energy capacity curve of a given structure, Ec versus ur, (Fig. 6(b)) can then be constructed by accumulating the work done by lateral forces. Thereafter, the energy demand curve, Ed, can be converted as a function of ur as well by the right hand side of Eq. (1) as plotted in Fig. 6(c). By overlaying Ec and Ed, the intersection of these two energy curves, where the capacity and demand are equal, presents the expected maximum roof displacement under this certain seismic hazard level, Fig. 6(d). This procedure can be considered as a simple and direct method for seismic evaluation. Moreover, Ed can be scaled up to have the intersection at the end point of Ec, where gives the maximum roof displacement at collapse limit. The Sa correspond to the scaled Ed is considered as Sa-collapse in Fig. 6(d). Finally, CMR is then calculated by dividing Sa-collapse by Sa-MCE.
Fig. 6Seismic evaluation and collapse prediction based on energy balance concept for MDOF systems: a) pushover curve, b) energy capacity plot, c) energy demand plot, and d) overlay Ed and Ec for displacement demand and Sa-collapse
In order to apply this evaluation and prediction procedures to RC structures, certain modification is required owing to their stiffness degradation and strength deterioration in hysteretic responses. As mentioned in the previous section, this concern is taken care of with the same manner by C2 factor method to modify the demand curve, Ed. The design target drift for an equivalent non-pinched system is adjusted in Eq. (2) with C2. Ed can be re-written as below:
5. Example: 20-story RC special moment frame
Two 20-story RC special moment frames are presented to verify the proposed seismic evaluation and collapse prediction. One is the code compliant frame adapted from ATC 63 Project [14] as the archetype benchmark frame. The other frame was redesigned by the modified PBPD method by considering pinched hysteretic behavior and P-Delta effect with the same conditions. These two RC frames consist of three bays with interior and exterior columns to characterize features related to seismic responses and collapse performances. The design details, including member sizes, reinforcement ratios, and reinforcement layouts, can be found elsewhere [15-17]. Both frames were subjected to inelastic nonlinear pushover and time-history analyses. A set of ground motion record set from PEER-NGA was selected to perform analyses. All the analyses were conducted with PERFORM 3D.
Fig. 7 shows the force-displacement curves obtained by static pushover analysis of the two RC frames. It can be observed that the pushover response of PBPD frame tends much ductile than that of baseline frame. The roof drifts of PBPD frame either at the maximum base shear or collapse limit are twice higher those of baseline frame.
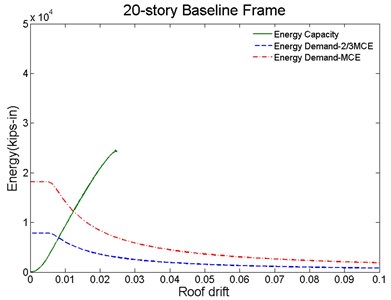
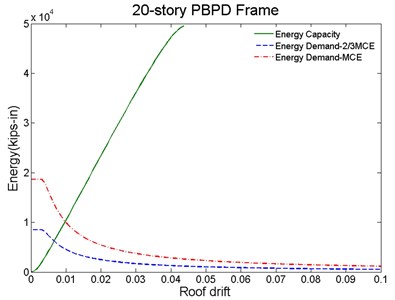
For seismic evaluation, the energy capacity and demand curves of the baseline and PBPD frames are generated as shown in Fig. 8. The capacity curves (green line) was obtained by numerically integrating the lateral load and deflection values at the floor levels. The demand curve was obtained by Eq. (1) with the structure total seismic mass. In addition, Ed can be established for different hazard levels by selecting different Sa (red dash line: MCE level; blue dash line: 2/3 MCE or DBE level). As described in the previous section, the peak roof drift demands for different hazard levels can be easily determined from the intersection point of the corresponding demand and capacity curves.
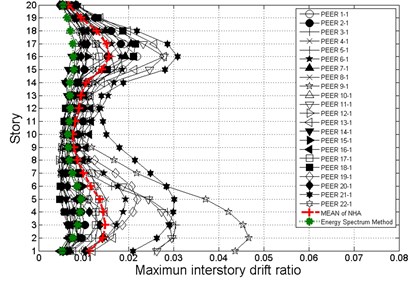
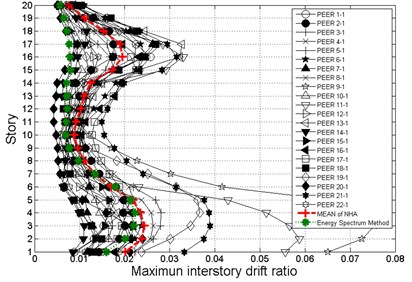
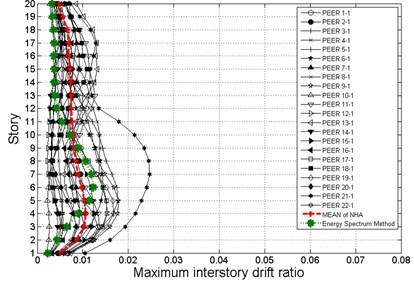
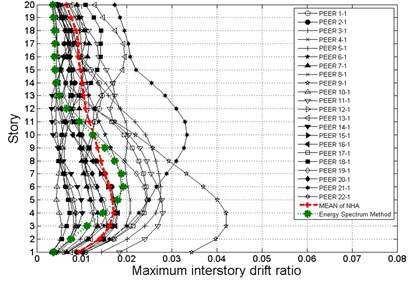
To verify this proposed seismic evaluation procedures, time-history analyses with 22 ground motions records from PEER database were performed for 2/3 MCE (DBE) and MCE hazard levels as shown in Fig. 9. The red lines in Fig. 9 represent the mean of maximum interstory drifts of baseline and PBPD frames and the green lines represent the maximum interstory drifts obtained by the proposed seismic evaluation methods. The comparisons show that this energy balance evaluation method has good agreement with traditional time-history dynamic analyses for the baseline and PBPD frames. It is also worth noting that the evaluation results are better in PBPD frames since the nonlinear responses and yield mechanism are considered in the design and they also respond more desirably.
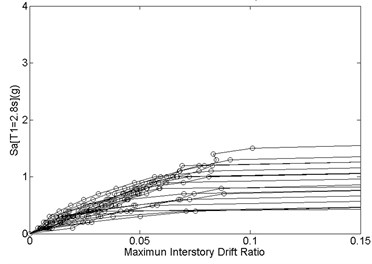
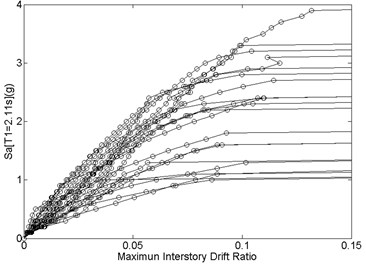
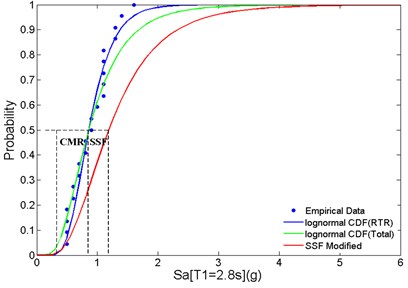
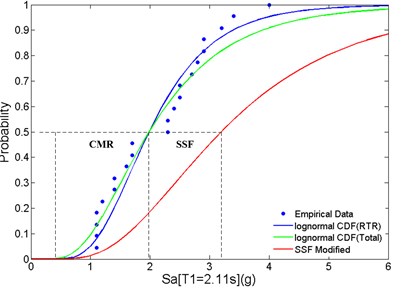
Incremental dynamic analysis (IDA) of these two 20-story RC SMFs are also carried out for collapse prediction (Fig. 10). From the fragility curves (Fig. 11) converted form the IDA results, the SCT can be found at the Sa corresponding to 50 % probability of collapse. Thus, CMR can be calculated by SCT divided by Sa-MCE. In terms of energy balance concept for collapse prediction purpose, demand curves, Ed, in Fig. 12 can be scaled up to have the intersection at the end point of Ec, where gives the maximum roof displacement at collapse limit. The Sa correspond to the scaled Ed is considered as Sa-collapse in Fig. 12. Thus, CMR is then calculated by dividing Sa-collapse by Sa-MCE.
Fig. 7Static pushover curves of baseline and PBPD moment frames
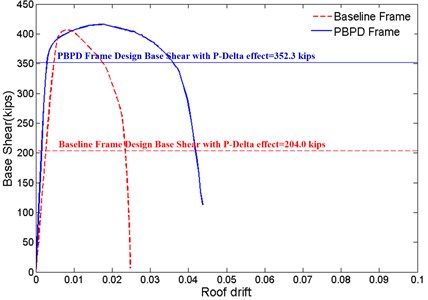
Fig. 8Proposed method for seismic evaluation for: a) baseline, b) PBPD frame
a)
b)
Comparisons of CMR by using proposed prediction procedures and traditional IDA analysis are summarized in Table 1. Calculated values of ACMR suggested in FEMA P695 are also included. The PBPD frames reflect significantly improved margin against collapse over the baseline frames. Even no time-history dynamic analyses involved, CMR and ACMR obtained from the proposed prediction method based on energy balance concept are close with those calculated by IDA analyses.
Fig. 9Comparison of maximum interstory drifts obtained by the proposed evaluation procedure and time-history dynamic analyses for: a) baseline frame for 2/3 MCE (DBE), b) baseline frame for MCE, c) PBPD frame for 2/3 MCE (DBE), d) PBPD frame for MCE hazard level
a)
b)
c)
d)
Fig. 10Incremental dynamic analysis (IDA) for: a) baseline, b) PBPD frame
a)
b)
Table 1CMR and ACMR values by IDA analysis and proposed prediction procedure
IDA Analysis | Proposed prediction procedure | |||
Model | Baseline | PBPD | Baseline | PBPD |
T (s) | 3.36 | |||
T1 (s) | 2.8 | 2.11 | 2.8 | 2.11 |
SC(T1) | 0.86 g | 1.98 g | 0.60 g | 1.88 g |
SM(T1) | 0.32 g | 0.41 g | 0.32 g | 0.41 g |
SSF | 1.38 | 1.61 | 1.38 | 1.61 |
CMR | 2.68 | 4.61 | 1.88 | 4.37 |
ACMR | 3.7 | 7.43 | 2.59 | 7.04 |
Fig. 11Fragility curves of: a) baseline, b) PBPD frame for CMR and SSF
a)
b)
Fig. 12Proposed method for collapse prediction for: a) baseline, b) PBPD frame
6. Conclusions
The equation based on the energy balance concept in the PBPD method can not only be used to calculate the design base shear, but its energy balance concept can be also applied for seismic evaluation and collapse prediction purposes. This energy balance concept provides a direct procedure by simply graphing Ed and Ec curves and overlaying to find out the intersection point of these two curves.
Two 20-story RC moment frames were used to verify the validity of this method. The results show, even without cumbersome and time consuming time-history dynamic analyses with a set of ground motions, this seismic evaluation and collapse prediction method still provides estimations which are quite close to those obtained by traditional methods.
References
-
Improvement of Nonlinear Static Seismic Analysis Procedures. FEMA 440, Federal Emergency Management Agency, Washington, D.C., 2006.
-
Quantification of Building Seismic Performance Factors. FEMA P695, Federal Emergency Management Agency, Washington, D.C., 2009.
-
Vamvatsikosa D., Cornell A. C. Applied incremental dynamic analysis. Earthquake Spectra, Vol. 20, Issue 2, 2004, p. 523-553.
-
Housner G. W. Limit design of structures to resist earthquakes. Proceedings of 1st World Conference on Earthquake Engineering, Vol. 5, 1956, p. 1-13.
-
Goel S. C., Liao W.-C., Bayat M. R., Leelataviwat S. Performance-based plastic design (PBPD) method for earthquake resistant structures: an overview. Proceedings of Structural Engineers Association of California Convention SEAOC, San Diego, California, 2009.
-
Chao S.-H., Goel S. C., Lee S.-S. A seismic design lateral force distribution based on inelastic state of structures. Earthquake Spectra, Vol. 23, Issue 3, 2007, p. 547-569.
-
Goel S. C., Chao S.-H. Performance-Based Plastic Design: Earthquake Resistant Steel Structures. International Code Council, 2008.
-
Newmark N. M., Hall W. J. Earthquake Spectra and Design. EERI, Berkley, CA., USA, 1982.
-
Lee S.-S., Goel S. C. Performance-Based Design of Steel Moment Frames using Target Drift and Yield Mechanism. Research Report No. UMCEE 01-17, University of Michigan, Ann Arbor, MI, 2001.
-
Miranda E., Bertero V. V. Evaluation of strength reduction factors for earthquake-resistant design. Earthquake Spectra, Vol. 10, Issue 2, 2004, p. 357-379.
-
Leelataviwat S., Saewon W., Goel S. C. An energy based method for seismic evaluation of structures. Proceedings of Structural Engineers Association of California Convention SEAOC, Lake Tahoe, California, 2007, p. 21-31.
-
Goel S. C., Liao W.-C., Bayat M. R., Leelataviwat S. An energy spectrum method for seismic evaluation of structures. ATC and SEI Conference on Improving the Seismic Performance of Existing Buildings and Other Structures, San Francisco, California, United States, 2009.
-
Liao W.-C., Goel S. C. An energy spectrum method for collapse evaluation of RC moment frame structures. 15th World Conference on Earthquake Engineering, Lisbon, Portugal, 2012.
-
Haselton C. B., Deierlein G. G. Assessing Seismic Collapse Safety of Modern Reinforced Concrete Frame Buildings. Report No. 156, Blume Earthquake Engineering Center, Stanford University, 2007.
-
Liao W.-C., Goel S. C. Performance-based plastic design and energy-based evaluation of seismic resistant RC moment frame. Journal of Marine Science and Technology, Vol. 20, Issue 3, 2012, p. 304-310.
-
Liao W.-C., Goel S. C. Performance-Based Plastic Design of Earthquake Resistant Reinforced Concrete Moment Frames. Technical Report No. UMCEE 10-01, University of Michigan, Ann Arbor, MI, 2010.
-
Liao W.-C. Performance-Based Plastic Design of Earthquake Resistant Reinforced Concrete Moment Frames. Ph.D. Dissertation, University of Michigan, Ann Arbor, MI, 2010.

