Abstract
The nozzles of moist-mix shotcrete are the key parts of forming a steady jet flow field and ensuring the uniform mixing of water and other ingredients. In this paper, for optimizing the nozzle of moist-mix shotcrete, both the internal and external field of a variety of spray nozzles were simulated and analyzed by adopting orthogonal test method with Fluent simulation software combined. Then the phase volume fraction and single-phase velocity of the outlet section of flow field inside the nozzles and cloud pictures including single-phase velocity and volume of different sections lengthways in the external flow field of nozzle were obtained. The results demonstrated that the change of different factors and different levels of the same factor affected the shotcreting performance of spray nozzle, but the effect degree is different. Additionally, compared with the traditional nozzle, the rationality of new-type nozzle structure was verified, which provided a basis for the improvement and optimization of the nozzle structure in the future.
1. Introduction
Compared with its counterparts which are dry-mix and wet-mix, the moist-mix shotcrete equipment is not only able to avoid problems like large dust volume, high rebound rates, low efficiency of dry-mix shotcrete equipment, but also capable of preventing serious pulse, segregation and blockage in wet-mix shotcrete equipment [1-3]. It improves the spraying operation stability with low costs and simple operation. In recent years, moist-mix shotcrete machines are productive in reducing dust and rebound; with its affiliated equipment and techniques advanced further, moist concrete will be propagated more widely.
The reasonability of nozzle structure influences the flow characteristics of mixed fluid inside the nozzle, thereby affecting the concrete jet conditions. Thus, the structure design of a nozzle is of both importance and difficulties. In different fields, research on nozzle structure is various, but most of them are adoptable. They can be divided into two categories: one is the utilization of computer technology and simulation software to obtain that shotcreting performance are related to the outlet size, channel length and the shape of nozzle [4, 5] and the outlet uniformity of concrete stream of different nozzle structure also affects shotcreting effects [6]; the other is, on the basis of experiment and theories, to adopt principles of physics and advanced equipment, which includes high speed cameras and imaging measurement systems, to indicate that shotcreting performance linked with transition length, angle of internal channel and the symmetry of nozzle [7-9] and that in the premise of the laws of physics in the spray particle kinematics, predicting the impact velocity of materials while they are leaving nozzles is realized [10]. In recent decades, scholars both in China and abroad have provided a large amount of theoretical basis for structure design of nozzles, but the research on the mixing effect of gas-liquid-solid phases on nozzle is few and study on the relationship between nozzle structure parameters is also lacking. Hence, this paper employed orthogonal test, through simulating the flow field of the nozzle of moist-mix shotcrete, to find the primary and secondary factors of impacting the shotcreting effects. Finally, the optimal level combination of structure parameters of nozzle and the flow mixing rule in nozzle were obtained.
2. Structure and principle
The Fig. 1 shows the actual nozzle structure that is an annular shell applied around water inlet where water goes into the total water inlet of annular shell. In actual work process, the flow distribution of each water inlet is not uniform, which may give rise to the pulse phenomenon and affect shotcreting performance. In order to ensure the numerical simulation smoothly, this simulation ruled out traffic assignment problems by defaulting that each water inlet distributes equally water from total water inlet.
The nozzle is divided into three sections: the mixing section, the contraction section and the material-gathering section. The role of mixing section is to ensure water and other ingredients are initially mixed. The role of contraction section is to press the mixed fluid by a shrinking pipe to realize further mixture of water and other ingredients and at the same time to enhance velocity of the mixed fluid. The role of material-gathering section is to improve the uniformity of distribution in the velocity magnitude and direction of the mixed fluid [11, 12].
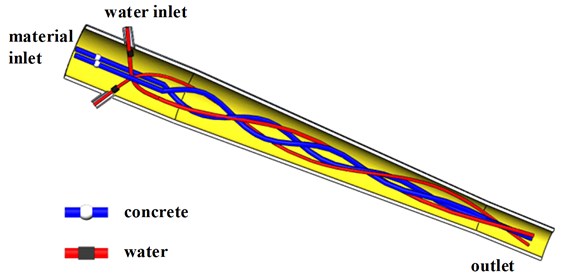
In the actual shotcreting process, concrete is pushed by high pressure air to arrive at the material inlet, then water enters into the nozzle through water inlet to be mixed with concrete, and finally, mixed fluid is sprayed through the outlet [13]. The structure principle is shown in Fig. 2.
Fig. 1The nozzle structure of spraying machine
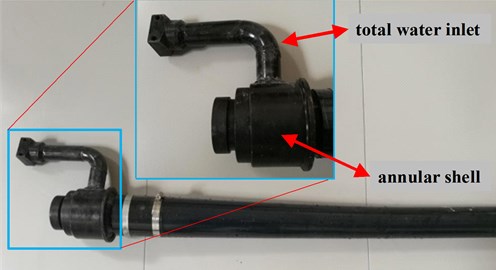
Fig. 2Working principle of nozzle of spraying machine
3. Orthogonal design
Nozzle is the most direct part of shotcreting, and its structure directly affects the shotcreting performance. Therefore, study and analyze on the design of nozzle structure parameters and the relationship between parameters are of significance. According to the investigation and current development status of nozzle [14, 15], and based on the common nozzle research, this paper proposed three important factors as follow:
1) The number of water inlets: this factor determines the inlet diameter and velocity of water. On the basis of satisfying the demand of water cement ratio and the exit velocity, we can obtain the optimal design of the inlet quantity. The number of water inlet levels was set to 3, 6, 9, respectively.
2) The angle of water inlet: the most importance of shotcreting is to make water and concrete can be fully mixed. Different angles influence the mixing efficiency and the velocity of mixed fluid. The angle of water inlet level was set to 30°, 60°, 90°, respectively.
3) The length of mixing zone: water-concrete mixing requires a certain period of time, and this factor is to ensure water and concrete fully mixed and to prevent the phenomenon of spiral and vortex because of the change of internal nozzle angle. The length of mixing zone was set to 50 mm, 75 mm, 100 mm, respectively.
In order to reduce the simulation work repeatability and remain the feasibility of simulation results at the same time, by using orthogonal test methods, according to the three levels of three factors, 9 kinds of nozzles with different structure were designed, the orthogonal test combination is shown in Table 1.
Table 1List of orthogonal experiment parameters
Number | Level combination | A: Quantity of water inlet | B: Angle of water inlet (°) | C: Length of mixing section (mm) |
1 | A1B1C1 | 3 | 30° | 50 |
2 | A1B2C2 | 3 | 60° | 75 |
3 | A1B3C3 | 3 | 90° | 100 |
4 | A2B1C2 | 6 | 30° | 75 |
5 | A2B2C3 | 6 | 60° | 100 |
6 | A2B3C1 | 6 | 90° | 50 |
7 | A3B1C3 | 9 | 30° | 100 |
8 | A3B2C1 | 9 | 60° | 50 |
9 | A3B3C2 | 9 | 90° | 75 |
Table 2Basic parameters of nozzle
Nozzle parameters | Data | ||
Quantity of water inlet | 3 | 6 | 9 |
Length of contraction section (mm) | 270 | 270 | 270 |
Length of gather material section (mm) | 60 | 60 | 60 |
Diameter of material inlet (mm) | 50 | 50 | 50 |
Diameter of water inlet (mm) | 7 | 5 | 3.5 |
Diameter of outlet (mm) | 30 | 30 | 30 |
4. Modeling and simulation of internal flow field
4.1. Geometry and mesh
By using orthogonal test method, 9 kinds of nozzles with different structures were designed. The basic geometric parameters are shown in Table 2.
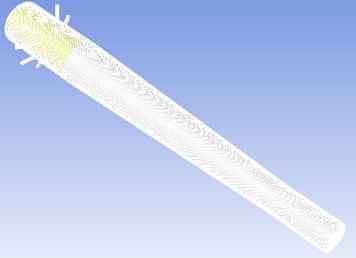
Different structure of nozzles corresponds to different physical models. As the pre-processing software, ICEM CFD was utilized to mesh an established physical model which was generated by structured mesh and then transformed into unstructured mesh. The gird size was set to 2mm. The eighth group of model was set as an example to establish the mesh and the number of mesh is 494717, which is shown in Fig. 3.
4.2. Equations and boundary
4.2.1. Assumption in calculation
The variation of the internal field of nozzle is actually very complicated, but for a simple calculation and analysis, in the case of guaranteeing normal operation, we need to make some assumptions as follow [16-20]:
1) Working medium flow in the form of pseudo fluid inside the nozzle.
2) Mixed fluid actually contains multiphase substances, such as water, air, cement, sand, gravel and so on. In order to simplify the study, water was considered as aqueous phase, the alleged continuous phase; the air was used as the third phase to promote the movement and mixing of the second phase; the residual materials were considered as solid phase.
3) This simulation only took motion conditions of working medium into consideration, without chemical reaction of working medium.
4) The deformation caused by the impact of the working medium on the nozzle wall in the course of flow was not considered.
Fig. 3Mesh generation of physical model of nozzle
4.2.2. Equations and model
CFD is the basic control equation for fluid mechanics by numerical solution algorithm, which includes continuity equation, momentum equation, energy equation and so on [21, 22]. During the numerical simulation, the chemical reaction of concrete with accelerator in flow field, the heat generated by high-pressure air impacting the concrete material groups and the space of nozzle during shotcreting in the numerical simulation were not took into consideration. So, the energy conservation law is a basic law of the movement in the process [23].
Euler model can make concrete as a continuous phase and simplify the processing, which not only can save the computation time and storage space, but also can calculate the relatively complex information and take into account the different turbulence particle of solid phase. Thus, the Euler model was chosen [24-26].
The precision of RNG k-ε model [27, 28] in the calculation of flow field which has a large simulation velocity gradient is higher. The calculation capacity of the RNG k-ε model, which is effective for fully developed turbulence, and better than that of standard k-ε model. The transport equation in RNG k-ε model respectively are:
where, Turbulent kinetic energy generation is:
where Sij is the average strain rate constants, the model coefficient values are as follows:
where, η=sk/β, S=√2SijSji, β=0.015, η0=4.38.
4.2.3. Boundary condition
Aqueous phase entered through the water inlet, while solid phase and air phase entered through the material inlet. And the entering way of three phases was that aqueous phase entered into nozzles as the continuous phase, then entered into the solid phase, and finally entered into the air phase. Three phases entered in sequence, and each phase entered before meeting with the previous step of convergence. The main boundary parameters are shown in Table 3.
Table 3The setting of main parameters
Name | Parameters | |||
3 water inlets | 6 water inlets | 9 water inlets | ||
Water inlet boundary types | Velocity-inlet | Velocity-inlet | Velocity-inlet | |
Velocity-inlet | Velocity-inlet | Velocity-inlet | ||
Velocity-inlet | Velocity-inlet | Velocity-inlet | ||
Outlet boundary types | Outflow | Outflow | Outflow | |
Inlet velocity | Aqueous phase | 20 m/s | 20 m/s | 20 m/s |
Solid phase | 10 m/s | 10 m/s | 10 m/s | |
Air phase | 25 m/s | 25 m/s | 25 m/s | |
Turbulent intensity | Water inlet | 3.1 % | 3.2 % | 3 % |
Material inlet | 5 % | 5 % | 5 % | |
4.3. Simulation result analysis
The purpose of orthogonal experiment is to find the most suitable model, which may not be included in 9 groups of models [29, 30]. Therefore, in order to get the optimal solution of each factor and select the best level, it should be analyzed from the following three aspects:
1) Phase volume fraction of the outlet: the most important thing of judging the degree of mixing of mixed fluid is to analyze distribution of volume fraction of each phase at outlet, since the reasonable volume fraction indicates good mixing effects.
2) Phase velocity of the outlet: velocity parameters of each phase at outlet ensure the shotcreting distance of moist-mix shotcrete, which is the key to success. And only in the effective range of speed can the nozzle of moist-mix shotcrete achieve ideal shotcreting performance.
3) Dynamic pressure field: mixing fluid is pressed by shrinking pipe in the contraction section of nozzle, which promotes the mixing of water and concrete. At the same time as speed increases, the impact pressure at the corner of contraction section and gather material section has also increased, and the degree of wear of nozzle is also intensified. These are key points that should be considered.
4.3.1. Analysis of volume fraction
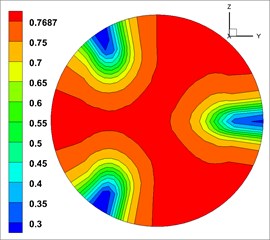
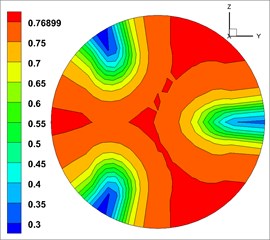
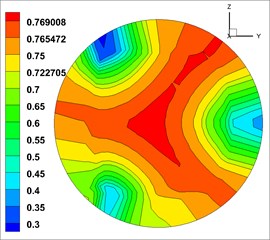
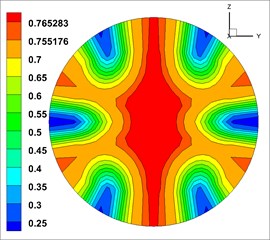
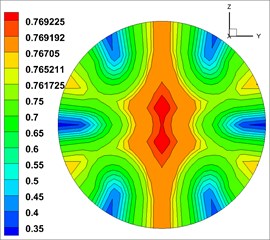
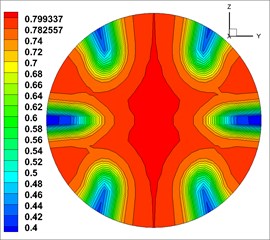
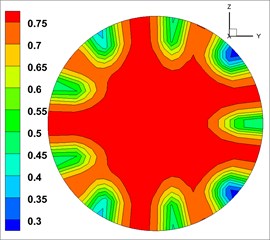
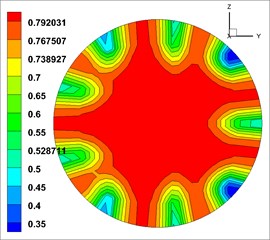
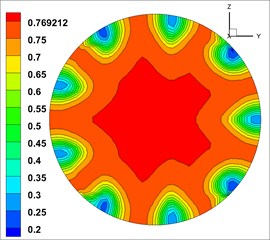
The volume fraction of concrete (solid phase) in three phases was highest at the outlet, and the distribution law of each phase was similar [23].Therefore, the volume fraction of solid phase was took as the object of analysis. And the cloud map of volume fraction of solid phase at the outlets of the 9 groups of models is shown in Fig. 4 (The unit of volume fraction is %).
Fig. 4Solid phase volume fraction at the outlet
a)
b)
c)
d)
e)
f)
g)
h)
i)
The cloud map of volume fraction is close to annular distribution. The concrete (solid phase) concentrates in the central area of the outlet, and then gradually decreases outwards. This indicates that the fluid mix were mixed well at the outlet.
By directly observing Fig. 4, we could not accurately analyze the influence degree of each factor and each level for mixed fluid, so we will not be able to judge the quality of each level. The closer the cloud map of volume fraction is to the annular distribution, the more uniform the mixing of each phase of the outlet will be. Thus, quantifying the volume fraction was necessary. By using variance analysis method [31], 10 points with an average interval at outlet were set to calculate the variance further. The variance of the first group of solid volume fraction analysis is shown in Fig. 5 (The unit of volume fraction is %).
From Fig. 5, we can obtain solid phase volume fraction of the 10 points, which are 0.75, 0.8, 0.75, 0.75, 0.8, 0.75, 0.2, 0.75, 0.75 and 0.3. According to the formula of variance:
M=x1+x2+x3+⋅⋅⋅+xnn,
where, “n” stands for the group of data and “x1, x2, x3,…, xn” stands for specific values of this data.
Fig. 5Analysis of variance of solid phase volume fraction at the outlet
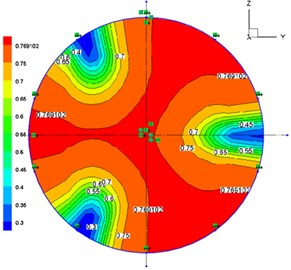
After being calculated, the first group’s variance of solid phase volume fraction is 0.0429 at the outlet. In the same way, the corresponding variance of other groups was calculated, which is shown in Table 4.
The variance of volume fraction of three levels under three factors is shown in Fig. 6. The smaller the variance of volume fraction is, the more uniform mixing of material will be. Therefore, the optimal combination of structure parameters by analyzing solid phase volume fraction at the outlet is as follows: the number of water inlets is 9, and the angle of water inlets is 60°, and the length of the mixing zone is 50 mm.
Table 4Variance of solid phase volume fraction at the outlet
Number | 1 | 2 | 3 | 4 | 5 | 6 | 7 | 8 | 9 |
Variance of solid phase volume fraction | 0.0429 | 0.0452 | 0.0481 | 0.0401 | 0.0375 | 0.0393 | 0.0226 | 0.0231 | 0.0253 |
Fig. 6Broken line graph of the influence of factors on solid phase volume fraction

4.3.2. Analysis of velocity
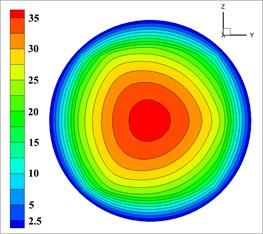
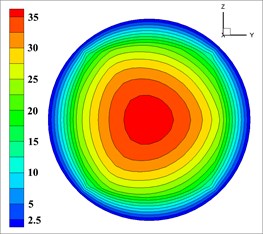
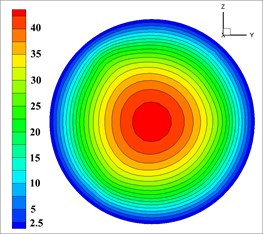
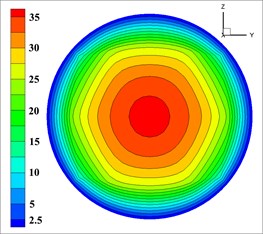
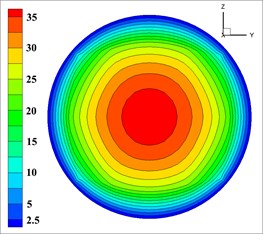
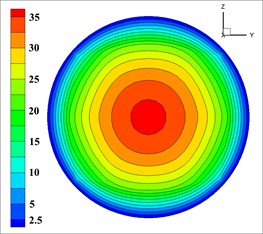
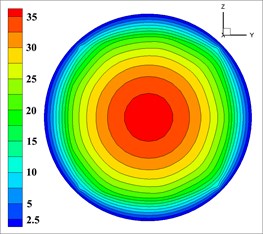
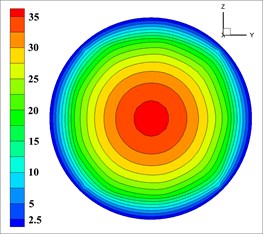
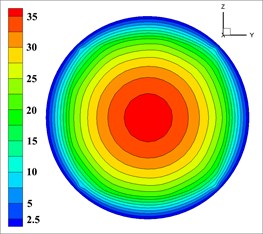
The velocity distribution of concrete has an effect on efficiency and spray uniformity, so the outlet velocity of concrete is vital to shotcreting performance of moist-mix shotcrete. In order to obtain more accurate data, according to the percentage of the effective velocity of the mixed fluid at the outlet [32, 33], the optimal combination of level under each factor of nozzle structure parameters were selected. Solid phase outlet velocity of each group is shown in Fig. 7 (The unit of velocity is m/s).
Solid phase velocity is distributed in an annular at the outlet, and it decreases from the center to the pipe wall while its gradient increases, which is shown in each simulation in Fig. 7. The velocity of the concrete in the wall is close to 0 due to that this distribution may easily reduce the friction between concrete and pipe wall for reducing energy loss and ensuring the export rate. According to the requirements [32, 33], the effective range of mixed fluid velocity at outlet is 40-80 m/s, and the percentage of outlet valid velocity of 9 groups of nozzles is shown in Table 5.
Fig. 7The velocity of solid phase at outlet
a)
b)
c)
d)
e)
f)
g)
h)
i)
Table 5The influence of diverse factors on the velocity at outlet
Number | 1 | 2 | 3 | 4 | 5 | 6 | 7 | 8 | 9 |
Percentage of outlet valid velocity (%) | 69.4 | 72.1 | 70.8 | 73.4 | 75.3 | 71.7 | 70.3 | 68.4 | 72.8 |
The greater the percentage of the effective velocity area of solid phase to the section area at the outlet is, the higher the shotcreting efficiency will be. According to Fig. 8, the optimal combination of structure parameters by analyzing solid phase valid velocity at outlet is as follows: the number of water inlets is 6, and the angle of water inlets is 60°, and the length of mixing zone is 70 mm.
Fig. 8Broken line graph of the influence of factors on velocity

4.3.3. Analysis of dynamic pressure
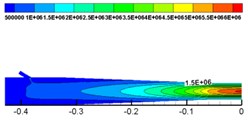
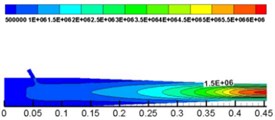
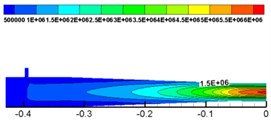
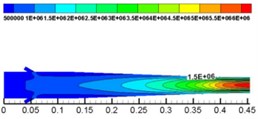
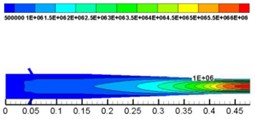
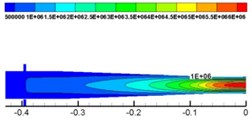
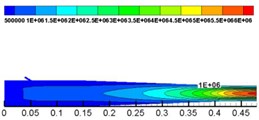
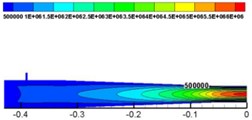
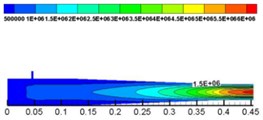
With solid dynamic pressure as the analysis object, by using dynamic pressure (the unit of dynamic pressure is MPa) size at the corner to evaluate degree of wear of the nozzle, we finally selected a reasonable level of factors, which is shown in Fig. 9.
From Fig. 9, it is demonstrated that dynamic pressure is increasing from the inlet to the outlet. The lowest pressure is in the inlet, and at the outlet the pressure reaches the maximum value. When flowing through the contraction section, mixed fluid was squeezed because of the shrinking area of the cross section. Though it can promote the mixing of water and concrete, the degree of pipe wall wearing increased.
Fig. 9Dynamic pressure of solid phase at Z= 0 cross section
a)
b)
c)
d)
e)
f)
g)
h)
i)
Table 6The influence of factors on dynamic pressure
Number | 1 | 2 | 3 | 4 | 5 | 6 | 7 | 8 | 9 |
Corner dynamic pressure (MPa) | 1.5 | 1.5 | 1.5 | 1.5 | 1.0 | 1.0 | 1.0 | 0.5 | 1.5 |
The lower the dynamic pressure of solid phase at the corner is, the lower the impact pressure on the internal wall of the nozzle and the lower the effect on the shotcreting performance of nozzle will be. According to Table 6 and Fig.9, the optimal combination of structure parameters by analyzing solid phase dynamic pressure at the corner is as follows: the number of water inlets is 9, the angle of water inlets is 60° and the length of the mixing zone is 50 mm.
According to Fig. 6, 8, 10 and the range [34], we can draw the importance sequence of the three factors affecting the shotcreting outcomes of nozzles. The factor of the number of water inlets was dominant, and the possible reason was that in the premise of the same amount of water of each simulation, the velocity which water entered into nozzles was different since the number of water inlets and hydraulic diameter was different. In the course of transmission pipeline, air was the main driving force. However, the mixing process of concrete and water was complex after concrete entered into the nozzle, and water was likely to play a role in not only promoting concrete to move forward, but also promoting the mixing concrete and water. The two factors of the angle of water inlet and the length of the mixing zone were behind in parallel. Three factors, each of which was the key, must be considered and can affect the result of shotcreting more or less.
Fig. 10Broken line graph of the influence of factors on dynamic pressure

Through the comparison for different indicators of each factor and each level, we selected two kinds of optimization models: (1) the number of water inlets is 9, the angle of water inlets is 60° and the length of the mixing zone is 50 mm; (2) the number of water inlets is 6, the angle of water inlets is 60° and the length of the mixing zone is 75 mm.
5. Modeling and simulation of external flow field
Through analysis of internal flow field in nozzle, two kinds of optimization models were obtained. Then the external flow field of the two models was simulated and analyzed, which was to simulate the shotcreting characteristics of the solid phase when leaving the outlet.
5.1. Geometry and mesh
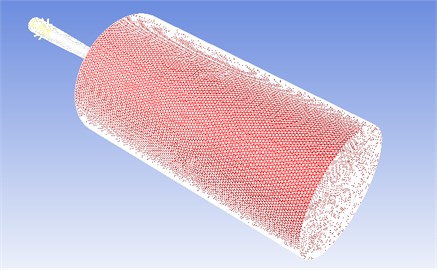
Fluent was utilized to simulate the external flow field of the nozzle. In order to ensure the flow characteristics of external flow field of solid phase afterspraying can be observed as much as possible, the calculation area of the external flow field of nozzle is designed relatively large. A cylindrical model with a length of 1000 mm and a diameter of 400 mm was established outside the nozzle.
In the form of directly-generated unstructured grids, the grid size was different in different regions, but all of them were Tetra/Mixed. The first group of model was set as an example to generate grids, which is shown in Fig. 11, and the number of meshes is 1894125.
5.2. Analysis of simulation results
In addition to transforming the external boundary into the pressure outlet, the other boundary conditions were consistent with the internal flow field in the nozzle.
In order to select the best model structure from the two models, firstly, the nozzle external flow field velocity of longitudinal field was analyzed in different cross sections to find the optimal range of jet conditions [23, 35]; secondly, the solid phase volume fraction of different cross sections inside optimal range of the first and second models was analyzed to get the best nozzle structure model.
Fig. 11Mesh generation of physical model of the nozzle
5.2.1. Optimum shotcreting range
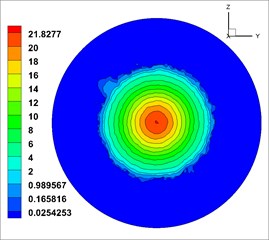
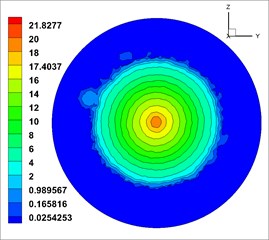
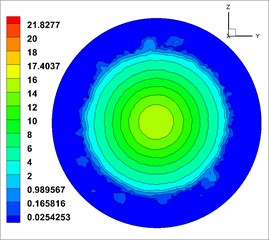
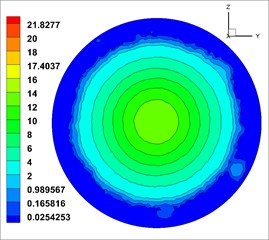
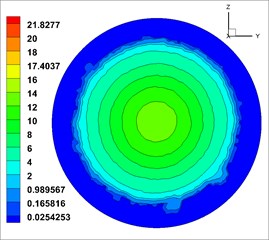
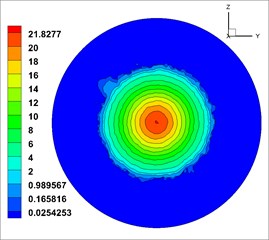
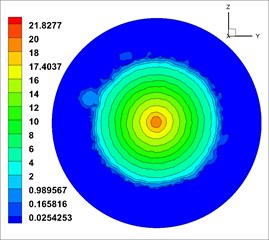
From Fig. 12, the velocity (the unit of velocity is m/s) change of solid phase after leaving the nozzle is as follows: the solid phase diffuses with a certain diffusion angle, and the diffusion begins at the surface and gradually develops toward the center. The velocity gradually decreases along the axis. The velocity distribution in different cross sections [23, 36] (X= 0.6 m, 0.7 m, 0.8 m, 0.9 m and 1.0 m, respectively, representing the distance from the outlet 0.6 m, 0.7 m, 0.8 m, 0.9 m, 1.0 m at the flow field cross section) was observed, which is shown in Fig. 13.
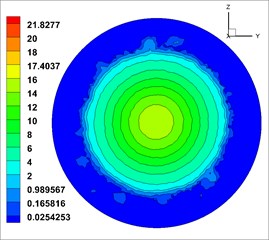
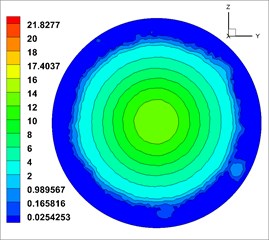
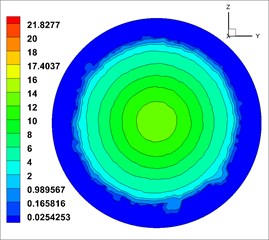
From Fig. 13, solid phase velocity distribution in cross sections is annular, and the shotcreting effects are stable. But in the cross section near the nozzle distance (X= 0.5 m), the velocity gradient is large, which may cause the increase of rebound in sprayed surface. With the increase of the shotcreting distance, the area gradually expands, but it is still a regular circular. The velocity gradient is gradually reduced, indicating that the shotcreting condition is optimal in the range of 0.9-1.0 m.
Fig. 12Solid phase velocity of Z= 0 cross section
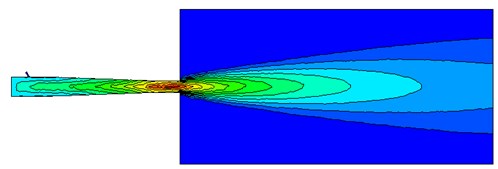
In Fig. 14, similarly, the shotcreting condition in the range of 0.9-1.0 m for second kinds of nozzle is most ideal. Therefore, based on the comparison of two kinds of nozzles, the optimal shotcreting distance of nozzle can be also obtained.
5.2.2. Analysis of solid phase volume fraction
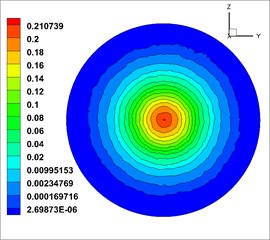
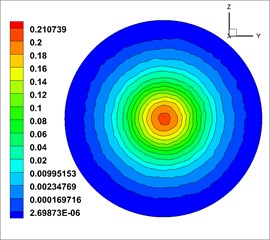
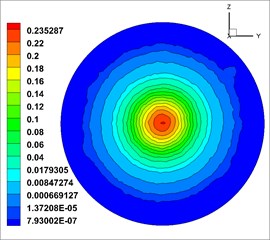
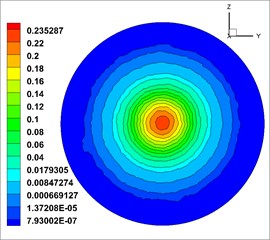
Through the analysis of the shotcreting distance of two kinds of nozzles, the optimal shotcreting distance was obtained. Next, two cross sections in X=0.9 m and X=1.0 m respectively were taken and the solid phase volume fraction of cross sections (the unit of velocity is m/s) was analyzed, which is shown in Fig. 15.
Fig. 13Solid phase velocity in different cross sections
a)X=0.6 m
b)X=0.7 m
c)X=0.8 m
d)X=0.9 m
e)X=1.0 m
Fig. 14Solid phase velocity in different cross sections
a)X=0.6 m
b)X=0.7 m
c)X=0.8 m
d)X=0.9 m
e)X=1.0 m
In Fig. 15(a) and (b) represent solid volume fraction of the first nozzle, and Fig. 15(c) and (d) represent solid volume fraction of the second nozzle. In the above map, the volume fraction of the solid phase shows a circular distribution, the fluid is evenly mixed, and the best shotcreting effect is achieved at the optimum distance. However, under the initial condition, solid volume fraction of the first moist-mix shotcrete nozzle is relatively small relative to the solid volume fraction of the second. So choose the second moist-mix shotcrete nozzle structure model.
Fig. 15Solid phase volume fraction
a)X=0.9 m
b)X=1.0 m
c)X=0.9 m
d)X=1.0 m
6. Engineering applications
Through orthogonal test and numerical simulation, the best new-type nozzle was acquired, but also it still needed to be tested in practice. This engineering experiment was carried out using PTS-7 push-chain concrete spraying machine and MJDY-250T coal mine concrete mixer during the early excavation process of No. 630 track roadway in Tangkou Coal Mine of Zibo Mining Group. The experiment was based on moist technology comparison of new and ordinary nozzles and included dust concentration measurement and rebound rate measurement.
6.1. Sprayed material
The pre-packaged concrete mixtures that are employed in moist-mix shotcrete application were used in the study. This mixtures contain fine and coarse aggregates, ordinary Portland cement and silica fume. Mix designs are detailed in Table 7.
The difference between moist-mix shotcrete and dry-mix shotcrete is that the mixing of cement and aggregate is not dry mixing. Instead, the water cement ratio is 0.3.
Table 7Mix design of the pre-packaged mixtures used in moist-mix shotcrete
Ingredients | Moist-mix |
Ordinary Portland cement (kg/m3) | 386 |
Silica fume (kg/m3) | 36 |
Gravel – 2.5-10 mm (kg/m3) | 612 |
Sand – 0.08-5 mm (kg/m3) | 1206 |
6.2. Measurement and analysis of dust concentration
Membrane weighing method was adopted in dust concentration measurement experiment. Thedust sampling was carried out after shotcrete work was stable, and a total of five representative sites were selected, and each site was sampled three times to acquire the average value. The sampling time was 3 minutes, and the sampling process is shown in Fig. 16.
The sampling point arrangement point is shown as Table 8.
The dust concentration generated by the two spray technology is shown as Table 9.
From the in-situ dust concentration measurement results, the highest dust concentration point with the new nozzle is located at Point 1, which is the very area where the sprayer is located. As is evident from Table 9, whether it is total dust concentration or respirable dust concentration, compared with the ordinary nozzle moist spray technology, the environment of the entire concrete supporting work area has been improved.
Fig. 16The sampling process

Table 8Dust concentration determination of measuring-point arrangement
Number | Place | Location (from the bottom of 1.5 m) |
1 | Near spraying man | From the spraying man about 1 m |
2 | Spray operation area | Middle of roadway, middle of spraying man and machine |
3 | Mixed feeding area | From mixer about 1 m |
4 | Behind mixer | Behind mixer about 20 m |
5 | Behind shotcrete area | Middle of roadway, 40 m from leeward |
Table 9Statistics of dust concentration
Name | Dust concentration (mg/m3) | Point 1 | Point 2 | Point 3 | Point 4 | Point 5 | Average dust concentration |
New-type nozzle | Total dust concentration | 32.6 | 27.6 | 32.5 | 25.9 | 23.6 | 28.4 |
Respirable dust concentration | 11.2 | 8.9 | 10.9 | 9.1 | 8.1 | 9.64 | |
Ordinary nozzle | Total dust concentration | 53.6 | 47.2 | 52.1 | 47.5 | 44.6 | 49 |
Respirable dust concentration | 18.6 | 15.7 | 16.8 | 15.9 | 15.1 | 16.42 |
6.3. Measurement and analysis of rebound rate
When the rebound rate was measured in the track contact lane, three sites including Stalk, Shoulder arc and Flattop were set to be tested, and each location was tested three times to obtain the average value. The results are shown in Table 10.
Table 10In-situ rebound rate test
Name | Rebound degree (%) | |||
Stalk | Two shoulders arc | Flattop | Average rate of rebound | |
New-type nozzle | 7.1 | 9.6 | 12.4 | 9.7 |
Ordinary nozzle | 14.9 | 17.1 | 17.8 | 16.6 |
The sequence of the order position rebound rate is flattop > shoulder arc > stalk, the main reason is the gravity. From comparison, the average rebound rate of new nozzle is around 10 % while the average rebound rate of ordinary nozzle is around 10 %. For one thing, a much high value of rebound rate can result in waste of raw materials and decrease productivity; For another thing, it is also the source of dust of the roadway construction, which increases the concentration of dust in the roadway and also threatens the health of workers.
In summary, according to experimental results and related experience, comparison and summary were made on the in-situ working outcomes of ordinary moist spray concrete nozzles and the new-type nozzles. From the results of dust concentration and rebound rate measurement, the spray effect of the new-type nozzles was obviously better than that of ordinary nozzle. Therefore, the reform of the equipment of the moist and preferably injection parameters can effectively reduce mine dust concentration, reduce rebound rate, improve the support strength and promote the moist spray technology widespread in the field of mines.
7. Conclusions
1) Through analogue simulation, the phase volume fraction and single-phase velocity of the outlet section of flow field inside the nozzles and cloud pictures including single-phase velocity of different sections lengthways in the external flow field of nozzle were obtained. Consequently, annular distribution regularities of phase outlet velocity and phase volume fraction of internal flow field were acquired, and the optimal range (0.9-1.0 m) of jet conditions were proved as well.
2) By implementing orthogonal experiment analysis of spray parameters based on three factors and three levels and then employing numerical simulation on the spray flow field of nozzle, the law that the key factor impacting spraying performance is the number of inlets was obtained. Simultaneously, another law that the optimal level combination of each factor of spray-head structure parameters is installing 6 inlets, making the angle of inlets 60° and the length of mixing zone 75 mm, respectively, was acquired as well.
3) The in-situ outcomes of ordinary nozzles and new-type nozzles bore out that the latter ones can effectively decrease the concentration of mine dust and reduce rebound rates. This paper, which selected three structure parameters from the actual work parameters to implement simulation, didn’t include the structure parameter range exhaustively. Thus, the full-scale simulation of spray-head structure parameters is of great importance in further research.
References
-
Abou Zeid Mohamed, Elrasheid Elkhidir Influence of key parameters on quality of dry-mix shotcrete. Transportation Research Record: Journal of the Transportation Research Board, Vol. 1798, 2002, p. 51-55.
-
Bolduc L. S., Jolin M., Bissonnette B. Evaluating the service life of shotcrete. Shotcrete Elements of A System, 2010, p. 57-64.
-
Burns Dennis Characterization of Wet-Mix Shotcrete for Small Line Pumping. Université Laval, 2008.
-
Guo Shaofeng, Qianhong Zhou, Wenkang Guo, Ping Xu Computational analysis of a double nozzle structure plasma cutting torch. Plasma Chemistry and Plasma Processing, Vol. 30, Issue 1, 2010, p. 121-140.
-
Liu Zunping, Kyoung Su Im, Yuejie Wang, Kamel Fezzaa, Xing Bin Xie, Ming Chia Lai, Jin Wang Near-nozzle structure of diesel sprays affected by internal geometry of injector nozzle: visualized by single-shot x-ray imaging. SAE Technical Paper, 2010.
-
Hu Shi Cheng, Liu Cao, Wang Xiang Jun, Gong Jun, Gao Yun Simulation analysis of flow field on the nozzle of concrete spraying machine. Journal of Chang’an University, Natural Science Edition, Vol. 2, 2015, p. 145-151.
-
Liu Jing, Yit Fatt Yap, Nam Trung Nguyen Behavior of microdroplets in diffuser/nozzle structures. Microfluidics and Nanofluidics, Vol. 6, Issue 6, 2009, p. 835-846.
-
Park Junha, Seok Chung, Hoyoung Yun, Keunchang Cho, Chanil Chung, Dong Chul Han, Jun Keun Chang Asymmetric nozzle structure for particles converging into a highly confined region. Current Applied Physics, Vol. 6, Issue 6, 2006, p. 992-995.
-
Vasil'ev O. A., Minin S. N., Shipovskikh A. V. Investigation of the flow structure in nozzles with a throat section of constant height. Fluid Dynamics, Vol. 25, Issue 6, 1990, p. 944-949.
-
Ginouse Nicolas, Jolin Marc Experimental and numerical investigation of particle kinematics in shotcrete. Journal of Materials in Civil Engineering, Vol. 26, Issue 11, 2014, p. 6014023.
-
Wang Jinming, Xie Xushi, Chen Hai, Ye Mouping, Guo Jinji Analysis of the mechanics characteristic in gas-solid-liquid concrete jet nozzle. Machine Development, Vol. 4, 2000, p. 49-51.
-
Yang Daolong, Li Jianping, Zheng Kehong, Liu Xujin, Wang Yanxiang Simulation and experiment of the nozzle’s position in underground venturi wet concrete shooter. Journal of China Coal Society, Vol. 9, 2013, p. 1692-1696.
-
Lin Hu Research and application of wet shotcreting machine in underground mine. Coal Science and Technology, Vol. 7, 2009, p. 002.
-
Han Joong Sub, Pai Hsui Lu, Xing Bin Xie, Ming Chia Lai, Naeim Henein A. Investigation of diesel spray primary break-up and development for different nozzle geometries. SAE Technical Paper, 2002.
-
Lüddeke H., Javier Calvo B., Filimon A. Fluid structure interaction at the ariane-5 nozzle section by advanced turbulence models. European Conference on Computational Fluid Dynamics, 2006.
-
Calamaz Madalina, Coupard Dominique, Girot Franck A New material model for 2d numerical simulation of serrated chip formation when machining titanium alloy Ti-6al-4v. International Journal of Machine Tools and Manufacture, Vol. 48, Issue 3, 2008, p. 275-288.
-
Oshinowo Lanre M., Andre Bakker Cfd modeling of solids suspensions in stirred tanks. Proceedings of the Conference on Computational Modeling of Materials, Minerals and Metals Processing, 2002.
-
Randall Scott W., Markevitch Maxim, Douglas Clowe, Gonzalez Anthony H. Constraints on the self-interaction cross section of dark matter from numerical simulations of the merging galaxy cluster 1E 0657-56. The Astrophysical Journal, Vol. 679, 2008, p. 1173.
-
Wang Zhaoling, Liu Zhengping, Huang Yunyan, Huang Xianbin Wavefield modeling based on the finite element method for the tunnel seismic prediction. Journal of Jilin Univcrsity, Earth Science Edition, Vol. 4, 2014, p. 1369-1381.
-
Wenhui Zhou Numerical and Simulation Research on the High Pressure Water Jet Nozzle in inside and Outside Efflux Flow Field. Lanzhou University of Technology, 2008.
-
Fujun Wang Cfd (Computational Fluid Dynamics) Analysis. Tsinghua University Press, 2004.
-
Wang Ruijin, Zhang Kai, Wang Gang Technical Basis and Application Examples of Fluent. Tsinghua University Press, Peking, 2007.
-
Cao Liu Mixed Fluid Evenness Study of Flow Field of Wet Concrete Spraying Machine Nozzle. Central South University, 2013.
-
Cantero Mariano I., Balachandar S., Marcelo García An H. Eulerian-eulerian model for gravity currents driven by inertial particles. International Journal of Multiphase Flow, Vol. 34, Issue 5, 2008, p. 484-501.
-
Lotfi R., Saboohi Y., Rashidi A. M. Numerical study of forced convective heat transfer of nanofluids: comparison of different approaches. International Communications in Heat and Mass Transfer, Vol. 37, Issue 1, 2010, p. 74-78.
-
Rongguo Hou Study on the Cutting Performance of Abrasive Water Jet and Simulation of the Velocity Field inside and Outside the Nozzle. Shandong University, 2006.
-
Wang Jing Yu, Xing Jun Hu Application of RNG k-ε turbulence model on numerical simulation in vehicle external flow field. Applied Mechanics and Materials, 2012.
-
Zhang Ming Liang, Yong Ming Shen Three-dimensional simulation of meandering river based on 3-D rng κ-ɛ turbulence model. Journal of Hydrodynamics, Vol. 20, Issue 4, 2008, p. 448-455.
-
Liang Renjie Orthogonal test design for optimization of the extraction of polysaccharides from phascolosoma esulenta and evaluation of its immunity activity. Carbohydrate polymers, Vol. 73, Issue 4, 2008, p. 558-563.
-
Wei Likun, Huang Xuxiong, Huang Zhenzheng, Zhou Zhigang Orthogonal test design for optimization of lipid accumulation and lipid property in nannochloropsis oculata for biodiesel production. Bioresource Technology, Vol. 147, 2013, p. 534-538.
-
Lowry Richard Concepts and Applications of Inferential Statistics. 2014.
-
Caffarelli Luis A., Lee K. A., Antoine Mellet Homogenization and flame propagation in periodic excitable media: the asymptotic speed of propagation. Communications on Pure and Applied Mathematics, Vol. 59, Issue 4, 2006, p. 501-525.
-
Soltani Mohsen Nourbakhsh, Knudsen Torben, Svenstrup Mikael, Wisniewski Rafael, Brath Per, Ortega Romeo, Johnson Kathryn Estimation of rotor effective wind speed: a comparison. IEEE Transactions on Control Systems Technology, Vol. 21, Issue 4, 2013, p. 1155-1167.
-
Krištoufek Ladislav Rescaled range analysis and detrended fluctuation analysis: finite sample properties and confidence intervals. AUCO Czech Economic Review, Vol. 4, Issue 3, 2010, p. 315-330.
-
Chen Zhu, Shah Yong, Shen Xi Gang, Zhang Jing Zhou, Shao Wan Ren Numerical study on thrust reverser controlled with secondary flow. Journal of Propulsion Technology, Vol. 9, 2014, p. 1181-1187.
-
Yao Donglai, Gang Zhang, Baowen Li A universal expression of band gap for silicon nanowires of different cross-section geometries. Nano Letters, Vol. 8, Issue 12, 2008, p. 4557-4561.
Cited by
About this article
This work was supported by National Natural Science Foundation of China (Grant Nos. 51404145, 51604163); Natural Science Foundation of China of Shandong Province (Grant Nos. ZR2013EEQ021). The authors declare that they have no conflict of interest.

