Abstract
The numerical simulation and wind tunnel experiment are employed to investigate the aerodynamic characteristics of automobile. The object is to investigate the sensibility of aerodynamic characteristic to the underbody, and summarize the influence of aerodynamic attachments on the aerodynamic drag, which can provide more useful date as a reference to underbody design of automobile. In the wind tunnel experiments, the aerodynamic drag of automobile with simplified flat underbody is measured. The realizable k-ε model is employed to compute the aerodynamic drag. The computational results show a good agreement with the experimental date, which proving the accuracy of the numerical calculation method. Then the numerical calculation model with real underbody structure is established on this basis. Calculation results show that there are many separation vortexes in the automotive underbody and with a great influence on the aerodynamic characteristics, which is the main reason for the formation of aerodynamic drag and make the aerodynamic drag increased by 23.4 %. In order to reduce drag, A kind of wheel spoiler and three kinds of underbody spoiler are designed, and the influence of the key parameters on aerodynamic drag is analyzed, which both had effective influence for reducing aerodynamic drag, and the largest drop of drag coefficient are 4.86 % and 7.05 % with the reasonable structure designs. The results of calculation and analysis can give suggestion for vehicle designing.
1. Introduction
It is undoubted that the improvement of fuel efficiency in ground vehicles is currently, and will continue to be, a significant issue in the auto industry. At present, there are mainly two approaches to improve the fuel economy, one is to improve the combustion process in the engine [1], and the other is to reduce the total drag force on the vehicle in motion [2, 3]. In considering the latter, although the total drag force mainly consists of rolling resistance and aerodynamic drag, with a medium-size car, aerodynamic drag accounts for nearly 80 percent of the total drag force at 100 km/h. Moreover, the aerodynamic force is proportional to the square of the velocity, and the engine power required to overcome the aerodynamic drag is a function of the cube of the velocity. At high speeds, overcoming aerodynamic drag is responsible for more than 50 percent of fuel consumption. There is therefore much scope for improving economy by reducing aerodynamic drag. However, in considering the aerodynamic drag force, a thorough analysis of the airflow around the vehicle, is a prerequisite. The aerodynamic drag in ground vehicle includes form drag, skin friction, interference drag, induced drag and cooling drag. The form drag due to the flow separation around the vehicle body contributes to 50 to 65 percent to the overall aerodynamic drag.
In the past two decades, Computational Fluid Dynamics (CFD) has been used widely in vehicle aerodynamic studies [4-6], Many enterprises and universities are paying more and more attention to the development of automotive aerodynamics. Over this period major advances in CFD codes, computational algorithms, physical models and methods, high performance computing algorithms and supporting computer hardware had led to a widespread acceptance of CFD as a viable tool for aerodynamic development. It was generally accepted that the CFD tools provide sufficient accuracy to support aerodynamic development [7-9]. Yang et al. discussed that shape modification design of automotive underbody impacted on automobile aerodynamics characteristics through installing the sealing cover, spoiler and designing concave, non-smooth surface [10], but only a single spoiler was designed, and the influence of height change on aerodynamic drag was not investigated. Zhang et al., Sebben and Cogotti studied the flow law of complex airflow field of the automotive underbody under the effects of ground and wheel rotation [11-13]. It didn't reflect the complex airflow of underbody because of the simple model without detail underbody structure, and the method of control the airflow of underbody wasn’t analyzed. Huminic et al. and Wordley et al. studied the way to steer the underbody airflow [14, 15], which could make the airflow accelerate and was better for the automobile aerodynamic performance. Malviya et al. proposed a novel fuel-saving device for vehicles, which can be very effective in reducing the fuel consumption [16].
However, most researches confined to reduce drag by body designing and little research has been done about the effect laws of underbody aerodynamics attachments. This paper is mainly focus on the influence of underbody to the aerodynamic drag force, apart from the above, A kind of wheel spoiler and three kinds of underbody spoiler are designed to improve the airflow of underbody. A stronger Venturi effect is obtained through the improvement of the underbody, so that the underbody of the car is not dashed by the high-speed airflow, and the airflow in the car bottom is accelerated, thus reducing the aerodynamic drag of the whole vehicle. The influence of the height of wheel deflector and underbody spoiler to aerodynamic drag variation rules also will be summarized. The results of research can give suggestion for vehicle designing.
2. Numerical simulation
2.1. Control equations
The airflow around Automotive is low-speed aerodynamics, so the airflow field around automobile can be regarded as the three-dimensional in-compressible. The fundamental governing equations for the three-dimensional in-compressible were as follows.
Continuity equation:
Equation of motion:
where ui and uj are Cartesian components of the velocity, xi and xj are the Cartesian coordinates, ρ is static pressure, μeff is effective viscosity coefficient of turbulent flow.
2.2. Turbulence model
Earlier studies have shown that the realizable k-ε turbulent model was ideal in aerodynamic parameters calculation, which was widely used in automobile airflow [17-20]. So, the realizable k-ε turbulent model was studied in this paper. The realizable k-ε turbulence model include the newest turbulence control equation and transfer equation for the dissipation rate which applied to the definitive mathematical constraints of Reynolds stresses as well as the definitive turbulence flow. The transfer equations are as follows.
Turbulence kinetic energy equation:
Turbulence dissipation equation:
where ρ is density, k is turbulence kinetic energy, ε is turbulence dissipation, Pk is the generation caused by the average velocity gradient of turbulent kinetic energy, υis dynamic viscosity, υt is turbulent viscosity, Other parameters can be found in the ref. [21].
2.3. Geometric Model
The geometric models were constructed by UG, and the initial model (named model A) retained the basic shape of the automobile exterior surface, but no underbody structure. Basing on Model A, Model B added the underbody structure (including the floor, frame, exhaust system, fuel tank, and spare tires), wiper, door handles and so on to ensure the numerical results will be closer to the real value of car running, as shown in Fig. 1.
Fig. 1Geometric model
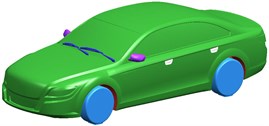
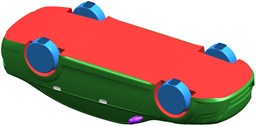
a) Model A
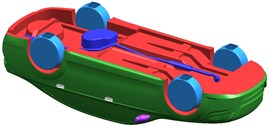
b) Model B
2.4. Computational model
The measurement results are closely related to the blockage ratio of the model. The typically accepted range is 5 %. In this paper, the computational domain was a cuboid around the body with the front of automobile model left three times length, the upper left five times height, the back left seven times length and the both sides left five times width. The blockage ratio is less than 2 %, as shown in Fig. 2. The unstructured meshes were created for the whole computational domain by the Octree method in the pre-processing software ICEM-CFD. Three layers prism elements were generated near the vehicle surface to provide an accurate estimation of the velocity profile near the wall and keep the y+ value within an acceptable range (20-200). It consisted of about six million cells, and local grid refinement was applied near the body surface and in the wake region. Further grid refinement showed little difference in the results reported here. The final mesh number of the model B is about 6 million and the numerical grid of model B is shown in Fig. 2. Considering the squeezing deformation of rolling ties, wheel cylinder was cut off at 20 mm away from the ground, and then the wheel section was stretched height of 20 mm to the ground. The quality of the mesh between the tire and the ground was better and the model coincided with the real situation.
Fig. 2Numerical computational model
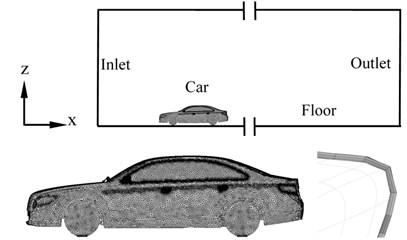
In current research, the fluid flow analysis was based on the commercial CFD code Fluent, which was based on the finite volume method and provided a choice of solvers and settings. The settings chosen for this study were listed in Table 1. Because of the smaller air velocity and the mach number less than 0.3, the automobile airflow field can be considered as in-compressible flow. The second-order upwind scheme was used to calculate and the SIMPLE algorithm was used to solve the equation.
Table 1Boundary conditions
Boundary | Boundary Condition | Value |
Inlet | Constant velocity | Ux=30 m/s |
Outlet | Constant pressure | 0 Pa |
Floor | Moving wall | Ux=30 m/s |
Car | No slip wall | – |
Other wall | Free slip wall | – |
3. Computation validation
To validate the computational results, Wind tunnel test was carried out in the HD-2 wind tunnel of Hunan University wind engineering test center. In current research, a floating-frame strain gauge six-component balance (Fig. 3) was employed to measure the aerodynamic force. In order to ensure the accuracy of the experimental results, the balance was calibrated in ground coordinate system by the manufacturer semiannually. Moreover, before installing the measurement model, a five kilogram weight was loaded on the balance to verify the accuracy of the results, and the whole system was returned zero before sampling.
Fig. 3Wind tunnel test
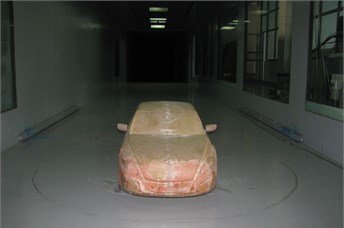
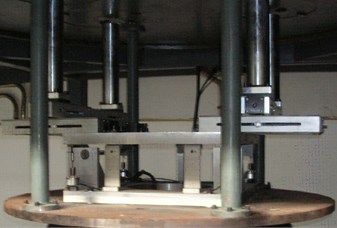
The boundary layer was eliminated by boundary layer pumping system in the wind tunnel experiment and the floor was a moving wall in the simulation. The test vehicle of model A was installed on a six-component balance, as shown in Fig. 3. The data of body zero yaw was collected per 5 m/s with the wind speed range from 5 m/s to 40 m/s. In current experiments, the drag variation was quite small when the wind velocity over 30 m/s, which corresponding to the Reynolds number 5.75×10⁶.
In vehicle aerodynamic, the aerodynamic characteristic was reflected by the aerodynamic force coefficient. This paper was mainly focus on aerodynamic drag, which was defined as:
where FX is the aerodynamic drag, S is the frontal area, v∞ is the incoming flow velocity. ρ denotes the density.
In vehicle aerodynamics, the aerodynamic performance is reflected by aerodynamic drag coefficient. The aerodynamic drag coefficient of model A listed in Table 2 showed that the computational results had a good agreement with the wind tunnel test with the error below 5 %, which proved the accuracy of the numerical calculation. There were two factors for the error. The one was due to the error of numerical calculation, including model consistency, meshing, boundary condition. Another was the error of wind tunnel experiment, including the error in manufacturing, installing and measurement.
Table 2Comparing the numerical result to the test result
Model A | Model B | |||
CD | Test result 0.2705 | Numerical result 0.2586 | Test result – | Numerical result 0.3192 |
4. Numerical results and discussion
The aerodynamic drag coefficient of model B increase by 23.4 % compared with model A, and the underbody structure is the main reason for the increase of aerodynamic drag. In order to find out the influence mechanism of the underbody structure, the air flow around the car is analyzed.
In this section, the results of the airflow around the body surface is presented. Fig. 4 show the airflow streamline of the automobile tail for model B. As shown in Fig. 4, there are two longitudinal vortexes in the opposite direction in the upper of tail. The reason is that the airflow lost attachment through the C pillar and the edge of the rear side, then forming a strong shear flow, which is suctioned by the negative pressure of tail. The vortex not only rotated around its own vortex core, but also is trailed to the tail by the influence of the high speed shear flow in roof. And the vortex core is close to the ground with the increase of the trailing distance. There are also tow longitudinal vortexes in the opposite direction in the lower of tail, which is caused by the influence of the negative pressure zone in the underbody and the wheels. The vortex energy is smaller, overlapped frequently, and absorbed by the trailing vortex in upper of tail. Finally, a pair of large eddies rotating in the opposite direction is formed at a certain distance from the tail.
Fig. 4Trailing vortexes of model B
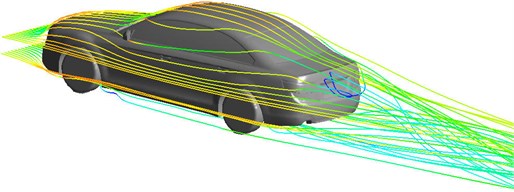
Fig. 5Transverse induced vortexes of model B
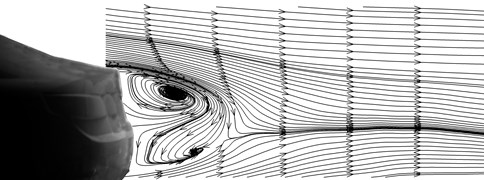
Partial shear flow around the back side, affected by the trailing vortex and the negative pressure zone of tail, is formed a transverse induced vortex, as shown in Fig. 5. There are two opposing vortices, the upper vortex is larger than the lower vortex and the position of the lower vortex is farther away from the vehicle tail. The airflow from underbody flow up and backflow occurred, which can cause soil pollution.
Fig. 6Wall shear stress of model B
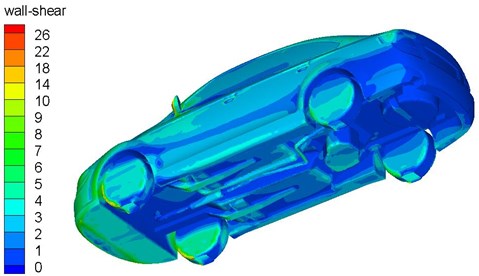
In this section, the results of the wall shear stress calculation on the body surface is presented. Fig. 6 gives the wall shear stress distribution in the body. The stress is very small in the car body, especially in the underbody part. It can be seen clearly that the value of shear stress is close to zero in those parts, such as frame, exhaust system, and spare tires. Separated airflow may be occur in this regions. However, the higher wall shear stress is mainly distributed in the front tires and front panel region. The underbody airflow is blocked due to uneven structure, and separate mostly, there are many turbulent flows at the bottom of the car, which dissipate a large amount of energy, as shown in Fig. 7. The vortex at the bottom of the car not only increases the aerodynamic drag of itself, but also converges to the rear vortex of the car, changing the flow field at the rear of the car and increasing the pressure drag.
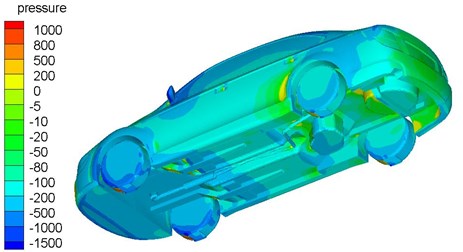
The pressure distribution on the surface of car correspond to the airflow velocity distribution on the surface of car. The air flow accelerate at the front of the underbody because of smooth structure and the pressure decreases. The pressure at the front of the underbody is negative. There are lots of convex structures at the rear of the underbody, for example, frame, exhaust system, fuel tank, and spare tires, which are dashed by the high speed airflow. It can be seen clearly that the value of pressure in these regions are positive, as shown in Fig. 8. There are a lot of separating vortices in the rear of the car, which consume a lot of energy, and the pressure is negative.
As shown in Fig. 7 and 8, the aerodynamic drag increase because of the complex airflow of underbody. There are lots of airflow separation zones and the uncovered underbody structure is impacted directly by high-speed airflow. So, the key for reducing the aerodynamic drag is to control the underbody airflow reasonably and reduce the airflow separation and impact. It is very effective to install the wheel deflector and the underbody spoiler, and the influence of their structure parameters on the aerodynamic drag will be discussed as follow.
Fig. 7Streamline distribution of body and underbody
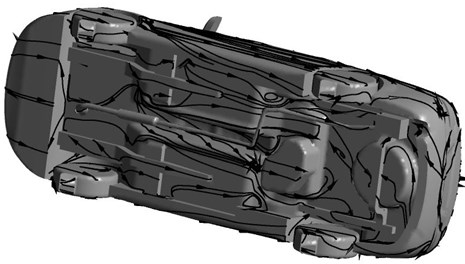
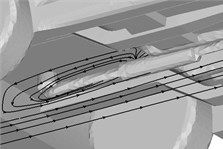
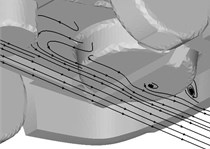
Fig. 8Pressure distribution of body and underbody
4.1. The influence of wheel deflector on aerodynamic drag coefficient
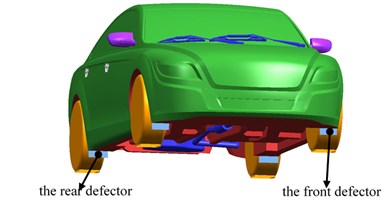
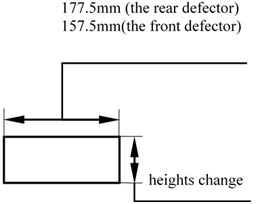
Aerodynamic drag is caused by air viscosity and separated vortices of the airflow. The main way to reduce aerodynamic drag is to avoid airflow separation. In this section, the way to reduce aerodynamic drag by controlling airflow of the wheel is analyzed. The wheel deflector could effectively steer the airflow around the wheels and gap, and prevented the high-speed airflow in front of the automobile impacting the wheels directly. The front wheel deflectors width are 157.5 mm and the rear wheel deflectors are 177.5 mm, which are in front of wheels, as shown in Fig. 9.
Fig. 9Wheel defector
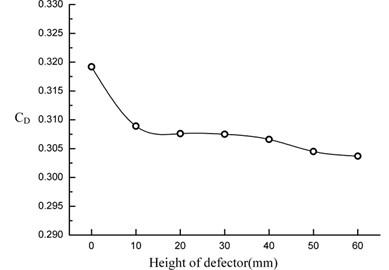
The variation of the aerodynamic drag coefficient, with the height of the wheel defector ranged from 10 mm to 60 mm, is plotted in Fig. 10. In 0 mm-60 mm level, the higher the wheel defector is, the more the aerodynamic drag coefficient decrease, especially in 0 mm-20 mm level and 40-60 mm level. When the wheel defector height is 60 mm, the aerodynamic drag coefficient decrease by 4.86 % compared to original scheme. Although the wheel defector will form additional aerodynamic drag by itself, but it will improve the airflow condition in the bottom of the vehicle, thus reducing the total aerodynamic drag of vehicle much more than itself increased drag. Therefore, the model with wheel defector has lower aerodynamic drag.
Fig. 10The change curve of the aerodynamic drag coefficient
4.2. The influence of underbody spoiler on aerodynamic drag coefficient
In this section, the way to reduce aerodynamic drag by controlling airflow of the underbody is analyzed. The vortex produced easily in the underbody and the spoiler could improve the airflow quality of the underbody, so it could steer the airflow around the underbody to install spoiler, which is helpful to reduce the aerodynamic drag. The front spoiler of the underbody installed at the bottom of the front bumper with three design plans, as shown in Fig. 11. Case one is the whole circular arc. Case two is open shape, which is composed of two segments of arc. Case three is linear, which is perpendicular to the bottom plate. This paper analyzed the change rule of the aerodynamic drag coefficient by the way of changing the height of spoiler for these three plans.
Fig. 11Three cases of underbody spoiler
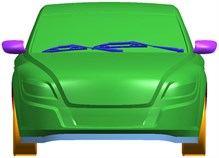

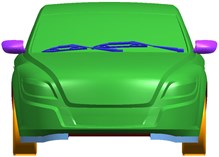

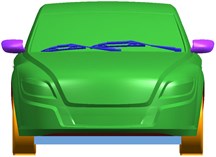

Fig. 12 and 13 show the effect of the height of underbody spoiler on the aerodynamic drag in case one and case two, and the aerodynamic drag could be reduced certainly in the two plans. The aerodynamic drag coefficient is lower in case one when the height is in 0 mm-40 mm level. But in 40 mm-60 mm level, the coefficient is lower in case two.
In case one, when the spoiler is in 0 mm-60 mm level, the aerodynamic drag coefficient decrease with the increase of the spoiler height, and the decrease is small in 20 mm-50 mm. The aerodynamic drag coefficient decrease mostly by 5.64 % in 60 mm level and the maximum value is 0.018.
In case two, when the spoiler is in 0 mm-60 mm level, the aerodynamic drag coefficient decrease at the beginning, then increased and decreased again at last with the increase of height. And a peak occur near 30 mm. The aerodynamic drag coefficient decrease mostly by 7.05 % in 60 mm level and the maximum value was 0.0225.
Fig. 12Change curve of drag coefficient in case one
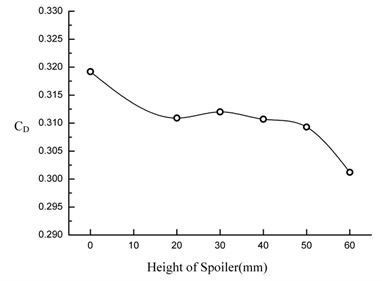
Fig. 13Change curve of drag coefficient in case two
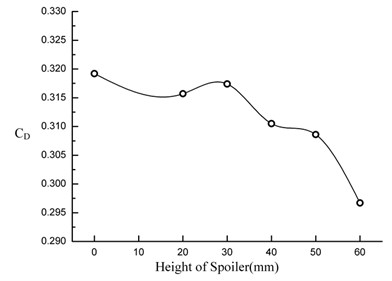
Fig. 14Change curve of drag coefficient in plan 3
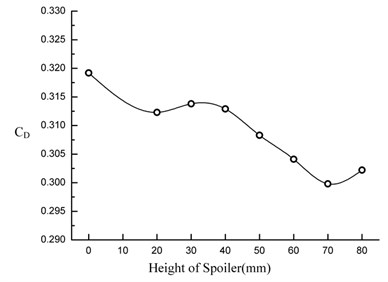
In case three, the aerodynamic drag coefficient reach a peak near 30 mm. The drag coefficient decrease obviously with the increase of the underbody spoiler height in 0 mm-20 mm level and 40-70 mm level and the coefficient increase certainly after reaching 70 mm. When the height is in 70 mm, the coefficient decrease mostly by 6.08 % and the maximum value is 0.0194.
The aerodynamic drag can be reduced by different shape of the spoiler. Although the spoiler will form additional aerodynamic drag by itself, it can prevent the airflow entering the bottom of car and increased the speed of underbody. The underbody structures are not dashed directly by the high speed airflow. The pressure of the underbody could be decreased and the aerodynamic drag of underbody is smaller.
5. Conclusions
In this paper the attempt was made to predict the airflow field of underbody and suggestions was offered for improvement. Firstly, by comparing and analyzing the experimental data and the results of numerical simulation, we draw the conclusion that the experimental data was identical with the results of simulation, which validated the accuracy of the numerical simulation. Secondly, by analyzing airflow field characteristics in underbody, this paper analyzed aerodynamic drag coefficients change according to the height of the wheel defector and underbody spoiler. The results demonstrated that the scheme of this paper was feasible, the overall conclusions drawn from the present simulation were as follows:
1) The aerodynamic drag increased by 23.4 % because of the complex airflow of underbody. The energy lost greatly due to the separation vortex of underbody and the uncovered underbody structure which was impacted directly by the high-speed airflow. The effects of those were greater for the aerodynamic characteristics.
2) The effects of the wheel deflector on reducing aerodynamic drag were obvious and the aerodynamic drag did not increase additionally due to deflector. When the deflector was in 0 mm-60 mm level, the aerodynamic drag coefficient decreased differently and the maximum of decrease was 4.86 % in 60 mm level.
3) The effect of the spoiler on reducing aerodynamic drag coefficient were obvious, but the aerodynamic drag increased additionally due to the additional frontal area of spoiler. Further analysis showed that the three kinds of plans were effective for reducing aerodynamic drag, but in plan 2, the aerodynamic drag force decreased mostly compared to two other plans, which was the best way to reduce the aerodynamic drag force of automobile. When the spoiler was in 0 mm-60 mm level, the aerodynamic drag coefficient decreased differently and the maximum of decrease was 7.05 % when in 60 mm level.
References
-
Abd Alla G.-H. Using exhaust gas recirculation in internal combustion engines: a review. Energy Conversion and Management, Vol. 43, Issue 8, 2002, p. 1027-1042.
-
Peter J., Dwight R. P. Numerical sensitivity analysis for aerodynamic optimization: a survey of approaches. Computer and Fluids, Vol. 39, Issue 3, 2010, p. 373-391.
-
Muyl F., Dumas L., Herbert V. Hybrid method for aerodynamic shape optimization in automotive industry. Computer and Fluids, Vol. 33, Issue 5, 2004, p. 849-858.
-
Gu Zheng Qi, He Gui Min Analysis on the driving stability of high-speed container truck in crosswinds. Transactions of Beijing Institute of Technology, Vol. 34, Issue 3, 2014, p. 250-254.
-
Hwang Bae Geun, Lee Sangseung, Lee Eui Jae, et al. Reduction of drag in heavy vehicles with two different types of advanced side skirts. Journal of Wind Engineering and Industrial Aerodynamics, Vol. 155, 2016, p. 36-46.
-
Kim Jeong Jae, Lee Sangseung, Kim Myeongkyun, et al. Salient drag reduction of a heavy vehicle using modified cab-roof fairings. Journal of Wind Engineering and Industrial Aerodynamics, Vol. 164, 2017, p. 138-151.
-
Suh Kwonhee, Yoon Hiseak Numerical investigations of the crosswind stability of the Korean light tactical vehicle during airlift. Journal of Mechanical Science and Technology, Vol. 31, Issue 3, 2017, p. 1067-1072.
-
Hui Zhu, Yang Zhigang Fluid-structure interaction study of three-dimensional vehicle model under crosswind. Advances in Mechanical Engineering, Vol. 7, Issue 6, 2015, p. 1-10.
-
Duo Q., Jinfu F., Jiaqiang Z., Yongli L. Flow field interference characteristic of axial ring wing configuration. Engineering Review, Vol. 36, Issue 1, 2016, p. 53-59.
-
Yang Y., Xu Y. K., Shen X. W., Guz Q. Improved research of automobile underbody flow field based on aerodynamic lift. Journal of Central South University, Science and Technology, Vol. 44, Issue 10, 2013, p. 4063-4068.
-
Zhang X., Senior A., Ruhrmanna Vortices behind a bluff body with an upswept aft section in ground effect. International Journal of Heat and Fluid Flow, Vol. 25, Issue 2004, 1, p. 1-9.
-
Sebben S. Numerical simulations of a car underbody: effect of front-wheel deflectors. SAE Technical Paper 2004-01-1307, 2004.
-
Cogotti A. A parametric study on the ground effect of a simplified car model. SAE Technical Paper 1998-02-23, 1998.
-
Huminica, Chiru A. On CFD investigations of vehicle aerodynamics with rotating wheels’ simulation. SAE Technical Paper 2006-01-0804, 2006.
-
Wordley S., Saunders J. Aerodynamics for formula SAE: a numerical, wind tunnel and on-track study. SAE Technical Paper 2006-01-0808, 2006.
-
Malviya V., Mishra R., Fieldhouse J. CFD investigation of a novel fuel-saving device for articulated tractor-trailer combinations. Engineering Applications of Computational Fluid Mechanics, Vol. 3, Issue 4, 2009, p. 587-607.
-
Yuan Z. Q., Gu Z. Q., Yang M. Z. An analysis on the effects of underbody structure on car aerodynamic characteristic in crosswind. Automotive Engineering, Vol. 39, Issue 2017, 1, p. 28-34.
-
Yang Yi, Zheng Meng, Huang Jianfeng, et al. Aerodynamic drag reduction method of vehicle body based on non-smooth surface and vortex interference. China Mechanic Engineering, Vol. 27, Issue 7, 2016, p. 982-988.
-
Gu Zhengqi, Chen Zhen, Huang Taiming, et al. research on aerodynamic characteristics of vehicle with an improved LRN k-e turbulence model. China Mechanic Engineering, Vol. 26, Issue 18, 2015, p. 2550-2555.
-
Wang Yiping, Wang Tao, Li Shuai Aerodynamic drag reduction of vehicle based on free form deformation. Journal of Mechanical Engineering, Vol. 53, Issue 9, 2017, p. 135-143.
-
Wang Y., Xin Y., Zhu Gu, et al. Numerical and experimental investigations on the aerodynamic characteristic of three typical passenger vehicles. Journal of Applied Fluid Mechanic, Vol. 7, 2014, p. 659-671.
Cited by
About this article
The research was supported by National Natural Science Foundation of China (Grant No. 51305312), Science and Technology Project of Education Department in Fujian Province (Grant No. JAT170414).

