Abstract
The residual vibration of steel rail is rich in the mechanical properties, which include the constraint, that was, the degree of tightness of the fastener. The aim of this research is to characterize the tightness of rail fastener. A fractal analysis procedure based on 1-D curve length calculation is proposed, which applies a length unit to cover fastening the behavior of fasteners. Using the rail vibration data under periodic pulse excitation measured by a track fastener inspection vehicle, this method can derive the fractal dimension of fastener tightness directly (D∈[1, 2)). Furthermore, 1-D curve length method is also introduced into multi-fractal spectrum analysis for investigating fine scale information. The statistical analysis demonstrates that, fractal dimension Dl, Dr, and multi-fractal parameters αfmax, ∆ can reflect the change process of the tightness of rail fasteners effectively. Therefore, it shows potential to use the fractal parameters of the rail vibration signal to characterize the tightness of the fastener.
1. Introduction
Aimed at the problem of automatic detection of rail fastener loosening, Bin Zhang, a researcher of Beijing Municipal Institute of Labour Protection, set up a special research and development team. After 2 years of research study, the 'Rail Fastener Failure Testing with Pulse Stimulation and Synchronized Detection Method' was originally proposed and achieved good recognition effect through a large amount of experimental verification. In this method, how to obtain the reasonable mathematical processing of the original data of the obtained vibration signal, and then realize the quantitative evaluation of the degree of fastener feeding is the key problem [1, 2].
Studies show that the rail vibration signal under the action of regular hammering has a certain degree of self affine invariance and scale characteristic, so the fractal method can be extended to the quantitative characterization of time series. In recent years, some scholars have shown that fractal methods can reflect the essential structural characteristics of time domain information. Fractal dimension is an important physical quantity, which quantitatively describes the complexity of the object and is widely used in complex system and complex signal analysis. The fractal dimension calculation method of one-dimensional time series is diverse [3-14]. Therefore, how to directly determine the fractal dimension of rail residual signal is a key problem in fractal measurement.
In the one-dimensional time series analysis, there are usually two ways to calculate the fractal dimension [3-4], one is to reconstruct the phase space of the time series, and then calculate the correlation dimension of the time series in the phase space [5-6]. Another way is to calculate the fractal dimension directly in the time domain. In this paper, the second method was used to detect the vibration signal data of the prototype car and the fractal dimension is directly measured, and the length information is applied to the mass probability function to analyze the multi-fractal spectrum. Respectively, single fractal and multiple fractal parameters were extracted to characterize the release degree of rail fasteners.
2. Single fractal and multi-fractal spectrum calculation
2.1. Single fractal calculation
According to the fractal theory [8], the measurement of the multi-fractal body is:
In the formula, is the European space dimension, and when it is 1, 2, 3 respectively, the formula corresponds to the fractal curve, the fractal area or the fractal volume. is the corresponding value for . Where 1, corresponds to the length, which is obtained by the actual measurement, and the fractal relationship is as show:
where is the length of the smooth curve when 1, and is the true fractal dimension of vibration signal, namely [1, 2). Take the logarithm of both sides of the equation and get the following formula:
where and are plotted on the -axis and -axis respectively, and the slope is calculated by the linear fitting, and then the fractal dimension is obtained.
2.2. Multi-fractal spectrum calculation
The simple fractal dimension is a kind of integral representation of the objects studied, and the multi-fractal analysis can be considered to reflect the finer information [9].
Calculate the multi-fractal, the first thing to be obtained is the probability distribution of the investigated physical quantity on the corresponding fractal structure. If a multi-fractal set is covered with a grid of scale , the probability distribution on the th is defined as , then the probability that the th grid with singularity can be defined as flows:
Let be the number of meshes with the singularity existence interval to , is defined as the Hausdorff dimension of the set of grids with singularity , then:
The generalized dimension with – order measuring moment is introduced, then:
or as two sets of independent parameters can describe the internal structure of multiple fractal, the relationship between them is as flows:
Combined with pulse residual vibration detection technique, the multi-fractal analysis of the rail vibration signal was carried out. The first step was to calculate and , and then the projection coverage probability was obtained. For each given value, the corresponding and could be calculated according to Eqs. (4)-(6). Therefore, the multi-fractal spectrum curve and the generalized fractal dimension curve with weight factor were given.
3. Test methods and equipment
3.1. Rail fastener failure testing with pulse stimulation and synchronized detection method
Pulse Stimulation method or hammering method was one of the most basic analytical methods in the study of the inherent mechanical properties or structural characteristics of the structural mechanics. The structure could obtain mechanical properties such as frequency, vibration mode and damping by analyzing the residual vibration response after a hit. In the case of steel rails, the residual vibration was rich in the mechanical properties of the rails, which included the constraint, that was, the degree of tightness of the fastener.
The specific detection method is: through the continuous strike and sampling along the rail, from the specific frequency band section of the three-dimensional spectrum can identify the relative position of each fastener and the loose fastener, reference to the GPS data to determine the spatial location of loose fasteners. Among them, the characteristic frequency is according to the rail model, fastener type, fastener spacing, ambient temperature and other parameters.
3.2. The track fastener inspection vehicle
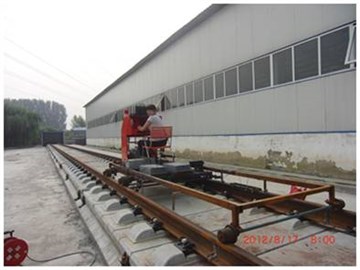
Based on the previous work, the track fastener inspection vehicle was developed, which was designed to be modular and easy to disassemble and assemble. As shown in Fig. 1, the vehicle body uses a double-layer structure, the upper body includes a signal detection device, and the lower body includes a drive and a pulse signal excitation device. When testing, the lower body drives the upper body. A flexible connection between the two layers reduces the effect of body vibration on signal acquisition.
Fig. 1The track fastener inspection vehicle
4. Results and analysis
4.1. Analysis based on single fractal
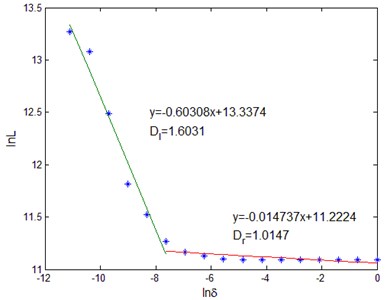
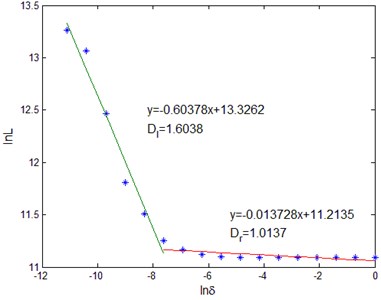
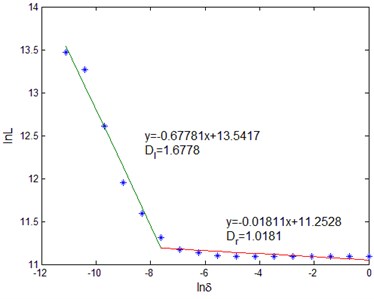
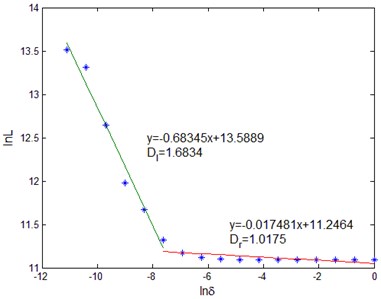
The fractal characteristics of rail vibration signal under periodic pulse excitation were analyzed Fig. 3 shows the fractal dimension of fastening fasteners and unfastening fasteners, respectively. It can be seen from Fig. 3 that the fractal dimension of the vibration signal is between 1 and 2, and the true fractal dimension of the vibration signal of the rail is directly measured, which provides a new way for the fractal analysis of the vibration signal. At the same time, it should be seen that the fractal dimension of the rail vibration signal has different fractal dimension in different measurement intervals ( and ), which reflects the local characteristics of surface self-similarity, that is, multi-fractal features. The different fractal dimensions in the two scale ranges indicate that the structural features and signal complexity obtained from these two scale ranges are different. characterizes the structural details of the relative detail that can be obtained in the smaller scale range, and characterizes the relative macroscopic structural information that can be obtained in the larger scale range.
Fig. 2Estimation of fractal dimension of rail vibration signal: a), b) fastening; c), d) unfastening
a)
b)
c)
d)
It can be seen from Fig. 2 that although and characterize the different scale range of fastener release degree, but with the unfastening of the fastener, the two are both increasing. The of fastening fastener is located around 1.60, while the of unfastening fastener is located at 1.68 or so, showing an upward trend. The of fastening fastener is located around 1.014, while the of unfastening fastener is located at 1.018 or so, which is on the upward trend, but it is not obvious compared with the change.
4.2. Analysis based on multi-fractal
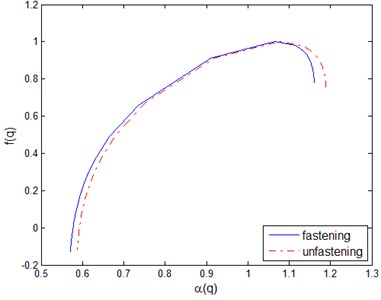
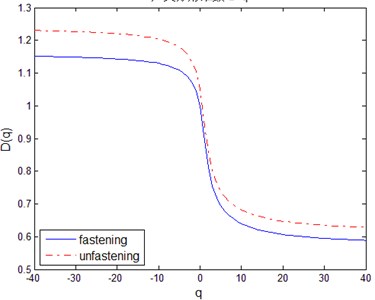
Fig. 3 shows the comparison of the multi-fractal spectrum curve and of the rail residual signal in the case of fastening and loosening. Table 1 lists the parameters of these multi-fractal spectrum, including the coordinates , and .
Fig. 3Multi-fractal characteristics of rail vibration signal: a) f~α, b) D~q
a)
b)
Table 1Multi-fractal spectrum parameters of rail vibration signal
Case | |||||||||
Fastening | 0.577 | 0 | 1.161 | 0.782 | 1.065 | 1.000 | 0.584 | –0.782 | 0.563 |
Unfastening | 0.593 | 0 | 1.189 | 0.757 | 1.077 | 1.000 | 0.596 | –0.757 | 0.602 |
reflects the irregularity, non-uniformity and complexity of the subset of sub-regions with the same singularity exponent α whose magnitude depends on the number of sub-regions that make up the subset, and reveals the status and trend of micro-scale types with the same singular exponent in the vibration model. As is show in Fig. 4, the curves are in the right hook shape, indicating that the vibration signal is subjected to different degree of local superposition, which leads to the non-uniformity of the vibration signal distribution. With the unfastening of the fastener, increases, indicating the maximum and minimum probability of the difference gradually increases, that is, the singularity of the length of each microelement in the vibration signal increases, which means that the vibration signal of loose fastener is more rough and irregular, and contains more details than the fastening fastener.
Curve reflects the unevenness of the fluctuation of the vibration signal. When 1, represents the dimension of the violent region of the fluctuating change of the vibration signal. When 1, represents the dimension of the subsets of the more flat area of the vibration fluctuation. So that the signal fluctuation in the region can be decomposed by the severity of the change, so as to more accurately grasp the regional range of signal changes. It can be seen from Fig. 4, the range is with increased the release of the fastener, indicating that the difference in vibration changes gradually increased, the degree of ups and downs gradually increased.
In summary, it can be seen that some multi-fractal spectral parameters are in-phase with the fastening degree of the fastener, and these multi-fractal spectral parameters can be used to quantitatively describe the characteristics of fastener.
5. Conclusions
A method of covering the multi-fractal body with vibration information was proposed. The fractal dimension [1, 2) of the vibration signal is directly measured by means of the original information of the rail vibration obtained by the rail fastener release test vehicle, then the quality probability function was further established, and the vibration signal was analyzed by multiple fractal spectrum. The results show that some fractal parameters change with the tightening degree of the fastener, which can be used to characterize the release of the rail fastener.
References
-
Huijuan Z., Qiang L., Wencheng H. Study on rail fastener failure testing with pulse stimulation and synchronized detection method. Noise and Vibration Control. Vol. 35, Issue 1, 2015, p. 349-353.
-
Qiang L., Huijuan Z., Wencheng H., Ruixiang S. Identification of loose rail fasteners by sound signals. Inter-Noise, 2017.
-
Jianqiang Q., Xiangyu K., Shaolin H., et al. Performance comparison of methods for estimating fractal dimension of time series. Computer Engineering and Applications, Vol. 52, Issue 22, 2016, p. 33-38.
-
Esteller R., Vachtsevanos G., Echauz J., et al. A comparison of waveform fractal dimension algorithms. IEEE Transactions of Circuits and Systems – I: Fundamental Theory and Applications, Vol. 48, Issue 2, 2001, p. 177-183.
-
Grassberger P., Procaccia I. Characterization of stranger attractors. Physical Review Letters, Vol. 50, Issue 5, 1983, p. 346-349.
-
Grassberger P., Procaccia I. Measuring the strangeness of strange attractors. Physica D: Nonlinear henomena, Vol. 9, Issue 2, 1983, p. 189-208.
-
Kai Y., Rencheng Z., Jianhong Y., et al. Series Arc fault diagnostic method based on fractal dimension and support vector machine. Transactions of China Electrotechnical Society, 2016.
-
Xia S., Ziqin W., Yun H. Fractal Principle and Application. China University of Science and Technology Press, 2006, p. 53-88.
-
Suang L., Jing Y. Research on DEM Data Uncertainty Based on Fractal. Science Press, 2007.
-
Xie Heping, Wang Jinan Multi-fractal behaviors of fracture surfaces in rocks. Acta Mechanica Sinica, Vol. 30, Issue 3, 1998, p. 314-320.
-
Raghavendra B. S., Narayana Dutt D. A note on fractal dimensions of biomedical waveforms. Computers in Biology and Medicine, Vol. 3, 2009, p. 1006-1012.
-
Castiglioni P. What is wrong in Katz's method? Comments on: A note on fractal dimensions of biomedical waveforms. Computers in Biology and Medicine, Vol. 40, 2010, p. 950-952.
-
Zhu W., Liang S., Wei Y., et al. Saliency optimization from robust background detection. Proceedings of IEEE Conference on Computer Vision and Pattern Recognition, 2014, p. 2814-2821.
-
Borji A., Cheng M. M., Jiang H., et al. Salient object detection: a benchmark. IEEE Transactions on Image Processing, Vol. 24, Issue 12, 2015, p. 706-5722.
About this article
This work was supported by Beijing Natural Science Foundation (No. 8164053) and the Postdoctoral Program Funds (2016ZZ-83).

