Abstract
In order to increase the diagnosis efficiency of plunger wear fault, a recognition method is developed using sensitivity analysis and probability neural network. Firstly, 17 time domain characteristics of vibration signal are extracted. Then analyzed the sensitivity of characteristics to failure to select sensitive characteristics parameters. Finally, PNN method to identify the degree of plunger wear was proposed. A hydraulic pump fault simulation experiment was designed, and validated the proposed method by experimental data. The results show that the method can quickly and effectively identify the degree of plunger wear.
1. Introduction
In modern industry, the hydraulic system plays an indispensable role. As the heart of hydraulic system, the hydraulic pump is surely essential. Timely, fast and accurately diagnosis of the hydraulic pump fault mode and the fault degree, can not only save valuable time for maintenance, but also help the maintenance personnel to make the most correct maintenance decisions.
Because of the importance of hydraulic pumps in industrial systems, more and more scholars [1, 2] are involved in the studies in fault diagnosis of hydraulic pumps. At the beginning, scholars mainly used time-frequency domain analysis [3], power spectrum analysis [4] and other traditional methods; these methods require the user with a high professional basis. Later, people set their sights on intelligent diagnosis, the main application of the method is Neural Network [5], Support Vector Machines [6], D-S Evidence Theory [7] etc. On the one hand, these methods surely have certain effect on the fault diagnosis of hydraulic pump, such as recognition fault modes; but on the other hand, there are also many shortcomings, such as the operations is complex and cannot diagnose the fault degree.
Plunger wear, slipper wear, swashplate wear, and loose slipper fault are common failure mode of hydraulic pump. There are many studies on the fault modes of slipper wear, swashplate wear, and loose slipper fault and so on. Because of the plunger wear fault preset is more difficult, the study of plunger wear malfunction is almost in a blank state.
In view of the problems of the lack of plunger wear malfunction and the difficulty of fault recognition, in this paper, the method of spectrum analysis is used to analyze the plunger wear fault, summed up the spectrum of different fault degree, and a recognition method is developed based on SA-PNN to recognize the degree of plunger wear.
2. Fault degree recognition method based on SA-PNN
2.1. Sensitivity analysis algorithm
In order to analyze the sensitivity of the characteristic parameters to the fault, we introduce the concept of sensitivity. Sensitivity is the degree of difference between the analyzed parameters and the reference parameters. The sensitivity is calculated as follows:
where u is sensitivity, Xi means the parameters to be analyzed, X represents baseline parameters.
The greater the sensitivity value u, the higher the sensitivity. That is to say, the greater the degree of difference in the parameter to be analyzed relative to the reference parameter. The greater the degree of difference in the parameter to be analyzed relative to the reference parameter, the more the fault information is reflected. The purpose of sensitivity analysis is to find out the characteristic parameters with high sensitivity to fault, and use it for fault diagnosis to improve the accuracy of the diagnosis.
2.2. Probabilistic neural network algorithm
Probabilistic neural network (PNN) is a kind of the feedforward networks, which was proposed by Specht D. F. in the 1990s, it used the Parzen window function to calculate the conditional probability density function of the sample to be identified, and then through Bayes classification criteria to complete the classification and identification of the model. Its topology is simple, and its algorithm design is easy, now it has been widely used in pattern recognition, pattern classification and data mining and so on [8].
The network spatial structure of PNN is respectively input layer, pattern layer, summation layer and output layer. Its network topology is shown in Fig. 1.
Fig. 1Probabilistic neural network structure
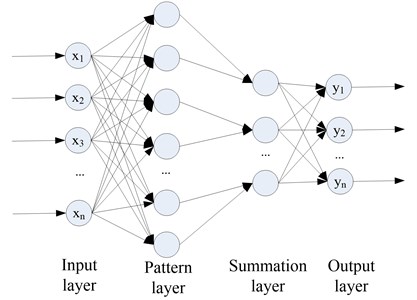
1) The input layer. The main task of this layer is to accept the input sample data, and then transfer it to the model layer for processing:
where XI is the input vector of the input layer, YI is the output vector. The number of nerve cells which is equal to the dimension of the feature vector of samples.
2) The pattern layer. The task of the pattern layer is to match the passing samples with the non-linear mapping of each pattern category:
The input and output relationships determined by the jth neurons of the pattern layer are defined as follows:
where d is the dimension of the input sample; σ is the smoothing factor; i=1, 2,…, M, j=1, 2,.., Gi; M is the total number of training samples; Gi is the ith class of training samples; XPij is the jth class of the data of the ith class of training sample; XP is the input of the model layer; YPij(XP) is the jth neuron output of the ith class of the pattern layer.
3) The summation layer:
where XTij and YTi represent the input and output of the ith neurons of the summation layer respectively.
4) The output layer.
Based on the Bayes decision rules for minimum misclassification, we can know that:
where XEi is the input of output layer, output C is the category number of the sample.
3. Data analysis
3.1. Experimental design
In order to study the fault performance and signal characteristics of different plunger wear, we specially designed a set of hydraulic failure simulation experiments.
The experiment used the swash plate type axial plunger pump, the plunger pump have 7 plunger, model 25YCY14-1B, nominal displacement 25 ml/rev, rated speed 1500 r/min. Drive motor type: YE3-132M-4, Rated speed 1500 r/min. Selecting BW14100 vibration acceleration sensor with rigid connection with the pump housing. As shown in Fig. 2.
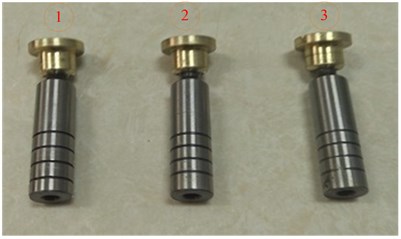
During the experiment, the main relief valve pressure is set to 8MPa, the vibration signal sampling frequency is 20 KHz. First, collect the normal state of the plunger pump acceleration signal. Then replace the normal parts with faulty parts, and collect the plunger pump acceleration signal of the fault condition. Set the fault: plunger wear 0.2 mm, plunger wear 0.3 mm, plunger wear 0.5 mm. The plunger used is shown in Fig. 3.
Fig. 2Sensor layout
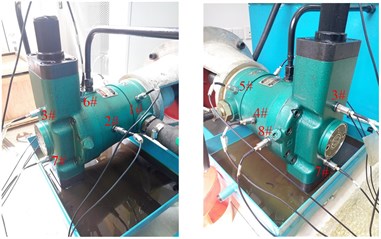
Fig. 3Failure plunger: 1) plunger wear 0.2 mm 2) plunger wear 0.3 mm, 3 plunger wear 0.5 mm
3.2. Spectrum analysis
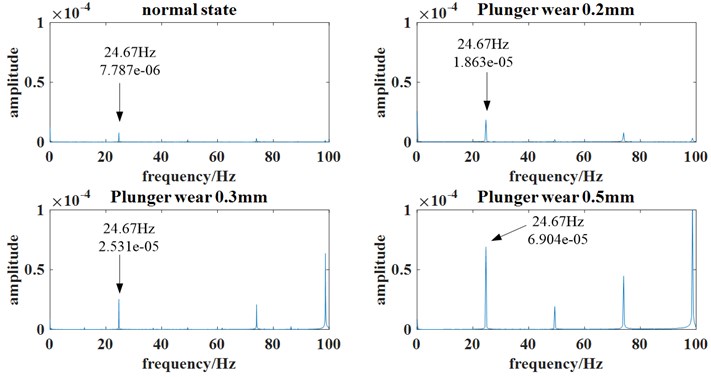
In the plunger pump failure simulation experiment, we set up a total of eight sensors for data acquisition. In this paper, we used the data of 3# sensor for analysis, Fourier transformed with the collected data, analyzed the spectrum of its low frequency band, found the location of the characteristic frequency, and observed the amplitude at the characteristic frequency. As the actual speed of the plunger pump is 1480 r/min. 1480/60 = 24.67 Hz, we can know the characteristic frequency of plunger wear is 1480/60 = 24.67 Hz through the calculation and analysis. After finding it, we compared all spectrum diagrams, and found that at the characteristic frequency of 24.67 Hz, with the increase of the plunger wear degree, the amplitude of the spectrum increases, as shown as Fig. 4.
Fig. 4The spectrum of plunger wears a different degree
3.3. Characteristic parameter extraction
In order to extract fault information more comprehensive, we extracted 17 time domain characteristic parameters. The 17 characteristic parameters were: Maximum, minimum, peak, peak to-peak, mean, root mean square RMS, standard deviation, energy, skewness, kurtosis, square root amplitude, average amplitude, waveform index, peak index, pulse index, margin index, clearance factor.
3.4. Sensitivity analysis
Each characteristic parameter can reflect a certain fault information. If we are going to analyze the 17 characteristic parameters, it will undoubtedly increase the difficulty of calculation. So, it is wise to choose a part of the characteristic parameters which are the best to reflect the fault information for analysis.
Using the 17 characteristic parameters for sensitivity analysis, the results were shown in Fig. 5.
Fig. 5The feature parameters sensitivity analysis
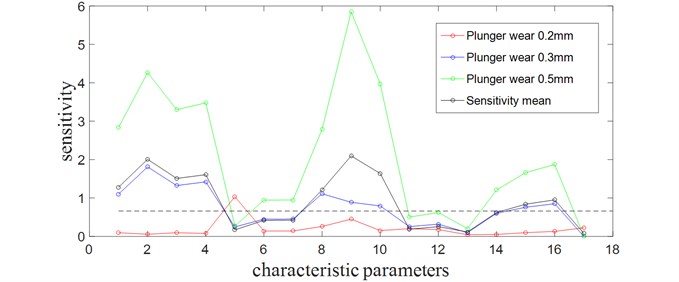
The above figure shows the sensitivity analysis of the characteristic parameters for each fault. The red curve represents the sensitivity of the plunger wear 0.2 mm fault condition characteristic parameter, the blue curve represents the sensitivity of the plunger wear 0.3 mm fault condition characteristic parameter, the green curve represents the sensitivity of the plunger wear 0.5 mm fault condition characteristic parameter. The black curve represents the mean of the sensitivity of each characteristic parameter of the three states. The cyan dashed line represents the discriminant baseline obtained by calculating the mean of all the characteristic parameters. The mean of the sensitivity of each characteristic parameter (the black curve) exceeds the baseline is considered to be highly sensitive, which will be selected as the characteristic parameter for fault diagnosis. After analysis, there are nine characteristic parameters whose average sensitivity are higher than the baseline. As shown in the Table 2.
After the analysis of the skewness, we discover the skewness is very unstable, and it fluctuates too much. It is not suitable to apply it to PNN for fault diagnosis, so we remove the skewness. Since the physical meanings of the maximum and the minimum are basically the same, we remove the minimum only to keep the maximum. As the pulse index sensitivity is relatively low, we discard the pulse index. At last, we select six feature parameters, such as maximum, peak, peak-to-peak, energy, kurtosis and margin index, as input vectors for fault diagnosis.
Table 2High sensitivity feature parameters
Serial number | Feature parameters | Sensitivity |
1 | Maximum | 1.2795 |
2 | Minimum | 2.0074 |
3 | Peak | 1.5097 |
4 | Peak-to-peak | 1.6062 |
5 | Energy | 1.2126 |
6 | Skewness | 2.0964 |
7 | Kurtosis | 1.6372 |
8 | Pulse index | 0.8385 |
9 | Margin index | 0.9508 |
3.5. Fault diagnosis
Input the six characteristic parameters selected from the four states into the constructed probabilistic neural network in vector form. Using three sets of data for training, and selecting 60 sets of data for testing. The test results are shown in the Table 3.
Table 3The accuracy of using SA-PNN
Wear degree | Number of tests | Correct number | Correct rate |
Normal state | 60 | 60 | 100 % |
Plunger wear 0.2 mm | 60 | 60 | 100 % |
Plunger wear 0.3 mm | 60 | 58 | 96.70 % |
Plunger wear 0.5 mm | 60 | 60 | 100 % |
Table 4The diagnostic results obtained without the sensitivity analysis
Wear degree | Number of tests | Correct number | Correct rate |
Normal state | 60 | 54 | 90 % |
Plunger wear 0.2 mm | 60 | 51 | 85 % |
Plunger wear 0.3 mm | 60 | 46 | 76.7 % |
Plunger wear 0.5 mm | 60 | 55 | 92 % |
While not through the sensitivity analysis only by feeling, we selected six characteristic parameters for fault diagnosis, which can also diagnose the fault. The selected characteristic parameters are: Peak-peak, mean, root mean square RMS, energy, kurtosis, clearance factor. However, compared with characteristic parameters through sensitivity analysis to diagnose fault, the correct rate is lower. The diagnostic results obtained without the sensitivity analysis as shown in Table 4.
As can be seen from the above analysis, it is indeed feasible and effective to identify the degree of plunger wear with PNN. After using the sensitivity analysis of the characteristic parameters, extracting the high sensitivity of the characteristic parameters for state recognition, can better improve the correct rate of recognition.
4. Conclusions
When the plunger pump is working, there are not only a rotary motion but also a reciprocating motion. Its movement is relatively complex, so the vibration signal is more complex. It is not easy to identify the degree of fault for a certain component. In this paper, through the traditional spectrum analysis, we found the characteristic frequency of plunger wear, and summed up the law of change of the spectrum, which will provide guidance for future study. The SA-PNN is proposed for the plunger wear degree recognition, and it is also verified with the experimental data. The results show that the method has a good effect on the recognition of fault degree, which is worth to promote the application in the project.
References
-
Wang Yukui, Huang Zhijie, Zhao Xucheng, et al. A novel de-noising method on discrete transform and its application in the fault feature extraction of hydraulic pump. Shanghai Jiaotong University, Vol. 21, Issue 3, 2016, p. 297-306.
-
Zhao Z., Jia M. X., Wang F. L., et al. Intermittent chaos and sliding window symbol sequence statistics-based early fault diagnosis for hydraulic pump on hydraulic tube tester. Mechanical Systems and Signal Processing, Vol. 23, Issue 5, 2009, p. 1573-1585.
-
Tang Yi Ke, Liang Feng Application of Time-Frequency Analysis Method to Start-up process analysis of high-pressure hydraulic pump. Journal of Southwest Jiaotong Univerity, Vol. 38, Issue 5, 2003, p. 525-527.
-
Chen Ji Ping, Rang Rui Jun Utilize cepstrum and diagnose the early fault of the hydraulic pump. Machinery Design and Manufacture, Vol. 9, 2005, p. 94-95.
-
Liu Hongmei, Wang Shaoping, Ouyang Pingchao Fault diagnosis based on wavelet package and Elman neural network for a hydraulic punp. Journal of Beijing University of Aeronautics and Astronautics, Vol. 33, Issue 1, 2007, p. 67-71.
-
Tian Hai Lei, Li Hong Ru, Xu Bao Hua Fault diagnosis of hydraulic pump based on D-S evidence theory SVM. Instrument Technique and Sensor, Vol. 5, 2013, p. 81-83.
-
Chai Ling Hua, Chen Xiao Hu, Wu Wen Feng Hydrulic pump fault diagnosis based on D-S theory evidence. Hydraulic Pneumatics and Seals, Vol. 10, 2010, p. 28-30.
-
Wang Hong, Xu Chang Ying, Deng Fang Ming Research on fault identification for rolling bearing based on independent component analysis and probabilistic neural network. Instrument Technique and Sensor, Vol. 12, 2016, p. 161-164.

