Abstract
In recent years, many studies have been conducted in hydraulic pump fault diagnosis, which usually ask for sufficient monitoring data. However, in some engineering applications, such as remote monitoring, it is not always guaranteed due to the limitations of transmission bandwidth and computational resources. To solve this problem, this paper proposes, a fault diagnosis method based on compressive sensing theory, which could guarantee the monitoring data can be compressed, and then recovered in remote side. First, original vibration signal of hydraulic pump is used to structure compressed dictionary matrix. Second, Gaussian random matrix is applied to compress the vibration monitoring data of hydraulic pump. Finally, stagewise orthogonal matching pursuit is introduced to reconstruct test data and classify the compressed test data vectors for lessening the diagnosis error rate and reducing the fault diagnosis time. Experimental results demonstrate that the proposed diagnostic can effectively identify and classify typical hydraulic pump faults.
1. Introduction
Hydraulic systems are widely used in many industries, as the hydraulic source of hydraulic systems, hydraulic pumps are important components in hydraulic systems, and fault diagnosis of hydraulic pump is a key method for increasing the reliability and performance of hydraulic systems [1]. Generally speaking, sufficient monitoring data are usually necessary for hydraulic pump fault diagnosis, however, in some engineering applications, such as remote monitoring, it is not always guaranteed due to the limitations of transmission bandwidth and computational resources. Fortunately, with Compressive Sensing (CS), the monitoring data can be compressed, and then recovered in remote side. For example, in Haile’s research, CS is used in structural health monitoring, and the cost of collecting monitoring data is reduced [2]; in Yu’s study, CS is combined with wireless sensor monitoring, used on coal mine [3].
However, in these studies, monitoring data is analyzed after data recovery [4], nevertheless, for hydraulic pump fault diagnosis, to reduce the computational resources consumption, we would like to manipulate the compressed data in measurement domain, without data reconstruction [5]. Nowadays, Matching Pursuit (MP) is always used for pattern classification in measurement domain, the advantage of MP is the relative high calculating speed and low computational resource consumption. Generally speaking, the iteration times of MP algorithms is determined by sparseness of the data, whereas, for hydraulic pump vibration data, the sparseness is hard to determine. Stagewise Orthogonal Matching Pursuit (StOMP), proposed by Donoho in 2012 [6], can be used for pattern classification without the sparseness of vibration data. Furthermore, it could be faster and simpler, compared with MP algorithm. In this paper, the vibration monitoring data of hydraulic pump was compressed with a random matrix, then, the compressed data was used for fault diagnosis with StOMP.
2. Methodology
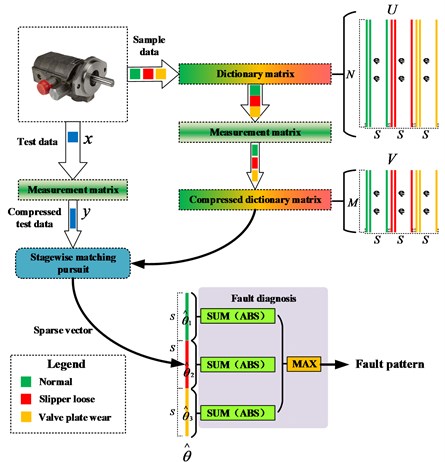
In this study, vibration data acquired from two fault patterns (include slipper loose fault pattern and valve plate wear fault pattern, together with normal condition) are used for fault diagnosis. The details are shown in Fig. 1.
The diagnosis algorithm consists of four parts: vibration data compression, dictionary matrix construction, stagewise orthogonal matching pursuit and fault diagnosis. First, the test vibration data of hydraulic pump is compressed with a measurement matrix, the types of measurement matrix include random matrix, Bernoulli matrix and polynomial matrix, etc. Then, the compressed test data is represented by pre-constructed compressed dictionary matrix based on stagewise matching pursuit algorithm, and a sparse vector is obtained. Finally, the sums of element absolute values in each section are calculated, and the position of section with maximum sum value is the fault type.
Fig. 1Fault diagnosis based on stagewise matching pursuit
2.1. Vibration data compression
Suppose the length of test vibration data is N, and is denoted as x. The measurement matrix is Φ, and its size is M×N, in this study, Gaussian random matrix is selected as the measurement matrix. Then, the test data is compressed as:
Meanwhile, dictionary matrix is also compressed with measurement matrix Φ.
Generally speaking, M is much smaller than N, and M/N≤0.5. In this way, the monitoring data of hydraulic pump is compressed, and the transmission bandwidth consumption is reduced.
2.2. Dictionary matrix construction
The dictionary matrix is composed of sample data acquired from normal working condition, slipper loose fault pattern and valve plate wear fault pattern. For each pattern, suppose the length of signal is L, and the sampling frequency is fS, the sampling time is t, thus, for each pattern:
Then the sample data are divided into several segments, and the length of each segment is N, same with the length of test data, and the number of segments are:
The segments from the same pattern are arranged together as dictionary matrix U, therefore, the size of dictionary matrix is N×3S, as shown in Fig. 1.
After that, the dictionary matrix is also compressed with the measurement matrix, and the size of compressed dictionary matrix is M×3S:
Later, after compression, these compressed segments are used for compressed test data representation.
2.3. Stagewise orthogonal matching pursuit
The Stagewise Orthogonal Matching Pursuit (StOMP) is proposed by Donoho, in his paper [6], StOMP aims to achieve an approximate solution to y=Vθ, where V comes from Uniform Spherical ensemble, and θ is sparse. However, in our study, the compressed dictionary matrix V plays the role of matrix V.
The details of StOMP algorithms used for fault diagnosis are shown in as follow. In the following, rt is the residue, t is the iteration counter (its max value is P), Jt is the index numbers (column ordinals) of each iteration, Λt is the union set of t times iteration, vj is the jth column of matrix V, Vt is the subset of V, which is selected according to Λt.
StOMP algorithm procedure:
Input:
• The compressed dictionary matrix V, size: M×3S;
• The compressed test data y, size: M×1, and y=Vˆθ,
• The maximum number of iteration stages P,
• The threshold parameter tt.
Output:
• The sparse vector ˆθ;
• The residual rp=y-Vpˆθp, size: N×1.
Detail procedure step:
(1) Initialization: r0=y, Λ0=∅, V0=∅, t1=1.
(2) When it is the tth stage.
Calculate current residual Th:
here σt is a formal noise level and tt is a threshold parameter.
Then applies matched filtering to the current residual, getting a vector of residual correlations:
The procedure next performs hard thresholding to find the significant elements (a small set Jt of “large” coordinates):
(3) Updating the estimate, meaning merge the subset of newly selected coordinates with the previous support estimate:
When Λt=Λt-1, procedure could be go to Step 4.
(4) Calculate least squares solution of y=Vtθt:
(5) The updated residual is:
(6) We check a stopping condition (t+1>P or tt=0) and, if it is not yet time to stop, go to the next stage of the procedure.
(7) If it is time to stop, we set ˆθ=θt as the final output of the procedure.
Finally, we can get the restructure signal x:
2.4. Fault diagnosis
By using StOMP algorithm, the sparse vector ˆθ is calculated. The size of ˆθ is 3S×1, as shown in Fig. 1 Each element of the sparse vector corresponds to a column in compressed dictionary matrix V. According to sparse representation theory, the sample vectors in matrix V, which share the same pattern with the test data, represent the test data better than other vectors, in other words, the corresponding elements in vector ˆθ are larger than others. Thus, in this study, the absolute value sum of each element in each segment is calculated, and the maximum one corresponds to the pattern, as shown in Fig. 1. The details are:
In Eq. (14), r1 denote working condition, r2 denote slipper loose fault pattern, and r3 denote valve plate wear fault pattern:
Fig. 2Plunger pump rig
3. Case study
3.1. Experiment setup
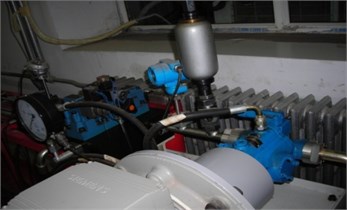
In this study, a plunger pump were employed to verify the effectiveness of the proposed method, the pump is shown in Fig. 2. Based on the statistics of pump faults, two common faults, slipper loose fault and valve plate wear fault, were introduced into the test rig. Vibration data were acquired by an accelerator, which embedded on the end face of the plunger pump, the rotational speed was 528 r/min, and the sampling rate was 1000 Hz.
3.2. Data compression
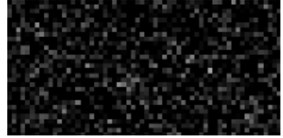
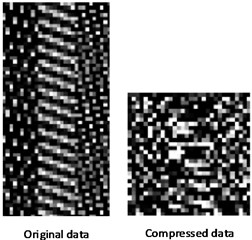
In this paper, size of the measurement matrix was 30×60, as shown in Fig. 1(a), and the figure was based on image gray scale. Fig. 1(b) is the original data and compressed data. With the measurement matrix, the size of the test data was halved. Later, the compressed would be used for fault diagnosis instead of the original data.
3.3. Dictionary matrix construction
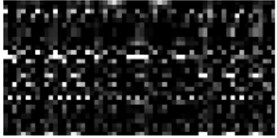
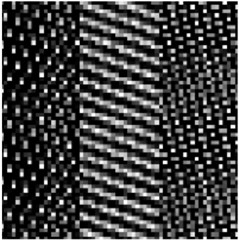
The length of an segment (a column in dictionary matrix) is 60, same with the test data, and each pattern contained 20 segments, in other words, here, N=60, S=60, the size of dictionary matrix was 60×60, as shown in Fig. 3(d). Then, the dictionary matrix was compressed with the measurement matrix, according to Eq. (4), the size of the compressed dictionary matrix is 30×60 (see Fig. 3(b)).
Fig. 3Measurement matrix and data compression
a) Measurement matrix
b) Compressed distionary
c) Data compression
d) Dictionery matrix
3.4. Stagewise orthogonal matching pursuit
Here, the maximum number of iterations P was set as 2. Threshold parameter tt was set as 0.9, and formal noise level σt was set as ‖rt‖2/√M.
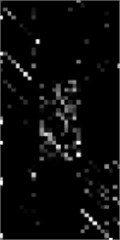
The sparse vector ˆθ, is shown in Fig. 4(a), for test samples No. 1-No. 10, the maximum value area was in the 1st elements to the 10th elements, indicated that the corresponding samples in the compressed dictionary matrix represented the test samples better than others. Other test samples shared the same appearance.
3.5. Fault diagnosis
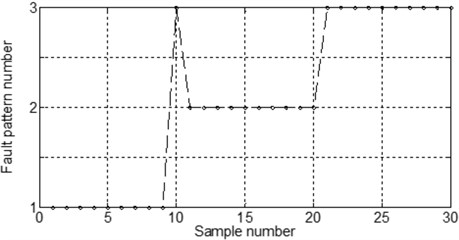
The results of fault diagnosis is shown in Fig. 4(b). In 30 test samples, only 1 samples were diagnosed incorrectly, thus, the accuracy of the proposed method is 96.67 %. The time consumption is 0.47 seconds.
Fig. 4Sparse vectors and diagnosis results
a) Sparse vectors
b) Diagnosis results
3.6. Time consumption comparison
In this part, the test samples were used for fault diagnosis based on Orthogonal Matching Pursuit (OMP) algorithm, and the total time consumption is 3.25 seconds, and the diagnosis accuracy is 96.25 %. Therefore, fault diagnosis based on StOMP algorithm is faster than OMP algorithm.
4. Conclusions
In this work we have presented a method of hydraulic pump fault diagnosis method based on StOMP algorithm. The advantage of this methodology is the practical value in engineering applications of remote fault diagnosis, because of the data size reduction. Meanwhile, since the sparseness of the vibration signals is not needed, this method is more suitable for vibration signals, compared with OMP algorithm. Experiment results show that the diagnosis accuracy of this method is 96.67 %, and it is faster than OMP algorithms. Furthermore, this method will be applied to the fault diagnosis of other rotary machineries, such as bearing, or gear, etc.
References
-
Azadeh A., Ebrahimipour V., Bavar P. A fuzzy inference system for pump failure diagnosis to improve maintenance process. The case of a petrochemical industry. Expert Systems with Applications, Vol. 37, 2010, p. 627-639.
-
Haile M., Ghoshal A. Application of compressed sensing in full-field structural health monitoring. Proceedings of SPIE, Smart Sensor Phenomena, Technology, Networks, and Systems Integration, 2012, p. 834618.
-
Yu J., Liu X., Cui T. Application research of compressed sensing in wireless sensor monitoring networks on coal mine. Innovative Computing, Information and Control (ICIC) Express Letters, Part B: Applications, Vol. 6, 2015, p. 1653-1659.
-
Duan Z., Kang J. Compressed sensing techniques for arbitrary frequency-sparse signals in structural health monitoring. Proceedings of SPIE, Sensors and Smart Structures Technologies for Civil, Mechanical, and Aerospace Systems, 2014, p. 90612W.
-
Calderbank S. J. Robert, Schapire Robert Compressed Learning: Universal Sparse Dimensionality Reduction and Learning in the Measurement Domain. Technical Report, 2009.
-
Donoho D. L., Tsaig Y., Drori I., Starck J.-L. Sparse solution of underdetermined systems of linear equations by stagewise orthogonal matching pursuit. IEEE Transactions on Information Theory, Vol. 58, 2012, p. 1094-1121.
About this article
This research was supported by the Technology Foundation Program of National Defense (Grant No. Z132013B002).
