Abstract
Oleo-damping performance is a key factor affecting the landing gear buffer performance, while the flow discharge coefficient determines buffer damping force. For improving the calculation precision of discharge coefficient estimation method in aircraft design manual, a model for discharge coefficient is established based on pipeline fluid mechanics and damping orifice structure, and a numerical calculation is performed. Computational fluid dynamics (CFD) analysis is also conducted for damping orifice structure using the commercial software FLUNET. The simulation result of damping orifice discharge coefficient correlates well with the theoretical result. On this basis, landing gear drop dynamic response are calculated with the numerical analysis method using obtained discharge coefficient and compared with experimental results. Furthermore, the influences of current discharge coefficient estimation method and simulation method are analyzed and compared on the hydraulic force and the ground reaction force. The study demonstrates that the poor precision of discharge coefficient estimation method in aircraft design manual leads to more than 30 % differences between the drop dynamic estimation results and the experimental results. The method of CFD simulation or theoretical analysis can improve the calculation precision of discharge coefficient by about 17 %.
1. Introduction
The shock absorber is an essential component of modern landing gears, as it absorbs most of the impact energy that aircraft suffered during takeoff and landing phase [1]. For the landing gear, the buffer performance, an important performance index, can be effectively checked through drop test. There are four fundamental force elements, (hydraulic force, air spring force, friction force and structural limit force), in landing gear drop dynamic modeling usually [2]. Among them, the hydraulic force accounts for a large proportion of the axial force. And the energy absorbed by the shock absorber is mostly dependent on the hydraulic force generated by the oil flow through orifice to dissipate [3]. For a given shock absorber, the magnitude of hydraulic force is determined by the orifice discharge coefficient, oil properties and strut telescoping velocity.
In previous studies, the main focus on the drop dynamic response of landing gear is the structural parameters, air spring force, friction force and structural force, rather than the discharge coefficient [4-7]. It is common that the discharge coefficient is estimated empirically as a constant in the landing gear dynamic analysis. However, Wahi M. K. elaborated the effects of Reynolds number and metering pin shapes on the discharge coefficient and established the expression of the discharge coefficient [8].
At present, estimation methods of the discharge coefficient are mostly based on the data and experience, which are accumulated in the experimental studies of the existing orifices. Some estimation rules are summed up based on orifice area and inlet status, but other factors such as the ratio of orifice length to orifice diameter (/), the ratio of orifice diameter to pipe diameter (/), Reynolds number and back pressure are not taken into account [9]. It is the main reason that result in the low accuracy of current estimation methods. To obtain a more accurate result of discharge coefficient, the theoretical and CFD simulation methods are essential.
Theoretical studies of the orifice discharge coefficient are primarily based on the Bernoulli equation and the experimental data to derive the empirical or semi empirical formulas. In previous work, many researchers tested different structural orifices, and investigated the effects of orifice structures on the discharge coefficient [10-15]. Unlike the single orifice, the performed orifice has some unique properties. In Shanfang Huang’s [16] research, the effect of the performed orifice structural parameters on the discharge coefficients was assessed in terms of pressure drop. Yu B. [17] and Tharakan K. J. [18] observed the influence of back pressure on the discharge coefficient and proposed a series of empirical formulas for predicting the discharge coefficient with wide applications. Mazzei L. [19] collected a number of previous investigations of the discharge coefficient and compared them with new experimental data.
In this paper, according to the shortcomings of the current discharge coefficient estimation method, the theoretical calculation and CFD simulation methods are put forward. These methods are adopted to calculate the orifice discharge coefficient, hydraulic force and drop dynamic response of an unmanned aerial vehicle (UAV) nose landing gear respectively. To analyze the influences of calculation methods, comparisons are conducted between obtained results and experimental results.
2. Modeling of shock absorber
2.1. Shock absorber configuration
The UAV has a half-fork nose landing gear, mainly constituted of tire, fork, shock strut and torque arm. Among them, the shock strut is with the most complex structure. Fig. 1 shows a schematic sketch of the landing gear and its shock absorber.
Fig. 1Landing gear configuration and shock absorber with section view
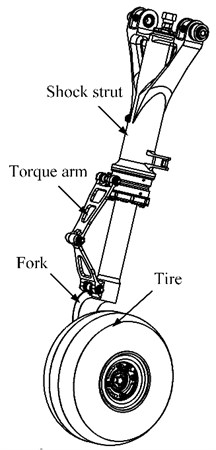
a) Landing gear
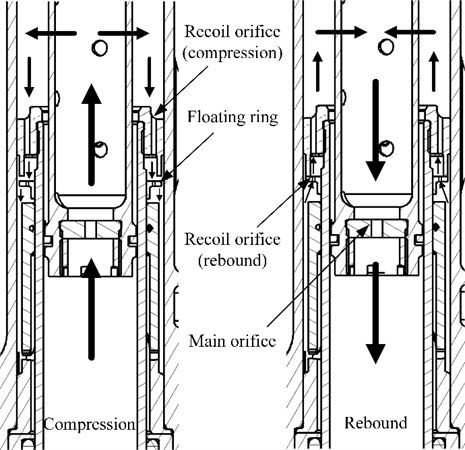
b) Shock absorber
During the compression stroke, the oil flows from the lower chamber to the upper chamber through the main orifice and compresses the air in the air chamber. Synchronously, part of the oil flows to the recoil chamber through the recoil orifice. When the shock absorber reaches the maximum compression stroke, it enters the rebound process under the stored potential energy of the air spring. While the floating ring moves upwards, the oil is forced from the recoil chamber to the upper chamber through the orifices of the floating ring. The high pressure in the air chamber drivers the oil return to the lower chamber through the main orifice. At this point, the shock absorber hydraulic force is mainly generated by the main orifice and the orifices of the floating ring. The recoil orifices as well as the main orifice are square-edged cylindrical orifices, and their sizes are described in Table 1.
Table 1Geometry of the orifices
Orifice | Number | Orifice diameter / mm | Orifice length / mm | Pipe diameter / mm | ||
Main orifice | 1 | 4.8 | 7 | 41 | 1.4583 | 0.117 |
Recoil orifice (compression) | 34 | 2 | 14 | 8.16 | 7 | 0.29 |
Recoil orifice (rebound) | 3 | 1.3 | 2 | 25.82 | 1.538 | 0.05 |
2.2. Damping characteristic analysis
As shown in Fig. 2, after passing through the orifice inlet, the oil forms a vena contracta at c-c section, where the paths of the particles are parallel. Bernoulli’s equation is applied to 1-1 and 2-2 sections:
where and is the pressure in the 1-1 and 2-2 section respectively, donates the gravitational constant, and is the mean velocity of the fluid in the 1-1 and 2-2 section respectively, and is the height of the 1-1 and 2-2 section respectively, is the resistance coefficient, is the density of the fluid.
Fig. 2Schematic diagram of orifice outflow
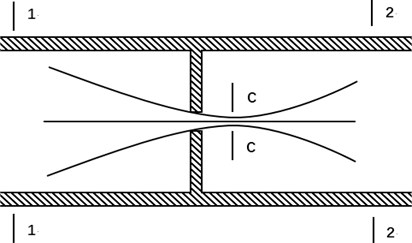
Therefore, the expression of the flow rate and the hydraulic force can be obtained:
where is the pressure difference, is the contraction coefficient, is the velocity coefficient, is the discharge coefficient, is the flow rate through orifice, is the sectional area of the orifice inlet, is the sectional area of the 2-2 section, is the hydraulic force.
Form Eq. (2), the discharge coefficient is related to the flow rate, pressure difference and fluid property, and its value cannot be obtained by purely theoretical calculations. Some estimation methods of the discharge coefficient are provided in a few engineering manuals.
3. Discharge coefficient and hydraulic force calculation method
Fig. 3 shows the flow diagram of different calculation methods for the shock absorber discharge coefficient. For the current discharge estimation method, drop test is indispensable to obtain the accurate result of the discharge coefficient. The initial discharge coefficient estimation result is substituted into the dynamic model to calculate the dynamic response, and it is adjusted according to the comparison with the experimental result. After iterations and adjustments, the calculation result of the dynamic response is basically consistent with the experimental result. Thus, the accurate result of the discharge coefficient is obtained.
While the estimation method costs a lot of time and resources, the theoretical calculation and CFD simulation methods can calculate the discharge coefficient quickly and accurately according to the given shock absorber structures.
Fig. 3Flow diagram of discharge coefficient calculation methods

3.1. Discharge coefficient estimation method
At present, the following equation in the aircraft design manual is used to calculate the hydraulic force of the oleo-pneumatic shock absorber [9]:
In which:
where is the hydraulic area, is the damping coefficient, is the strut telescoping stroke.
The discharge coefficient estimation of square-edged cylindrical orifice is mainly based on the area ratio of the orifice. The orifice with round inlet usually has a larger discharge coefficient under the same condition. For this kind of orifice, it is necessary to estimate the discharge coefficient according to the radius of the inlet round.
In the aircraft design manual, the recommended value for damping coefficient of sharp-edged orifice and rounded orifice is 2.0-2.5 (0.632-0.707) and 1.2 (0.913) respectively [9]. Aircraft landing gear strength design guidelines suggests that the orifice discharge coefficient should be 0.7-1.0 [21]. There is no specific method to estimate the discharge coefficient in other aircraft landing gear design manuals. Commonly, it is regarded as a known constant of the landing gear.
All the orifices involved in this paper are square-edged cylindrical orifices. According to the estimation method in the aircraft design manual, the result of main orifice discharge coefficient is 0.695. The discharge coefficient of the recoil orifice in compression stroke and rebound stroke is 0.652 and 0.694 respectively.
3.2. Discharge coefficient theoretical calculation
The calculation of orifice discharge coefficient involves many parameters, such as orifice diameter, ratio, ratio, back pressure, Reynolds number, inlet status, et al. Among them, ratio and Reynolds number are the main factors that affect the discharge coefficient, and others are treated as correction factors to correct the expression of the discharge coefficient.
As can be seen from Table 1, the main orifice and the recoil orifice in rebound stroke have the same geometric sizes. When the Reynolds number is less than 5000, the calculation equation proposed by Yu B. [18] is applicable to these orifices:
When the Reynolds number is not less than 5000, the calculation equation proposed by Hall GW is adopted [17]:
Since the ratio of the recoil orifice in compression stroke is greater than 2, the following equation can be used over the entire Reynolds number range [20]:
Using the above three equations, the discharge coefficients throughout the entire stroke are obtained and shown in Fig. 4.
Fig. 4Effects of Reynolds number on discharge coefficient
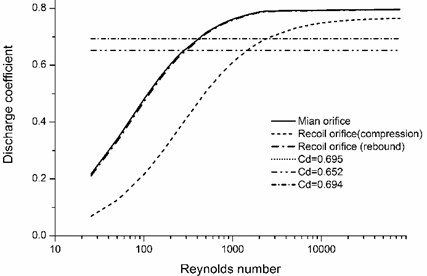
According to Fig. 4, the discharge coefficient increases rapidly with Reynolds number at first and then gradually tends to a constant value. The discharge coefficient of the main orifice and the recoil orifice in rebound stroke is basically the same, and the final stable result is 0.79. Due to the large ratio, the discharge coefficient of recoil orifice in compression stroke is smaller than that of main orifice, and its stable result is 0.76. Fig. 4 also shows the estimation results of orifices, and it can be found that there are great differences between the estimation results and the theoretical calculation results.
3.3. Modeling of shock absorber hydraulic force
The expression of the main orifice hydraulic force is described in Eq. (4). Unlike the main orifice, there are several parallel orifices in the recoil chamber. According to the pipeline fluid mechanics, each orifice has the same flow rate when the fluid passes through the parallel orifice. So, each orifice produces same energy loss and hydraulic force, which can be calculated by the same way in the main orifice. The recoil orifice hydraulic force can be expressed as:
where is the number of recoil orifices, is the discharge coefficient of the recoil orifice, is the sectional area of the recoil orifice, is the hydraulic area of the recoil orifice.
The hydraulic force of the shock absorber can be expressed as:
3.4. Hydraulic force CFD simulation
The current empirical formulas of the discharge coefficient are not widely applicable to various types of orifices, resulting from their different requirements for the orifice geometry and the Reynolds number. For some special orifice structure, the applicable empirical formula is still lacking. Thus, a more widely applicable CFD simulation method is adopted to calculate the discharge coefficient and the hydraulic force.
The three-dimensional models of shock absorber are generated by using the commercial pre-processor ICEM, as showed in Fig. 6. Velocity inlet and pressure outflow boundary conditions are specified at the inlet and outlet of the model respectively. Owing to the periodic property of models, periodic boundary is assigned to the side surfaces, and the remainder is defined as wall boundary condition. It minimizes the number of grids and significantly reduces the computing time. To obtain a grid-independent solution, the grid of the finite volume model is refined until the result no longer varies with the grid density. The hydraulic force is obtained by measuring the pressure loss between the ends of the shock absorber.
The standard form of - turbulence model is used in the simulation. It introduces an additional equation of turbulent dissipation rateon the basis of the equation for the turbulent kinetic energy . Its control equations are written as:
where is the turbulent kinetic energy, is the turbulent dissipation rate, is the molecular viscosity, is coefficient of turbulence viscosity, is the generation item of turbulent kinetic energy caused by velocity gradient, , is the empirical coefficient. The calculation results are shown as Fig. 6.
Fig. 5Finite volume models of shock absorber

a) Compression

b) Rebound
Fig. 6Velocity distribution

a) Compression

b) Rebound
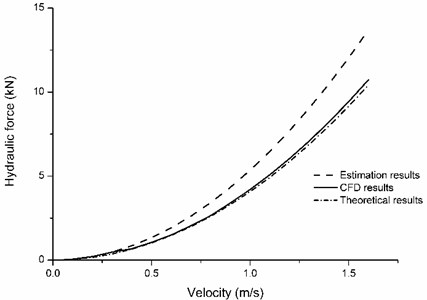
The discharge coefficients calculated above are substituted into Eq. (10) to obtain the relationship between the shock absorber hydraulic force and the strut telescoping velocity, as shown in Fig. 7.
As can be seen from the Fig. 7, the simulation result is consist with the theoretical result with a maximum error of 3 %. However, the estimation result is significantly greater than the CFD result.
Fig. 7Effects of calculation methods on discharge coefficient
4. Drop dynamic model
4.1. System motion equations
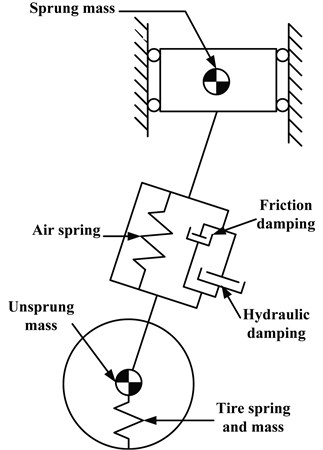
Fig. 8 shows the forces on the landing gear. The basic equations of motions are those used of a two-degree-of freedom system as shown in Fig. 9. The landing gear mass is simplified into two parts: the sprung mass and the unsprung mass, and two independent coordinate systems are established at the mass centroid of these two parts respectively.
Fig. 8Forces on the landing gear
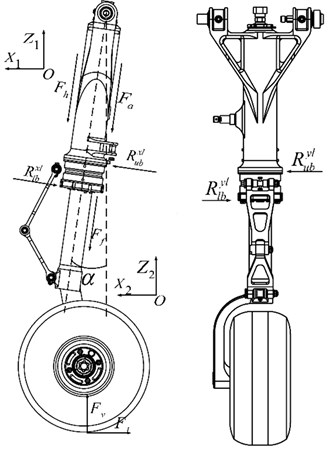
Fig. 9System with two degrees of freedom
In Fig. 8, is the air spring force, is the hydraulic force, is the friction force, and is the vertical and horizontal tire reaction force respectively, and is the upper and lower bearing reaction force in plane respectively, and is the upper and lower bearing reaction force in plane respectively, is the anteversion angle of shock strut.
Without considering the tire rotation and deformation in the horizontal direction, equations of motion can be expressed as:
where and is the vertical displacement of the sprung mass and unsprung mass respectively.
4.2. Modeling of shock absorber forces
4.2.1. Air spring force
In the oleo-pneumatic shock absorber, air is mainly used to store part of the absorbed impact energy. The air spring force is influenced by a lot of factors, and it can be expressed as [3]:
where is the pneumatic area, is the initial air pressure, is the initial air volume, is the air polytropic exponent, is the atmosphere pressure.
4.2.2. Friction force
The friction force in the landing gear mainly comes from two sources, friction due to the tightness of the seal and the deformation of the shock strut, and it can be expressed by [4]:
where is the friction force due to the deformation of the shock strut, is the friction force due to the tightness of the seal.
The friction due to the deformation of the strut is the result of the strut anteversion angle and the forces on tire. It can be expressed by:
where is the friction coefficient.
The seal friction is assumed to be a function of air pressure and can be expressed as:
where is the friction coefficient of the seal cup.
4.2.3. Tire vertical reaction force
During landing gear landing progress, the vertical reaction force is result from the tire compression, and it can be expressed as [2]:
where is the tire vertical damping coefficient, is the tire hub vertical displacement, is the tire hub vertical speed, is the tire static compression curve.
4.2.4. Hydraulic force
The equation of hydraulic force is shown in Eq. (10).
5. Drop dynamic analysis
5.1. Drop test system
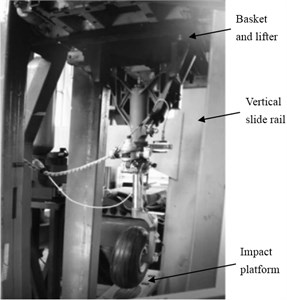
As shown in Fig. 10, the drop test system is mainly composed of lifter, vertical slide rail, impact platform and basket. The connect method of the landing gear and the basket is same as that of the landing gear and the fuselage. Before the test, it is necessary to calculate the release height and weight according to the aircraft parameters and the sinking speed. The additional weight is added to the basket, and both the landing gear and the basket are lifted to the release height by the lifter.
Once the basket is released, a variety of sensors are used to record the dynamic response of the landing gear. Three displacement sensors are used to measure the shock absorber compression stroke, the tire compression and the vertical displacement of the basket, respectively. An acceleration sensor is placed at the basket to measure its vertical acceleration, and two acceleration sensors are placed at the tire axle to measure its vertical and horizontal acceleration. Besides, there are five force sensors at the bottom of the impact platform, one for horizontal force measurement and the rest for vertical force measurement.
Fig. 10Drop test system
5.2. Numerical calculation and analysis
According to the drop dynamic model constructed above, a program was developed to calculate the dynamical response of the landing gear during drop process. Parameters of the landing gear used in the analysis are listed in Table 2. The results of dynamic response are compared with experimental and estimation results, as shown in Figs. 11-13 and Table 3.
Table 2Parameters of the landing gear
Anteversion angle / ° | Pneumatic area / cm2 | Hydraulic area /cm2 | Air pressure / MPa | Air volume / ml | Release weight / kg | Release height / mm |
8 | 18.1 | 13.2 | 0.64 | 268 | 315 | 269 |
Fig. 11Results of shock strut axial force
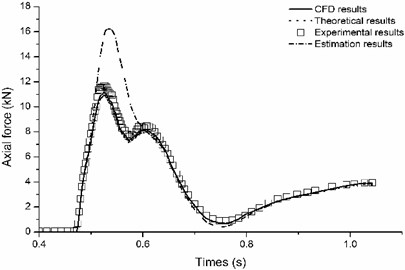
Fig. 12Results of hydraulic force
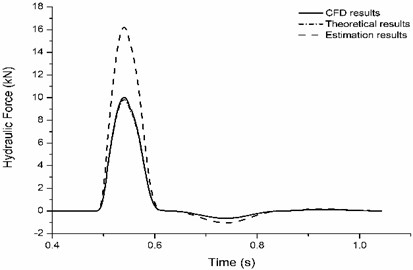
Fig. 13Landing gear energy absorption of drop test
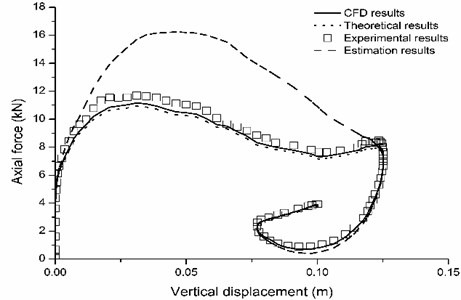
As can be seen from Fig. 11 and Fig. 13, the theoretical calculation and CFD simulation results of axial force and energy absorption are both consistent with experimental results. Since the discharge coefficient estimation value is smaller than the actual value, the estimation result of hydraulic force is significantly greater than the actual hydraulic force. Because of the large proportion (up to 60 %) of hydraulic force in the axial force, the axial force estimation result is also greater than the experimental result.
Table 3Comparison of numerical calculation and experimental results
/ kN | / kN | / kN | / kN | / kN | |
Experimental results | 11.691 | 0.896 | 8.473 | / | / |
CFD results | 10.824 | 0.849 | 8.181 | 10.041 | –0.649 |
Relative error | –7.42 % | –5.25 % | –3.45 % | / | / |
Theoretical results | 10.786 | 0.852 | 8.133 | 9.832 | –0.641 |
Relative error | –7.74 % | –4.91 % | –4.01 % | / | / |
Estimation results | 16.092 | 0.502 | 10.775 | 15.901 | –1.023 |
Relative error | 37.64 % | –43.97 % | 29.71 % | / | / |
In Table 3, is the total axial force of the shock strut, subscript max and min stands for the maximum and minimum value, is the axial force at the second wave crest.
According to Fig. 13 and Table 3, the estimation results of hydraulic force are about 57 % larger than the CFD simulation results. The CFD simulation results of axial force are around 5 % smaller than the experimental results. And the maximum error occurs at the position of the maximum axial force, where the CFD simulation result is 7.42 % smaller than the experimental result. The axial force adds almost 30 % when using the estimation method to calculate the discharge coefficient.
6. Conclusions
Based on the study of the discharge coefficient calculation methods and their influences on the drop dynamic response of the landing gear, it comes to the conclusions as follows:
1) In this paper, the discharge coefficient theoretical and CFD simulation results are basically identical, and they are in good agreement with the experimental data. There is 17 % error between the discharge coefficient estimation results and the simulation results. It is a large error in view of the fact that the variation range of the discharge coefficient is small.
2) Discharge coefficient has an enormous influence on the hydraulic force. While the discharge coefficient varies 17 %, the hydraulic force varies 57 %.
3) The hydraulic force is an important part of the axial force, which can account for up to 60 % of the total axial force. It results in the calculation accuracy of the landing gear dynamic response being very sensitive to the discharge coefficient. The simulation results are in good agreement with the experimental results, while there is 30 % error between the estimation results and the experimental results.
References
-
Choi Y. T., Wereley N. M. Vibration control of a landing gear system featuring electrorheological /magnetorheological fluids. Journal of Aircraft, Vol. 40, Issue 3, 2003, p. 432-439.
-
Wen Z., Zhi Z., Zhu Q. Dynamic model of carrier-based aircraft landing gears landed on dynamic deck. Chinese Journal of Aeronautics, Vol. 22, Issue 4, 2009, p. 371-379.
-
Nie H. Dynamic Design and Analysis of Aircraft Landing Gear. Northwestern Polytechnical University Press, Xi’an, 2013, (in Chinese).
-
Wei X. H., Liu C. L., Nie H., Wang Y. L., et al. Study on drop dynamics and the influence of structural parameters on half-axle landing gear. Journal of Vibration Engineering, Vol. 27, Issue 1, 2014, p. 40-45.
-
Wei X. H., Nie H. Dynamic analysis of aircraft landing impact using landing-region-based model. Journal of Aircraft, Vol. 42, Issue 6, 2005, p. 1631-1637.
-
Fan R., Fang Y. Y., Han Y., et al. Landing gear dynamic simulation of aircraft landing gear with multi-struts. Journal of Vibration Engineering, Vol. 16, Issue 5, 2014, p. 2494-2507.
-
Paletta N., Dmytriv A., Belardo M., et al. Landing gear concept and dynamic landing loads of the unmanned space re-entry vehicle USV3. Proceedings of the 1st International Conference on Structural Integrity, Funchal, Portugal, 2015.
-
Wahi M. K. Oleopneumatic shock strut dynamic analysis and its real-time simulation. Journal of Aircraft, Vol. 13, Issue 4, 1971, p. 303-308.
-
Gao Z. J. Aircraft Design Manual: Take-Off and Landing System Design. Aviation Industry, Beijing, 2002, (in Chinese).
-
Canbazoğlu S., Canbulut F. A note on the flow coefficients of capillary tube and small orifice restrictors exposed to very low Reynolds number flow. Industrial Lubrication and Tribology, Vol. 57, Issue 3, 2005, p. 116-120.
-
Belforte G., Raparelli T., Viktorov V., et al. Discharge coefficients of orifice-type restrictor for aerostatic bearings. Tribology International, Vol. 40, Issue 3, 2007, p. 512-521.
-
Idris A., Pullen K. R. Correlations for the discharge coefficient of rotating orifices based on the incidence angle. Proceedings of the Institution of Mechanical Engineers Part A Journal of Power and Energy, Vol. 219, Issue 219, 2005, p. 333-352.
-
Payri R., Guardiola C., Salvador F. J., et al. Critical cavitation number determination in diesel injection nozzles. Experimental Techniques, Vol. 28, Issue 3, 2006, p. 49-52.
-
Payri F., Bermúdez V., Payri R., et al. The influence of cavitation on the internal flow and the spray characteristics in diesel injection nozzles. Fuel, Vol. 83, Issue 4, 2004, p. 419-431.
-
Huning M. Discharge coefficient measurements of round, inclined orifices with inlet cross-flow in and against direction of inclination. Proceedings of Institution of Mechanical Engineers Part C Journal of Mechanical Engineering Science, Vol. 227, Issue 227, 2013, p. 1266-1279.
-
Huang S. F., Ma T. Y., Wang D., et al. Study on discharge coefficient of perforated orifices as a new kind of flowmeter. Experimental Thermal and Fluid Science, Vol. 46, Issue 4, 2013, p. 74-83.
-
Yu B., Fu P. F., Zhang T., et al. The influence of back pressure on the flow discharge coefficients of plain orifice nozzle. International Journal of Heat and Fluid Flow, Vol. 44, Issue 4, 2013, p. 509-514.
-
Tharakan T. J., Rafeeque T. A. The role of backpressure on discharge coefficient of sharp edged injection orifices. Aerospace Science and Technology, Vol. 49, 2016, p. 269-275.
-
Mazzei L., Winchler L., Andreini A. Development of a numerical correction for the discharge coefficient of round inclined holes with low crossflow. Computers and Fluids, Vol. 152, 2017, p. 182-192.
-
Liu R. C. Aircraft Landing Gear Strength Design Guidelines. Science and Technology Press, Sichuan, 1989, (in Chinese).
About this article
This study was co-supported by the National Natural Science Foundation of China (Grant No. 11372129) and the Priority Academic Program Development of Jiangsu Higher Education Institutions.
