Abstract
The following article describes measurement data processing for detecting flat spots on wheels of railway cars. This type of defect usually causes significant impact wear of railway infrastructure that can lead to different safety problems. So, development and improvement of methods used for early detection and recognition of such defects can decrease costs of infrastructure maintenance and prevent safety accident. The proposed method is based on Fourier analysis and aimed at processing measurements received from strain gauges.
1. Introduction
Increasing the speed of railroad transport requires implementation of new methods and techniques of evaluation technical condition of rolling stock and infrastructure. One of the objects that have to be continuously monitored are wheel sets. These parts of a railway car susceptible to specific defect like pitting or flat wheels. The peculiarity of these types of defects is their random appearance on the circumference of wheels. Results of inspection also significantly relate on the qualification of quality engineer and surrounding conditions. Contemporary safety requirements and economic causes tend to develop automatic systems for wheel state monitoring during the rolling stock moving through the testing areas situated in the different parts of railroad network. Main principles of these devices based on the measurement of dynamic interaction factors between wheel sets and rails. Examples of these systems are Scalex WILD (USA), Dafur (Germany), WCM (USA), GOTCHA (Netherlands) etc. [1].
2. Description of the test area and experiment
The measurement data were obtained on a straight section of the railroad track located on the territory of the Ukrainian Railways division “Darnitsky railway car repair plant”. The testing train consisted of CHME3 shunting diesel locomotive and general-purpose gondola car. Three wheels from one side of the gondola car contained flat spots with known depth 2.5 mm, 1.0 mm, and 0.5 mm. The fourth wheel from the same side was defect free.
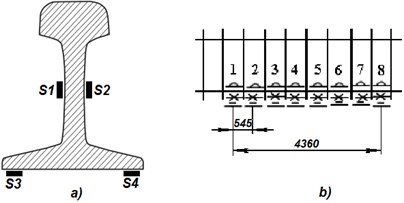
Strain gauge sensors were used for recording data of interaction process between rail and the wheels. Eight consecutive spaces between sleepers have been selected for placing eight equal sets of strain gauge sensors Fig. 1(b). Each set consists of four sensors: two of them were placed on the rail web (S1 and S2) and on the flat bottom rail (S3 and S4) Fig. 1(a).
For acquiring measurement data from the sensors NI 9237 Strain/Bridge Input Modules by National Instruments were used. All modules were installed in NI CompactRio platform based on NI cRIO 9012 real-time controller and NI cRIO 9114 chassis. The real-time controller executes special software for acquiring and saving the data from sensors. Developed system provides measurements with sampling frequency up to 400 Hz per channel.
The experiment was organized for obtaining surplus amount of measurements in various modes of interaction of the wheels and the rail. Firstly, gondola car was moved four times through test area in empty weight. The weight of the empty car was 20.5 metric tons. Secondly, the car was loaded with 58.5 metric tons of breakstone and again moved through the test area for four times. The final weight of the tested gondola car was 79.0 tons. Train speed in both cases was 10 km/h.
Fig. 1Sensor disposition on the railway section a) example of sensor group installed on the rail; b) sensor groups positioning on the test area of the rail

Fig. 2Defect depth and locations on the gondola car

Fig. 2 shows disposition and depth of the artificial defects. Wheel with no defect marked as 0 mm was the nearest to the shunting locomotive and the wheel with 1 mm defect was nearest to the end of the train. Wheels of the CHME3 were carefully tested and were defect-free at all. As mentioned before, sensors were placed on the rail web and rail foot. Because of low influences on the level of output signals from the sensors located on rail web, they were removed from the following analysis.
Fig. 3Typical signal from strain gauge sensor located on the rail foot

3. Signal analysis
Fig. 3 depicts signal obtained from one of the sensors located on the rail foot. Voltage graph reflects influences of six defect free wheels from shunting locomotive and four wheels of gondola car. Additionally, one of the wheels of testing car demonstrates defective interaction with the rail (second from the left). In case of a flawed wheel, the impact caused by the interaction of a flat spot and rail introduces damped oscillation lays over the normal signal. Fig 4 provides close demonstrates signals acquired from flawed and normal wheels.
Even from the visual time domain analysis, it’s absolutely clear that oscillations caused by flat spot have higher frequencies than the signal obtained from the defect-free wheel. Frequency spectrum representation calculated by Fast Fourier Transform confirms this hypothesis. Fig. 5 demonstrates two spectrums received from the signals depicted on fig. 4. As seen from the spectrum damped oscillation lays on frequency range more than 20 Hz.
Fig. 4Signals received from the rail foot sensor. a) defect-free wheel; b) flawed wheel

Fig. 5Frequency spectrums of received signals. a) defect-free wheel; b) flawed wheel

The next step of the signal analysis is the selection of information parameter which is sensitive to the sought defect. There are different factors are described in the literature. For example in [2] introduced methodology of flawed wheels detecting based on measurement of force influenced on the rail. The main hypothesis lies in the fact that wheels with flat spots influence on the rails with much higher forces that defect-free wheels. In thesis [3] presented approach of searching parts of the signal similar to dumped oscillation peculiar to wheels with the flat spots. Search procedures based on the calculation of correlation factor between the digitized signal from sensors and the reference pattern.
Otherwise one of the ways to detect dumped oscillation is calculating the energy of the part of the frequency spectrum:
where ai – value of the spectral coefficient, i – number of current coefficient, k number of coefficient relates to frequency used us lower border of calculating, N – total number of coefficients.
Fig. 6 demonstrates applying of introduced parameter to the output signal of one of strain gauge sensor. Calculation of this plot was carried out using sliding window of a width sufficient to represent the signal from one wheel. To reduce the influence of edge effect during the spectrum calculation Hamming window function was applied. Lower border of the factor E calculation equals to 20 Hz. As can be seen from figure current value of the introduced factor is significantly changed in the signal area relates to the influence of the wheel with the flat spot (approx. 2.6 s to 2.8 sec).
Fig. 6Signal from the sensor and level of “E” parameter

4. Statistical analysis
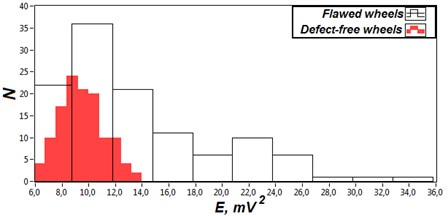
A significant characteristic of every information parameter used for diagnostic is the probability of wrong decision based on it. To evaluate the quality of the introduced factor statistical study was conducted. On the first step from all signals obtained during the experiments, the parts related to the wheel-and-rail interactions were extracted and combined in two groups marked as defected and defect-free. On the second step for every wheel proposed parameter was calculated. Distributions of calculated values presented in Fig. 7.
As can be seen from the figure above, values received from defect-free wheels have lower median and standard deviation then values received from wheels with flat spots. Also, a significant part of calculated results lays higher then maxim value of defect free-wheels which says that introduced factor can be used for diagnostic decision making.
Fig. 7Distributions of values of presented diagnostic parameter

5. Conclusions
In the conclusion, it is necessary to emphasize that the proposed parameter did not allow full statistical assurance of the diagnostic process on the basis of the available experimental data. As can be seen from the obtained distributions, the values from defective and defect-free wheels are in one area. However, even if set the threshold level slightly higher than the maximum value for a defect-free sample, the proposed parameter allows you to find a significant number of dangerous defects. This work is also an output of the internal BUT research project Reg. No. FSI-S-17-4104.
References
-
Müller R., Gratacos P., Mora P., Nielsen Jco, Feng J., Cervello S. Definition of wheel maintenance measures for reducing ground vibration. RIVAS (SCP0-GA-2010-265754): Deliverable 2.7, 2013, p. 87.
-
Kochetkov A. Development of Methodology of Wheel Tread on the Run Inspection Based on Their Dynamic Interaction with Rails: Candidate of Science Thesis: 05.11.13. Devices and Methods of Control over Environment, Substances, Materials and Products. Tomsk, 2013, p. 123, (in Russian).
-
Johansson A., Nielsen J. C. O. Out-of-round railway wheels – wheel – rail contact forces and track response derived from field tests and numerical simulations. Proceedings of the Institution of Mechanical Engineers, Part F: Journal of Rail and Rapid Transit, Vol. 217, Issue 2, 2003, p. 135-146.
