Abstract
The paper discusses the preconditions of the methodology development of diagnosis system for assessing dynamic impact of the rolling stock on the basis of processing and analysis of data obtained in operation on the results of measurement of parameters that characterize dynamic vibration processes of the mechanical system of “rolling stock-track”. On the basis of usage of the processing methods of time series and stochastic processes there has been established the relationship between these dynamic processes and wheel defects, and designed experimental data processing algorithms, which in the future will be an integral part of the intellectual systems of decision making when assessing the impact level of the rolling stock on the track.
1. Introduction
The modern systems of monitoring of the dynamic condition of vehicles intended to detect faults fundamentally use concepts and hypothesis, which are based on in-depth filtration methods and the time series analysis [1]. The practical implementation of such systems is carried out on the basis of evaluation of the dynamic behavior of both the rolling stock [2-4] and the track structure during passing of the train [5, 6].
The modern monitoring systems, which are installed on the track, were analyzed by Brickle B. etc. [7] commissioned by the Rail Safety and Standard Board (RSSB) UK and have been classified by the functional categories, where as a separate group there has been allocated the wheel impact load detectors (WILD), which detect the presence of a defective wheel by measuring the magnitude of the load (amount of force the wheel exerts to the rail) and comparing it to the specified threshold.
The instrumental basis of the monitoring systems can be optical sensors, accelerometers, load sensors or strain gauges. The available systems in market are GE Transportation’s MATTILD, DeltaRail’s Wheelchex, Teknis’ WCM and Salient System’s WILD [1]. However, according to authors [1, 7], these systems are not that reliable and in most cases the inspection of railway vehicles takes place in the depot before it leaves for operation. Such inspections are time-consuming and prone to human error. A difficulty for such systems is to determine the threshold limit values of the measured magnitude which characterizes the force the wheel exerts to the rails.
And, if the threshold limit values of stresses on the rail base are standardized [8], then there arise some difficulties concerning justification of the thresholds limit values of accelerations of the rail or the data for optical sensors under conditions of the necessity to assess different types of the rolling stock, the axle loads and the technical conditions with availability of only the output signal.
For countries with a gauge of 1520 mm, where the quality of technical maintenance and used design of the rolling stock create additional risks of occurrence of limit-exceeding impact of the rolling stock on the track, there is an acute problem of development and implementation of a new method to monitor workloads affecting the track structure during passing of freight cars. In Ukraine, the work in this direction started in 2010. It envisages creation of a method of monitoring which is based on accelerations of elements of the track structure as magnitudes that do not require creation of specific measurement conditions (as opposed to the methods of stress freezing). This article presents the results of experimental research on impacts on the track structure of freight cars with the use of the given method of monitoring.
2. Description of the experiment and testing conditions
At the moment in the countries with a gauge of 1520 mm the existing regulations for assessing dynamic influence of the new and modernized rolling stock on the track are regulated by normative documents [8] and include assessment of the stress-deformed states of the rails under influence of the rolling stock, based on the recording of the stress in the cross section elements of the rail by using strain gauges (Fig. 1(a)). The admissibility of the stress magnitudes (edge stresses) and forces arising in the rails in the vertical and horizontal directions are estimated basing on the maximal possible values for these parameters as set out in [7].
Fig. 1Scheme of sensor locations in the measuring section of the rail to assess workloads of the rolling stock on the track in accordance with [8] a) and implemented during research conduction b)
![Scheme of sensor locations in the measuring section of the rail to assess workloads of the rolling stock on the track in accordance with [8] a) and implemented during research conduction b)](https://static-01.extrica.com/articles/19044/19044-img1.jpg)
Assessment of the dynamic impact of the rolling stock on the rails using accelerometers that underlies the developed method for monitoring of work loads is complicated by absence of threshold limit values of acceleration of the rail. These magnitudes characterize the maximum permissible value of influence of the rolling stock on the rail track that provides the permissible technical condition of the track and the level of accumulation of changes in the parameters subjected to inspection, for the period between two scheduled examination during passing of the track geometry car. The proposed system is based on measuring acceleration of the rails due to the train passing the way section equipped with the sensors system [8] and other methods of the measurement [9, 10] can be used. It uses two-axle accelerometers with measuring acceleration range up to 700 m/s2 in the vertical direction and up to 350 m/s2 in the horizontal one; the error is up to 10 %. It’s made based on the chip ADXL278. The accelerometers are installed on the bases of the rails (fig. 1, b) symmetrically on both rail threads.
Comparative testing to assess the impact of the rolling stock on the rail were carried out along a straight section equipped with two measuring systems - standardized system according to DSTU 7571: 2014 (Fig. 1(a)) [8] and the proposed system (Fig. 1(b)) [11]. Experimental section had rails of type R65, ferroconcrete sleepers (1840 units/km) with stone ballast. 8 cross sections of the rails (Fig. 2) were equipped with sensors in the space between the sleepers with the distance between the cross sections of about 545 mm.
Tests involved an experimental train consisting of a locomotive of the model CHME3 and a gondola car in an empty (20.5 t) and loaded (79 t) states (Fig. 3). The gondola car had defects on the rolling surface (1 wheelset without defects, 2 wheelset with the slid flat with depth of h2= 0,5 mm, 3 wheelset with the slid flat with depth of h3= 2,5 mm 4 wheelset with the slid flat h4= 1 mm). Experimental trips were carried at a constant rate, which varied in the range of v= 10-40 km/h, with an interval of Δv= 5 km/h, 6 trips (l= 1-6) with each speed in empty and loaded states. The sampling frequency of the accelerometers and the strain gauges was 400 Hz.
The aim of the test was to compare the magnitudes of stresses in the rails during passing of the rolling stock with accelerations of the rail for establishing relationships between the fixed magnitudes, the rolling stock parameters and test conditions (the speed, the load of rolling stock, the wheel defects) and assessment of dynamic impact of the rolling stock with defective wheel sets by statistical methods.
Fig. 2Experimental section, equipped with sensors: a) scheme; b) photo

Fig. 3Experimental train: a) scheme; b) photo

3. Results of experimental research
The processing procedure of the experimental data obtained during measurement by the strain gages, was performed by statistical methods in accordance with [8], and data, obtained using accelerometers, – following the procedure described in [8]. In this case, the magnitudes of edged stresses were compared (the signal example is shown in Fig. 4(a)) and acceleration of the rails (the signal example is shown in Fig. 4(b)). The initial comparison of the signals showed clear advantages of the data processing that record edged stresses.
In the first stage of the signals processing there has been set a task to estimate the impact of the movement speed based on the magnitude of dynamic impact of the experimental train on the rail, which was assessed by the magnitude of the edge stresses of the rails according to standard procedures and magnitudes of acceleration of the rails based on the proposed methodology. For the separation of the signal S into segments associated with individual wheels in the automatic mode, there has been developed a computational algorithm. After envelope segments have been allocated for the all multidimensional signals, maximum values have been calculated for each segment, on the basis of which the statistical samples for processing are formed. Performed statistical processing includes grouping of the samples in the vertical Z and the horizontal Y, which in the result provide selection of two main groups of samples Z and Y. After checking the samples on normality, statistical indicators are calculated for them, namely, the magnitudes of expectation, standard deviation and probable maximum values maxaprZ and maxaprY [11].
Fig. 4Records of signals, fixing edged stresses a) and acceleration b) of the rails at v= 30 km/h in the vertical direction when passing of the experimental train with loaded gondola car through the third sensor

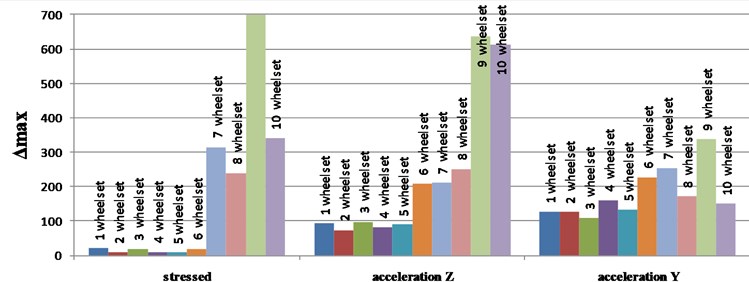
Comparison of the statistical parameters of the researched magnitudes of stresses and accelerations of the rails during passing of the testing train has showed that the speed in the range of 10 ... 40 km/h had no significant effect on the magnitudes of the statistical parameters of the rails edge stresses. In contrast to stresses, the magnitude of the rail acceleration during passing of the train is linearly dependent on the movement speed. The resulting dependences of the rails accelerations on the magnitude of the movement speed of the rolling stock is qualitatively consistent with the results of tests [11], where there was also observed a linear dependence of possible maximum acceleration values on the movement speed in the range of 40-130 km/h during passing of a two-axle locomotive CHS8. Moreover, it was found out that several times exceeding of the permissible value of the magnitude maxσ for 3rd wheel gondola car (reaches up to 790 MPa, h3= 2,5 mm) for speeds of 20-40 km/h for individual passing, which is 240 MPa for all types of the rolling stock [11]. In addition, such exceeding is observed for all the other wheels of the gondola car at individual speeds for individual passing. Considering the impact of the gondola car movement speed on the rails acceleration, there has been found increase in magnitudes of statistical characteristics for 9th (h3= 2,5 mm) and 10th (h4= 0 mm) wheel sets of the experimental train in both directions. Moreover, the range of changing of maximum possible values of edge stress of the rail maxσ and maximum possible values of the rails acceleration which arise during passing of the rolling stock maxa in a range of speeds of 10-40 km/h, presented in Fig. 5, clearly shows an abnormal magnitudes both for the rails acceleration and for edge stresses, which occur during passing of the gondola car wheel sets with wheels defects compared with the values of the same parameters arising during passing of the locomotive CHME3.
Fig. 5The range of changes maxy and maxa at v= 10 and 40 km/h for all wheel sets of the experimental train

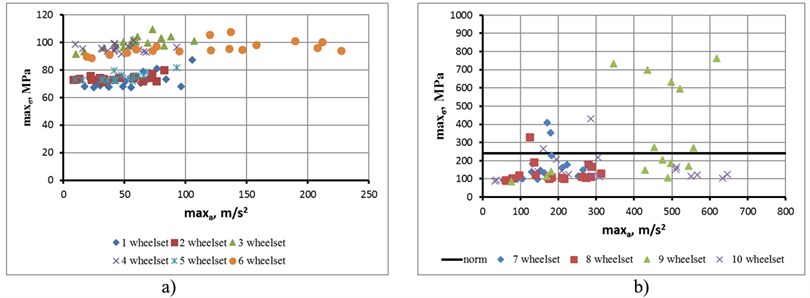
At the same time, the parameters considered in the vertical direction (Fig. 6 (acceleration Z graph)) are illustrative, which, in comparison with the horizontal direction, more clearly show increased impact of the wheel sets of the gondola car. Assessment of the dependence maxσ on the magnitude maxa (Fig. 6) in the investigated range of speeds has demonstrated abnormal magnitudes of the rails acceleration during passing of the 6th wheel set of the locomotive (Fig. 6(a)) without exceeding the permissive level of stress (240 MPa), and that the level of acceleration exceeding 330 m/s2 for 3rd and 4th wheel sets of the gondola is probably abnormal (Fig. 6(b)).
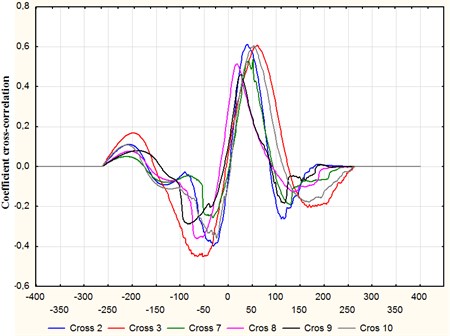
In the process of computing the results of experimental research, the problem was to estimate the correlation between the values of the rail acceleration and rail edge stresses. Some results of the determination of the mutual correlation function are shown in Fig. 7. The form of the mutual correlation function differs in vertical and horizontal directions, but it is similar for all wheels of an experimental train. The correlation coefficient in the vertical direction reaches 0.5 to 0.6 depending on the wheel set being evaluated.
Fig. 6Dependence of maxσ and maxa in the vertical direction in the tested speed range for the wheel sets of the locomotive a) and the gondola car b)

Fig. 7The mutual correlation function between the values of rail acceleration and rail edge stresses, in the vertical direction: Cross 2 – for 2nd wheel sets of locomotive, Cross 3 – for 3rd wheel sets of locomotive, Cross 7 – for 1st wheel set gondola (without defects), Cross 9 – for 2nd wheel set of gondola (with the slid flat with depth of h2= 0,5 mm), Cross 10 – for 4th wheel set of gondola (with the slid flat h4= 1 mm

4. Conclusions
The method for monitoring workloads of the existing rolling stock on the track structure is proposed. The necessary measurements are carried out on the selected track section using two-axial accelerometers installed symmetrically on the bases of the rails between the sleepers on the right and left sides of the track structure. In contrast to the method of measuring the stress and the forces, which currently being used to assess the impact of the rolling stock on the rails for the railways with a track of 1520 mm, this method does not require creation of special conditions for measurement. During passing of the train on the of test section multi-dimensional signals with a number of components equal to doubled number of accelerometers are registered. The article presents the results of the field testing of the system carried out in the track section, which was equipped with accelerometers in 8 measurement cross sections, and comparison of the results with the standard method for determining the impact of the rolling stock on the rail by identifying the stress in the rails. For experimental research there has been used experimental train consisting of the shunting locomotive CHME3 and the gondola car. The train passed through the experimental section in forward and reverse directions at speeds from 10 to 40 km/h with an in increments of 5 km/h.
Comparison of the statistical parameters of the stress of the rails and of acceleration during passing of the shunting locomotive showed that the speed in the range of 10-40 km/h had no significant effect on statistical parameters of magnitudes of edge stress of the rails both during passing of the empty gondola car and the loaded one, the maximum possible value of which varies in the range of maxσ= 66-106 MPa. In contrast to stresses, the magnitude of the rails acceleration during passing of the shunting locomotive is linearly dependent on the speed. This trend is observed in both the vertical (magnitude maxaZ reaches 227 m/s2), and the horizontal (magnitude maxaY reaches 283 m/s2) directions.
Analysis of statistical parameters of stresses of the rails and accelerations during passing of the gondola car has showed several times exceeding of the permissible value of the maxσ for all wheels of the loaded gondola car at individual speeds.
References
-
Ngigi R., Pislaru A., Crinela Bal, Fengshou G. Modern techniques for condition monitoring of railway vehicle dynamics. Journal of Physics: Conference Series, 2012.
-
Ward C., Weston P., Stewart E., Li H., Goodall R., Roberts C., Mei T., Charles G., DixonR. Condition monitoring opportunities using vehicle-based sensors. Processing Institute of Mechanical Engineering. Part F: Journal of Rail and Rapid Transit, Vol. 225, Issue 2, 2011, p. 202-218.
-
Monje P., Martinez G., Aranguren B., Casado L. Using bogie-mounted sensors to measure wheel rolling and sliding in railway tracks. Processing Institute of Mechanical Engineering. Part F: Journal of Rail and Rapid Transit, 2011.
-
Bleakely S., Senini S. Autonomous time frequency analysis of wagon body accelerations. Processing of the 5-th Asia Pacific Industrial Engineering and Management Systems Conference Gold Coast Australia, 2004.
-
Mostovych A., Cherniak A., Nozhenko O. Application of the methods of correlation and spectral analysis for processing the results of dynamic testing of railway rolling stock. Railway Transport of Ukraine, Vol. 113, Issue 4, 2015, p. 20-24.
-
Moynihan T., English G. Railway Safety Technologies. Canada Research and Traffic Group, 2007.
-
Brickle B., Morgan R., Smith E., Brosseau J., Pinney C. Identification of Existing and New Technologies for Wheelset Condition Monitoring: Report for Task T607. TTCI Ltd UK RSSB, 2008.
-
The Norms of Permissible Impact on Railway Track 1520 mm. DSTU 7571:2014 Rolling railways.
-
Tůma J. Vehicle Gearbox Noise and Vibration: Measurement, Signal Analysis, Signal Processing and Noise Reduction Measures. John Wiley, Chichester, 2014.
-
Porteš P., Kučera P., Píštěk V., Fojtášek J., Zháňal L. Modern tools for vehicle development. Engineering Mechanics, 2017, p. 54-57.
-
Chernyak G., Gerlici J., Nozhenko O., Domin R., Kravchenko K., Lack T. The experimental research of the dynamic loading of the railway track. Experimental and Computational Methods in Engineering, 2016.
About this article
The research was held within the framework of National Scholarship Program of the Slovak Republic for the support of mobility of students, Ph.D. students, university teachers, researchers and artists and on the basis of the scientific research “Development of the scientific principles of diagnostics of mechanical transport systems on the basis of the analysis of dynamic oscillation processes of their elements”, funded by the Ministry of Education and Science of Ukraine. This work is also an output of the internal BUT research Project Reg. No. FSI-S-17-4104.

