Abstract
This paper shows initial dynamic test results to determine the dynamic behavior (natural frequencies and mode-shapes) of a biaxial voided flat slab to verify a FEM model. The field measurements were done at a residential building in Bratislava. The numerical model of slab was made in the FEM code. The natural frequencies and mode-shapes of slabs obtained by experimental and numerical analysis were compared.
1. Introduction
Non-destructive testing (NDT) techniques are getting ahead because of its usefulness to provide a qualitative assessment of the structural health. Many research teams devoted their studies to an experimental modal analysis of civil engineering structures [1] and especially slabs [2-4]. Results of the analysis are used for several reasons, e.g. verifying theoretical models, damage detection, material properties under dynamic loading, etc.
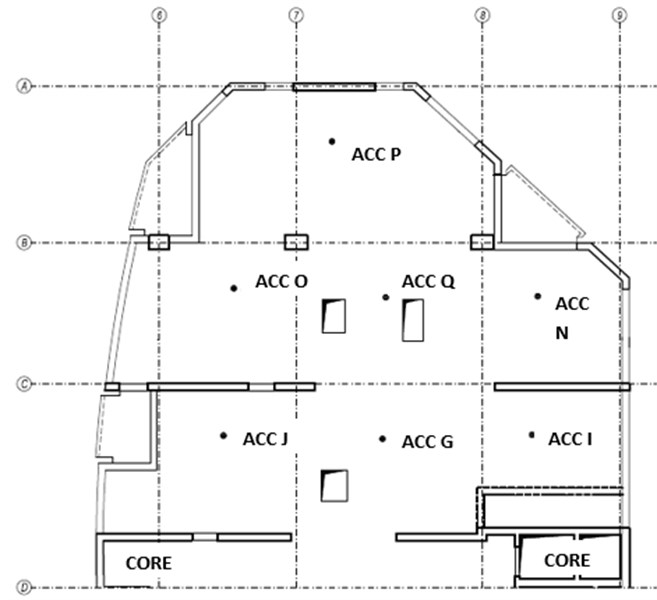
A 23-storey residential building is located in the wider downtown of Bratislava. The first 9 floors of the structure consisted of biaxial voided reinforced concrete slabs, which were concreted in 2006. Slabs from the 10th floor were solid reinforced concrete slabs. The measurement was carried out on the 8th floor slab, i.e. on the penultimate voided slab, in order to gain experimental results for verifying a FEM model. The measurement was performed only on the part of the floor slab. As this part of the floor plan was chosen because it was separated from the rest of the structure by the massive walls of the building core Fig. 1.
For an excitation of the investigated structure can be used artificial exciters [5] (electrodynamic, electrohydraulic), or human action (heel drop test, walking test, etc.). The heel drop impact test was used as the method to excite the voided slab. The standard heel drop impact [6] is defined as the loading caused by approximately 86 kg person, who stands on the balls of his feet with the heels approximately 63 mm above the floor. The person suddenly relaxes and lets his heels fall to the floor, which results in an impact.
The paper consists of several sections. Section 2 introduces a preparation of the FEM model; Section 3 deals with the experimental tests; Section 4 is devoted to the analysis of results; the main conclusions are presented in Section 5.
2. Numerical model
Before performing an experimental measurement, a numerical model was created. The model was created based on plan views of the building in a FEM code. The slab was biaxial voided by polystyrene prisms placed between upper and lower reinforcement. Numerical model of the slab was made by shell elements as a solid slab with reduced material properties and beam elements as eccentric stiffeners. The stiffness and self-weight of the model were reduced.
After preparation of the model, mode-shapes have been analyzed, so that we could best define the best locations for the accelerometers. Subsequently, small metal plates firmly glued to the structure by epoxy two-component adhesive. Magnets were used for mounting of accelerometers.
3. Experimental tests
A National Instruments (NI) CompactRIO 9074 device with 2 Input/ Output (I/O) NI 9234 modules was used for the high-accuracy measurements of the accelerations and they are analogue to digital Delta-sigma converters. The two I/O modules represented the possibility of measuring up to 8 channels. The measurement equipment (a combination of the NI 9234 I/O modules with the PCB Piezotronics 393B31 accelerometers) permitted measuring frequencies above the value of 0.5 Hz at intervals of acceleration between the limits ±4.9 ms-2. Accelerometers were placed at 7 points (Fig. 1) in accordance with [7, 8].
Several measurements with length of 40 seconds were acquired. The used data rate was 2048 samples per second. The monitored slab was excited by the heel drop test. The standard heel drop test was partially changed. The person’s weight was approximately 100 kg.
Fig. 1Plan view of the slab and schematic layout of accelerometers (ACC)
4. Analysis of results
The best excited slab measurement was chosen and further analyzed. A response spectrum was created in the NI LabVIEW software from the record. The four natural frequencies of the slab are visible on Fig. 2 and comparable with the numerical analyses. The frequencies are clearly separated.
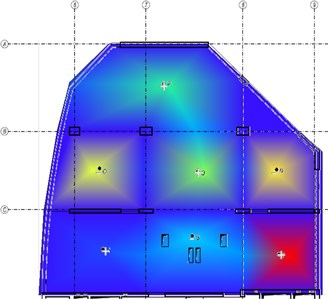
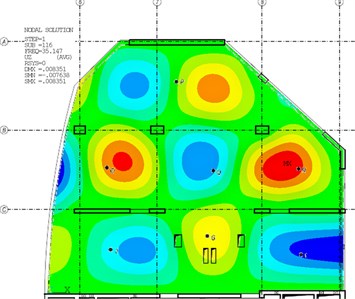
The following figures (Fig. 3-6) compare the mode-shapes of the biaxial voided slab for the first four frequencies. The results of the experimental measurement gave very good agreement, both in their mode-shapes and at the frequencies, with differences in frequencies being less than 1 Hz.
Fig. 2Response spectrum of the slab (investigated frequencies)
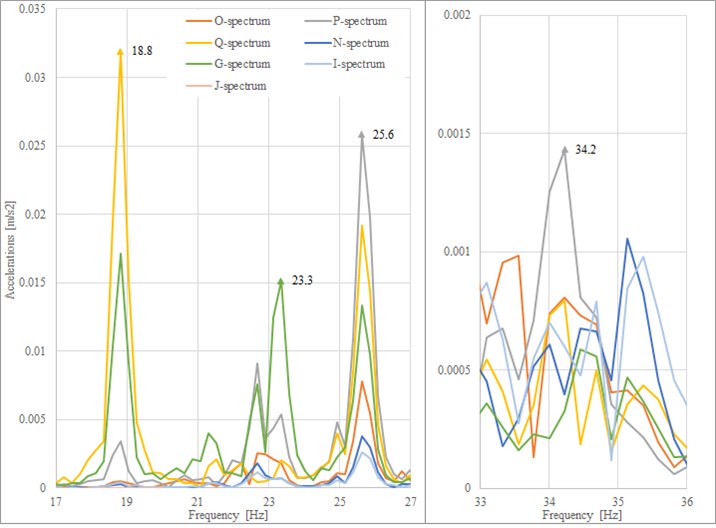
Fig. 3The first mode-shape from the experiment and the numerical model
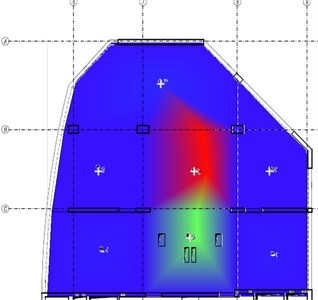
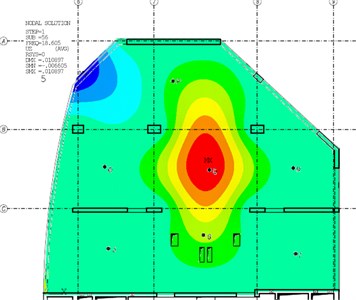
Fig. 4The second mode-shape from the experiment and the numerical model
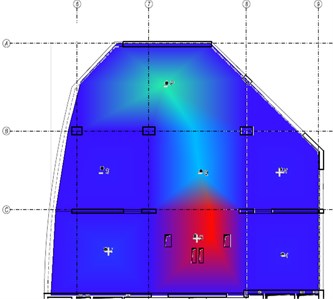
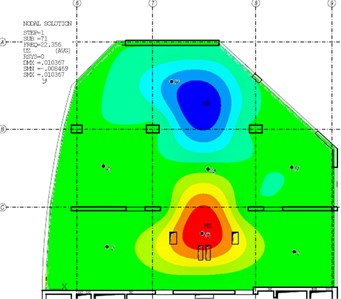
Fig. 5The third mode-shape from the experiment and the numerical model
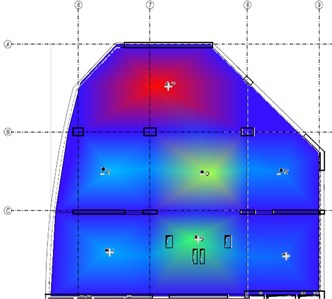
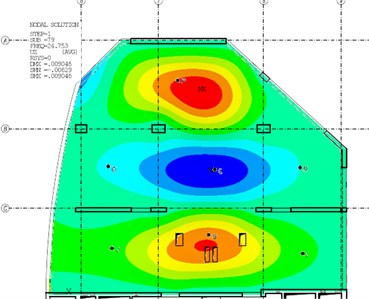
Fig. 6The fourth mode-shape from the experiment and the numerical model
5. Conclusions
Comparison of the mode-shapes obtained from experimental measurements using ModalVIEW software and mode-shapes calculated by the FEM code showed a very good agreement. Differences between the values of natural frequencies has been minimized (Table 1). The maximum difference between the values of the numerical model compared to the experimental measurements was 3.9 % for the second natural frequency, in the first natural frequency the difference was only 1.1 %. Obtained differences may be caused by more reasons, e.g. non-uniform mass distribution or by neglecting variable load into the total mass.
Table 1The comparison of natural frequencies
Mode-shape | Experiment [Hz] | ANSYS [Hz] | Comparison [%] |
1st | 18.8 | 18.6 | 1.1 |
2nd | 23.3 | 22.4 | 3.9 |
3th | 25.6 | 24.8 | 3.1 |
4th | 34.2 | 35.1 | -2.6 |
The good agreement in four natural frequencies and mode-shapes has shown that experimental measurements were prepared properly. The presented results have shown that mode-shapes and their appropriate natural frequencies are well-separated. It has also appeared that connections between the slab and walls or other structural elements did not perform important role and the 2D numerical model with uniform distributed mass was suitable.
References
-
Russo S. Using experimental dynamic modal analysis in assessing structural integrity in historic buildings. The Open Construction and Building Technology Journal, Vol. 8, 2014, p. 357-368.
-
Hashim H., Ibrahim Z., Razak H. A. Dynamic characteristics and model updating of damaged slab from ambient vibration measurements. Measurement, Vol. 46, Issue 4, 2013, p. 1371-1378.
-
Xia Y., et al. Long term vibration monitoring of an RC slab: temperature and humidity effect. Engineering Structures, Vol. 28, Issue 3, 2009, p. 441-452.
-
Nguyen T., et al. Evaluation of footfall induced vibration in building floor. Australian Earthquake Engineering Society Annual Conference, 2011, p. 1-8.
-
Thorby D. Structural Dynamics and Vibration in Practice: an Engineering Handbook. Butterworth-Heinemann, Amsterdam, 2008.
-
Blakeborough A., Williams M. S. Measurement of floor vibrations using a heel drop test. Proceedings of the Institution of Civil Engineers-Structures and Buildings, Vol. 156, Issue 4, 2003, p. 367-371.
-
Wilson J. S. Sensor Technology Handbook. Elsevier/Newnes, MA, USA, 2005.
-
Wilson J. S., et al. Test and Measurement: Know It All. Elsevier/Newnes, MA, USA, 2009.
About this article
This paper was supported by the Slovak Research and Development Agency (SRDA), i.e. a Grant from Research Program No. APVV-0236-12. It was also supported by Grant VEGA No. 1/0544/15.

