Abstract
Vibration signal of gearbox systems carries the important dynamic information for fault diagnosis. However, vibration signals always show non stationary behavior and overwhelmed by a large amount of noise make this task challenging in many cases. Thus, a new fault diagnosis method combining the Hilbert empirical wavelet transform (HEWT), the singular value decomposition (SVD) and Elman neural network is proposed in this paper. Vibration signals of normal gear, gear with tooth root crack, gear with chipped tooth in width, gear with chipped tooth in length, gear with missing tooth and gear with general surface wear are collected in different speed and load conditions. HEWT, a new self-adaptive time-frequency analysis, was applied to the vibration signals to obtain the instantaneous amplitude matrices. Singular value vectors, as the fault feature vectors were then acquired by applying the SVD. Last, the Elman neural network was used for automatic gearbox fault identification and classification. Through experimental results, it was concluded that the proposed method can accurately extract and classify the gear fault features under variable conditions. Moreover, the performance of the proposed HEWT-SVD method has an advantage over that of Hilbert-Huang transform (HHT)-SVD, local mean decomposition (LMD)-SVD or wavelet packet transform (WPT)-PCA for feature extraction.
1. Introduction
Gears, an important and most frequently encountered components in rotating machinery, whose operation condition directly affects the whole performance of the entire system. An unexpected fault of gear may cause huge economic losses, even personal injury if not detected in time [1]. According to statistics, 80 % of transmission machinery failure was caused by the gear, and gear failure was about 10 % of rotating machinery failure. Thus, a robust monitoring system is needed to detect earlier any malfunctions.
The vibration signals acquired during the operation of a gear carry the important dynamic information of the machine: the fault features of a gear can, therefore, be obtained from the analysis of such vibration signals. [2, 3]. Generally, gearbox diagnosis includes two main steps: feature extraction and fault classification. Feature extraction is the most challenging task. If the feature extraction is incorrect or incomplete, it will inevitably lead to erroneous classification and false positives. Furthermore, the gear fault signatures are known to be weak and often covered by the nature frequency of the machine and overwhelmed by noise with obvious non-linear and non-stationary behavior [4]. Thus, how to efficiently obtain the vital features that robustly indicate the presence of faults from the complex dynamic mechanical signals is the key to solve the problem.
The main feature extraction methods including: Time-domain, frequency-domain and time-frequency domain methods. Time-domain methods are focused on extracting statistical features of the time waveform to determine transient phenomena originate from faulty gearbox [5, 6]. Time synchronous average (TVA) has been widely used to extract the time waveform from the vibration signal synchronous with the shaft rate of rotation. Removing the harmonic families of the gearmesh components, the residual signal waveform which contains the fault feature signatures could be used for fault diagnosis. Frequency-domain methods include Fourier spectra, cepstrum analysis, and envelope spectra technique [7, 8].
Conventional methods show their limits when applied to vibration signals that are non-stationary and that have low energy of weak signals generated by faults. To deal with this problem, time-frequency (TF) analysis techniques have been developed. Among them, there is the short time Fourier transform (STFT), this technique has been widely used in rotating machinery fault diagnosis [9]. To overcome the limitation of STFT related to the Heisenberg uncertainty principle, the Wigner-Ville distribution has been widely used. Choy et al. [10] have shown the capacity of WVD in analyzing the effects of surface pitting and wear on the vibrations of a gear transmission system. Thereafter, several studies have exploit the technique like the work done by [11].
In the last few years, the wavelet transform (WT) has drawn a lot attention and it could overcome the classical TF tools [12]. The WT is a multi-resolution analysis has the advantage for characterizing signals at different localization levels in both time and frequency domains. The WPT is an advanced version of the WT which provides a complete level by level TF decomposition of signal. It may not only supply richer information but also supply more promise frequency localization information. However, the WPT is not self-adaptive, it has prescribed dyadic subdivision in time and frequency which may leads to severe damage in identifying transient vibration features that lie in transient areas of dyadic packets [13, 14].
Huang et al. [15], have proposed a self-adaptive TF analysis called HHT, it can overcome the problem of the prescribed dyadic subdivision in WT and WPT. In [16], Peng Z. K. et al. compared the HHT and WT, and then verified that the HHT has better resolution and computational efficiency in time-frequency domain. EMD and Hilbert spectrum were used to diagnose rotating machines faults [17, 18]. Several adaptive methods based on EMD have been developed such as the LMD [19], intrinsic time-scale decomposition (ITD) [20]. These methods however, all have the same drawbacks, like the mode mixing, distorted components and the end effects phenomena. Recently, Daubechies et al. [21] proposed a wavelet based time-frequency reallocation method called Synchrosqueezed wavelet transform. This method was successfully applied in gear fault diagnosis [22].
In recent years, Gilles, [23] developed the empirical wavelet transform (EWT) [24, 25]. The uniqueness of this method is in building an adaptive wavelet filter bank capable of extracting amplitude modulated-frequency modulated (AM-FM) components of a signal. It is demonstrated to be superior to EMD [23]. Merainani et al. [26], proposed the Hilbert empirical wavelet transform (HEWT) and did a comparison with HHT. The technique has shown a good results in gear tooth crack, tooth pitting and rolling bearing diagnosis [26-28]. This combination leads to self-organizing TF plane which is very beneficial for fault feature extraction. Consequently, the HEWT is used in this research. Nevertheless, the instantaneous amplitude signals of HEWT are always complex and too large, thus, in order to enhance the robustness of the classification both principal component analysis (PCA) and SVD can be employed for dimensionality reduction. Moreover, the singular values have great stability, so that they change little when the matrix elements change. Hence, the HEWT together with SVD is proposed for gear fault feature extraction.
Using solely advanced signal processing techniques for fault diagnosis require a great deal of expertise to apply them successfully. Techniques are required that can automatically make decisions on the health of running machines. After extracting the feature vectors, intelligent classification techniques can be used to identify the fault modes. These include the Elman neural network [29]. In this study, Elman neural network is employed for automatic gearbox identification and classification.
This paper is organized as follows: Section 2 introduces the HEWT-SVD. Section 3, describes the experimental setup and experimental results. Conclusion is offered in Section 4.
2. Brief theory review
2.1. Time-frequency signal decomposition based on HEWT
The HEWT is a merger of the empirical wavelet transform and Hilbert transform [26]. The EWT is used to extract adaptive modes from the vibration signal. Then, the instantaneous amplitude and frequency are performed for each mode using HT.
2.1.1. Empirical wavelet transform
The idea of EWT is to construct a set of N wavelet filters (one Low pass and (N-1) band pass filters) capable of extracting Amplitude Modulated-Frequency Modulated components that is AM-FM components (modes) fk(t) of an input signal f(t) by adaption from the processed signal [23] such as:
For the adaptation process, the wavelet filter bank is based on the Fourier supports detected from the information contained in the processed signal spectrum by finding the local maxima then taking support boundaries ωi as the middle between successive maxima [23].
As it shown in Fig. 1, the Fourier support [0, π] is partitioned into N contiguous segments. Each segment is denoted as Λn=[ωn-1,ωn], thus ⋃Nn=1Λn=[0,π]. Centered around each ωn, there is transient phase Tn with width 2τn.
The empirical wavelets are defined as band pass filters on each Λn and based on Λn a wavelet tight frame can be defined. Hence, inspired by the Meyer’s and Littlewood-Paley wavelets, a wavelet tight frame B={{ϕn(t)}N-1n=1,{ψn(t)}N-1n=1} is defined. And for arbitrary n> 0, their Fourier transforms, i.e. the empirical scaling function ˆϕn(ω) and the empirical wavelets ˆψn(ω) are given by the expressions of (Eqs. (2) and 3), respectively:
The function β(x) is given as follows:
Note that the most used function that satisfies this property is:
Fig. 1Fourier axis segmentation and EWT wavelets construction

Once the tight frame set of empirical wavelets is built, the definition of EWT, Wεf(n,t) can be defined in the same way as the classical wavelet transform. The detail coefficients are obtained by the inner products of the input signal with the empirical wavelets [23]:
The approximation coefficients are obtained by the inner product with the scaling function:
So, the signal is decomposed into various empirical modes fk, which is given by:
The EWT is invertible and the signal can be reconstructed as follows:
As the initial goal of the EWT is to get a decomposition as depicted in Eq. (1). Comparing the Eq. (1) with (11), we can deduce that each mode fk in Eq. (1) corresponds to Eqs. (9) and (10).
2.1.2. Hilbert transform
Hilbert Transform can be seen like a convolution of signal with 1/πt.
For every extracted mode f(t), the analytical signal z(t) associated with f(t) is given by:
where: ˜f(t) is the Hilbert Transform of f(t), defined as:
Thus, the instantaneous amplitude and frequency are Eqs. (14) and (15) respectively:
The instantaneous amplitude of each mode is considered as its envelope signal. It’s a time varying signal that gives beneficial information on investigating intrinsic characteristics of the signal. For this raison, the envelope signal A(t) is computed to support our analysis. However, the envelope signals still too large and complex to be taken as the fault features. Thus, we further propose the use of SVD for dimension reduction to improve the robustness of the fault features.
2.2. Singular value decomposition on the HEWT
The singular value decomposition is a matrix transformation algorithm that decomposes any given matrix M (m×n) into three matrices U, Σ and V as follows:
where U (m×m) and V (n×n) are orthogonal matrices and Σ is an (m×n) diagonal matrix of singular values, σ1≥σ2⋯≥σn. The matrix Σ is represented as:
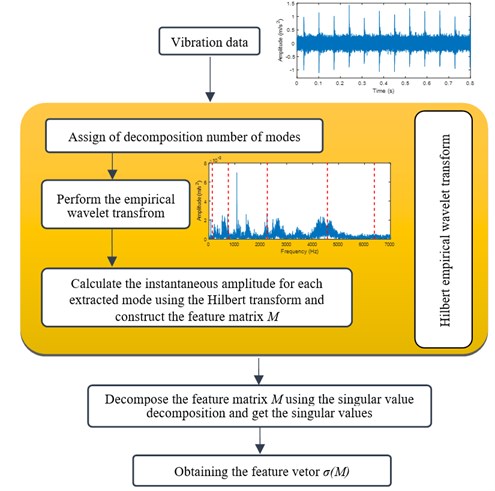
Fig. 2Feature extraction process using the proposed approach
The columns of the orthogonal matrix U are called the left singular vectors and the columns of the matrix V are called the right singular vectors of the matrix M. An important property of U and V is that they are mutually orthogonal [30].
As seen in Fig. 2, after decomposing the signal using EWT, the analytical signal of each extracted mode is obtained using HT (see Eq. (12)). Subsequently, the instantaneous amplitude Ai(t) (i=1,…, n) is obtained using Eq. (14). The feature matrix M is therefore constructed from the instantaneous amplitude Ai(t), and the fault feature vector (σ(M)=[σ1,σ2,…,σn]) by applying the SVD.
The use of SVD presents its own advantages. It is able to expresses the feature matrix M in the form of several values (singular values), so it is endowed a dimension reduction strategy. Furthermore, the singular values have a good stability. In other words, when the feature matrix element changes, a large variance of its singular values does not occur.
2.3. Elman neural network
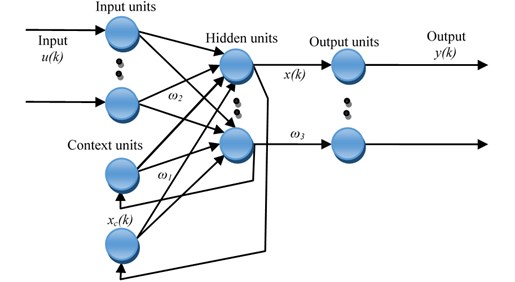
The Elman neural network is generally divided into four layers, including input layer, hidden layer, association layer and output layer. The basic structure of the network is seen in Fig. 3. The association between context layer and hidden layer, makes the neural networks sensitive to the history of input data. The context neurons can be treated as the memory units, so, this internal feedback improves significantly the capacity of the network to deal with dynamic information, overcoming the drawback of the feed-forward network. To this end, the Elman neural network compared with other neural networks, is robust in fault classification.
The transfer function of hidden layer is a non linear function, which is generally using a Sigmoid function. The activation function of the output layer neuron is a linear function. The mathematical model of Elman neural network is analyzed as follows:
where y, x, u, xc are separately representing the output vector of the network, the output vector of the hidden layer, input vector of the network and the feedback state vector. Then ω3, ω2, ω1 are separately representing connection weight matrix from the hidden layer to the output layer, from the input layer to the hidden layer and from the context layer to the hidden layer. f(⋅) is the transfer function of the hidden layer and g(⋅) denotes the activity function of the output neurons.
Fig. 3Structure of Elman neural network
3. Experimental result and discussion
In order to test the effectiveness of the proposed method, experiments were conducted on the dataset provided by the laboratory of contact and structure mechanics at INSA Lyon, France [25]. Experiments of the proposed method and detailed comparison with another widely used methods HHT-SVD, LMD-SVD and WPT together with PCA is also conducted as follows.
3.1. Experimental system description
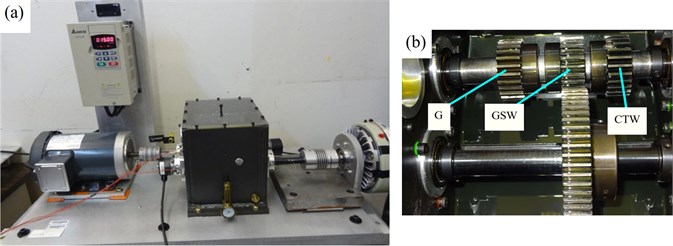
Gear vibration testing experimental apparatus is shown in Fig. 4. The rotation motion of the equipment is generated by an electric dc-motor controlled in rotational speed with a nominal speed of 3600 RPM. Torque will be transmitted to the gearbox through the coupling where several pinion fault configurations were assembled. After the reducer outputting, through gear coupling, the torque will be transferred to a magnetic powder brake capable of generating different resistive torques [31].
Fig. 4a) Experimental gearbox test rig, b) structure of the single stage gear in the gearbox
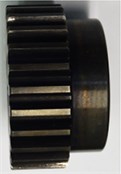
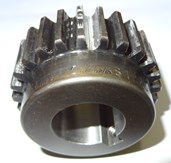
In order to verify the effectiveness of the proposed method, six pinions with different fault states were considered. The first one is referred as Good (G), whereas the others have several different types of faults: a Tooth Root Crack (TRC), a Chipped Tooth in Length (CTL), a Chipped Tooth in Width (CTW), a Missing Tooth (MT) and General Surface Wear (GSW) as shown in Fig. 5. Three pinions are simultaneously mounted on the input shaft of the gearbox, the engagement of each of them is done by a simple axial movement of the wheel on the output shaft (Fig. 3(b)). To record vibration signals, two accelerometers with a sensitivity 100 mV/g was mounted radially, one vertically and the other horizontally on the bearing case of the output shaft. The time sampling frequency of the accelerometer channels is 125 kHz. The cut-off frequency of the anti-aliasing filter is 27 kHz. The acquisition duration is 30 s.
Fig. 5Six pinion states: a) normal, b) tooth root crack, c) chipped tooth in length, d) chipped tooth in width, e) missing tooth, f) general surface wear
a)
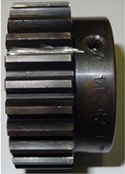
b)
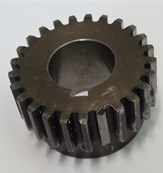
c)
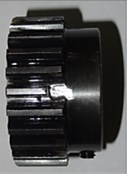
d)
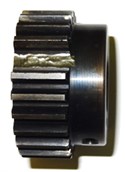
e)
f)
The accelerometer signals have been recorded for four different operating modes: under the state of loading 8 N.m: 900 RPM, under the state of loading 11 N.m: 900 RPM, under the state of loading 5 N.m: 1200 RPM, under the state of loading 8 N.m: 1200 RPM.
Fig. 6 shows the acceleration vibration signals collected from pinions with different fault modes for an operating speed 1200 RPM and under the state of loading 5 N.m.
It can be seen that the TRC and the CTL faults (Fig. 6(b, d) respectively) do not significantly affect the vibration signal. On the other hand, a significant increase in the time signal energy is caused by the CTW, MT and GSW faults (Fig. 6(c, e, f) respectively) and as for localized defects, the presence of a repetitive shock waves at every revolution period. Similar observations were noted from the vibration signals of the other operating speed and load conditions.
Fig. 6Pinion vibration signals of gearbox with different faults: a) G, b) TRC, c) CTL, d) CTW, e) MT, f) GSW
3.2. Comparison between the proposed HEWT-SVD method with HHT-SVD, LMD-SVD and WPT in tandem with PCA for feature extraction
To verify the robustness of the proposed method, three widely used methods, HHT-SVD [32], LMD-SVD and WPT together with PCA are also implemented and their performances are compared with that of HEWT-SVD for gear feature extraction under variable conditions.
In four different operating modes, vibration signals of a normal gearbox and five kinds of pinion faults are divided into 15 groups of data. Thus, for each operating mode, we end up with 90 samples.
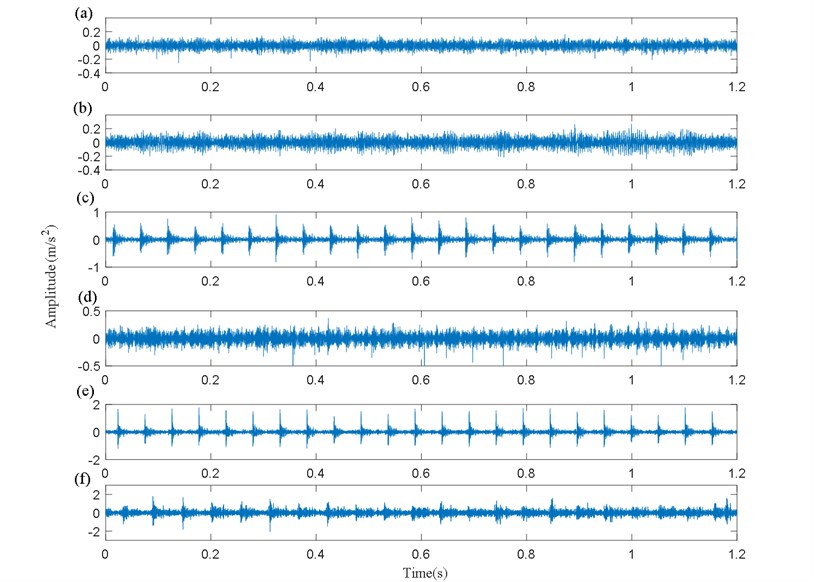
Since the experiment data we used are collected from test bench in laboratory setup, the vibration signals, therefore, present a low noise level, while in real word application, tremendous noise level may corrupt the vibration signals. Thus, strong background Gaussian white noises (GWN) with SNR of 0.5 dB was added to the vibration signals as seen in Fig. 7.
To begin with, we first analyze the various signals shown in Fig. 7 by the HEWT method. An example of the HEWT application for one certain fault and operating modes (gearbox with tooth root crack fault under the operating speed 1200 RPM and 5 N.m of load) is shown in Fig. 8, from which we can display the Fourier spectrum segmentation, the extracted modes and their envelopes.
It can be seen in Fig. 8(a), that the whole spectrum is adaptively divided into six regions. Consequently, six different modes are obtained in total. The analytical signal, thereafter, was computed for each mode by HT. The feature matrix can therefore be constructed for fault identification. Finally, the singular value vector which is the fault feature vector can be obtained by conducting SVD.
Fig. 7Vibration signals of gearbox with different faults corrupted with GWN of SNR = 0.5 dB: a) G, b) TRC, c) CTL, d) CTW, e) MT, f) GSW
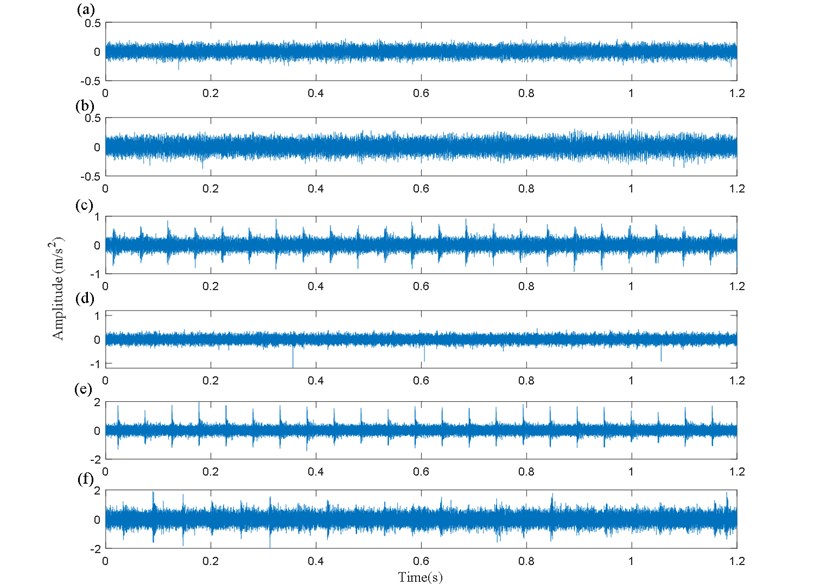
Fig. 8HEWT results: a) Fourier spectrum segmentation, b) the extracted modes, c) envelopes of modes
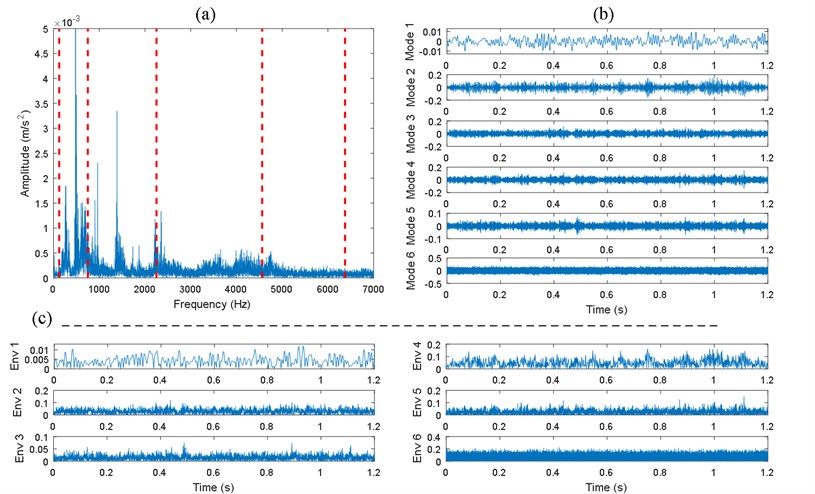
Table 1, partly gives the fault feature values obtained by HEWT-SVD for an operating speed 1200 RPM and under the state of loading 5 N.m, each vector contains the first three singular values.
To make a comparison between the proposed method with HHT-SVD, LMD-SVD and WPT-PCA, they are all implemented on the same data sets.
The EMD (resp. LMD) decomposes the vibration signals into a set of IMFs (resp. product functions (PFs)). As their number is defined by the characteristic and complexity of the analyzed signal, only the first 6 IMFs (resp. PFs) were taken. To perform the HHT, the IMFs are used to get the analytical signal using HT. Next, the feature matrix was constructed and the fault feature vectors were obtained using SVD.
When using WPT-PCA, the signals are decomposed by four layers sym1 wavelet packet decomposition, and signal energy of 16 frequency bands are obtained. Subsequently, PCA is used to extract principal components from the wavelet packet energy feature for dimensionality reduction.
Table 1Fault feature values obtained by HEWT-SVD for an operating speed 1200 RPM and under the state of loading 5 N.m
Condition | Fault feature values | |||||||
1 | 2 | 3 | 4 | 5 | 6 | 7 | 8 | |
Normal | 22.3618 | 22.5440 | 22.4297 | 22.8140 | 22.3895 | 22.2406 | 22.3029 | 22.4069 |
6.5069 | 6.6871 | 6.5681 | 6.7349 | 6.5326 | 6.4637 | 6.4964 | 6.5661 | |
5.1798 | 5.2598 | 4.9472 | 5.5414 | 4.8536 | 5.0332 | 4.8663 | 5.3470 | |
Tooth root crack | 30.5701 | 32.2918 | 31.7623 | 32.1969 | 31.9797 | 30.9457 | 30.9196 | 32.5190 |
9.3210 | 10.0070 | 9.7765 | 9.8322 | 9.8691 | 9.3443 | 9.3615 | 10.0657 | |
6.1924 | 6.5807 | 6.4116 | 6.4888 | 6.6530 | 6.3118 | 6.2887 | 6.7280 | |
Chipped tooth in length | 51.0280 | 51.5032 | 50.1618 | 50.9716 | 51.2508 | 51.2586 | 51.4757 | 53.2674 |
19.5267 | 19.5201 | 19.2042 | 19.4590 | 19.3184 | 19.2715 | 19.4209 | 20.0547 | |
9.5368 | 10.2388 | 9.7723 | 9.9054 | 9.8470 | 10.0134 | 9.9200 | 10.5689 | |
Chipped tooth in width | 40.2331 | 40.5439 | 40.1559 | 40.3599 | 40.5140 | 40.1301 | 40.2482 | 39.6597 |
12.7980 | 12.9040 | 13.0148 | 12.7087 | 13.1321 | 12.6266 | 12.7598 | 12.6037 | |
8.7177 | 8.8491 | 8.7624 | 8.5900 | 8.7750 | 8.6759 | 8.4879 | 8.5784 | |
Missing tooth | 78.4453 | 78.5593 | 78.1124 | 79.9563 | 79.1634 | 79.0539 | 79.2209 | 78.9756 |
31.3720 | 31.3594 | 31.0467 | 32.1410 | 32.0537 | 32.1315 | 32.1755 | 31.9143 | |
19.2667 | 20.5065 | 19.5896 | 20.3227 | 20.5552 | 19.7883 | 19.1645 | 20.4280 | |
General surface wear | 120.6759 | 121.2908 | 123.6672 | 124.6340 | 124.3797 | 124.1565 | 125.1376 | 124.1526 |
37.4148 | 37.5389 | 38.2903 | 38.7183 | 38.0071 | 38.0113 | 39.3841 | 38.7904 | |
24.4425 | 26.3756 | 27.3797 | 27.3329 | 27.5331 | 26.9715 | 27.4802 | 27.0742 | |
Fig. 9 shows the projections of the first three singular values obtained by HEWT-SVD of the normal gearbox and five kinds of pinion faults in four different operating modes in the three-dimensional plan view, the classification results for different faults of the gearbox can be seen from the figures. Obviously, for one certain fault mode and whatever the operating mode, the singular values extracted by HEWT-SVD have a high degree of coincidence. In the same context, comparing the singular value clusters of the normal gearbox with the five fault modes for different operating modes shown in Figs. 9(a-d), one can see that, even though the signals are noisy, the mode separability is satisfactory, thus a good classification and it looks better for the operating speed 1200 RPM and under the state of loading 5 N.m shown in Fig. 9(c).
The results obtained by HHT-SVD for the operating speed 900 RPM and under the state of loading 8 and 11 N.m respectively shown in Fig. 10(a and b) and those obtained by LMD-SVD for the operating speed 1200 RPM and under the state of loading 5 respectively shown in Fig. 11(c) are almost comparable to the results obtained by HEWT-SVD shown in Fig. 9. A noticeable separability between faults and a good coincidence of the singular value vectors. However, under the remaining operating modes, the classification effect is worst between normal gear and gear with TRC and between gears with CTW and CTL as shown in Figs. 10(c, d) and Figs. 11(a, d) and between normal gear and gear with CTW as shown in Fig. 11(b) from which, the clustering gap is very small or even inexistent that may lead to the misclassification.
Fig. 9Scatter plots of the first three singular values obtained by HEWT-SVD for different faults: a) load 8 N.m, speed 900 RPM, b) Load 11 N.m, speed 900 RPM, c) Load 5 N.m, speed 1200 RPM, d) Load 8 N.m, speed 1200 RPM
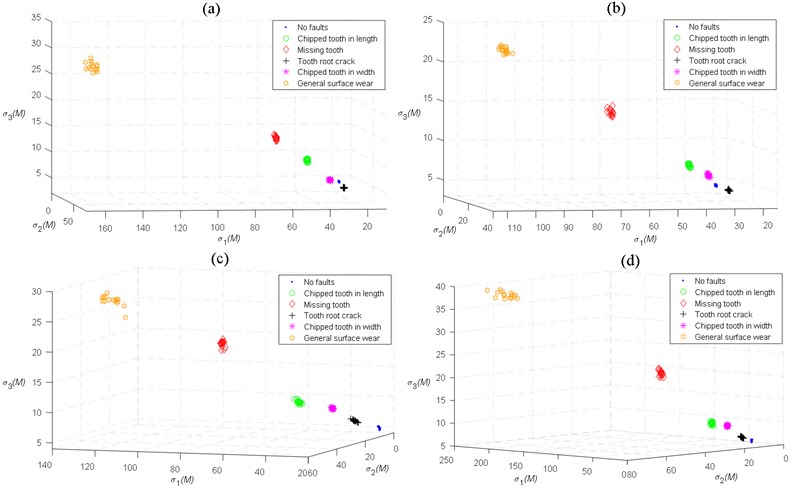
Fig. 10Scatter plots of the first three singular values obtained by HHT-SVD for different faults: a) load 8 N.m, speed 900 RPM, b) load 11 N.m, speed 900 RPM, c) load 5 N.m, speed 1200 RPM, d) load 8 N.m, speed 1200 RPM
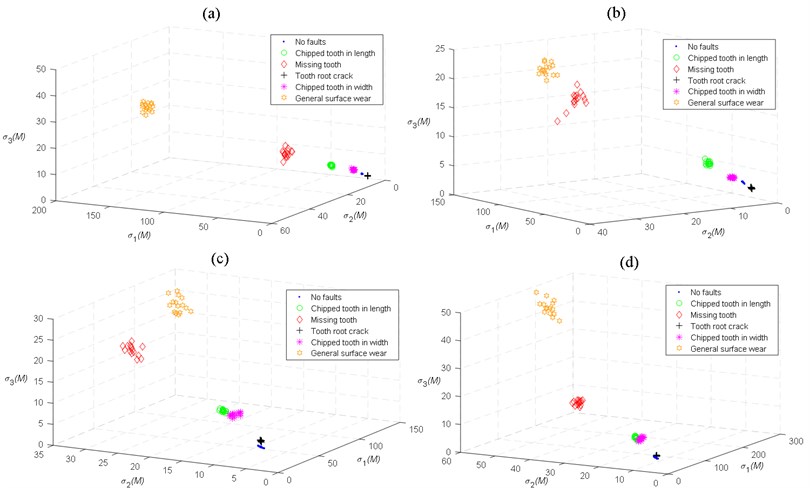
Fig. 11Scatter plots of the first three singular values obtained by LMD-SVD for different faults: a) load 8 N.m, speed 900 RPM, b) load 11 N.m, speed 900 RPM, c) load 5 N.m, speed 1200 RPM, d) load 8 N.m, speed 1200 RPM
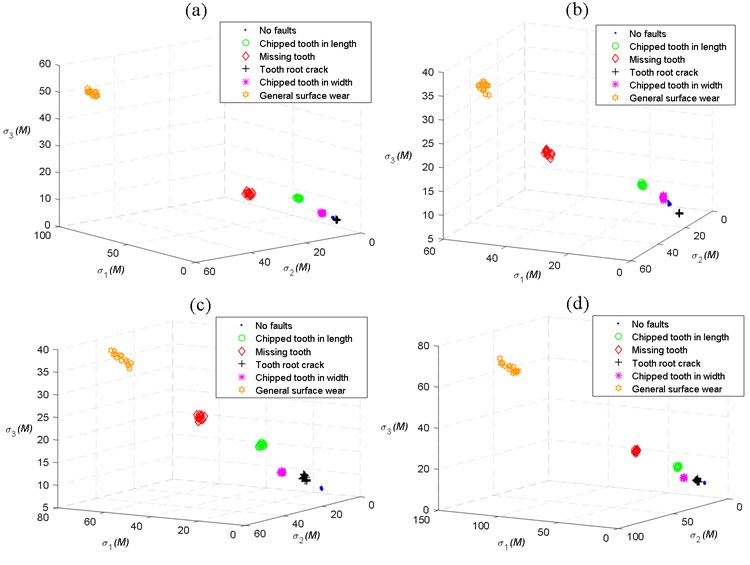
Fig. 12Scatter plots of the first three principal components obtained by WPT-PCA for different faults: a) load 8 N.m, speed 900 RPM, b) load 11 N.m, speed 900 RPM, c) load 5 N.m, speed 1200 RPM, d) load 8 N.m, speed 1200 RPM
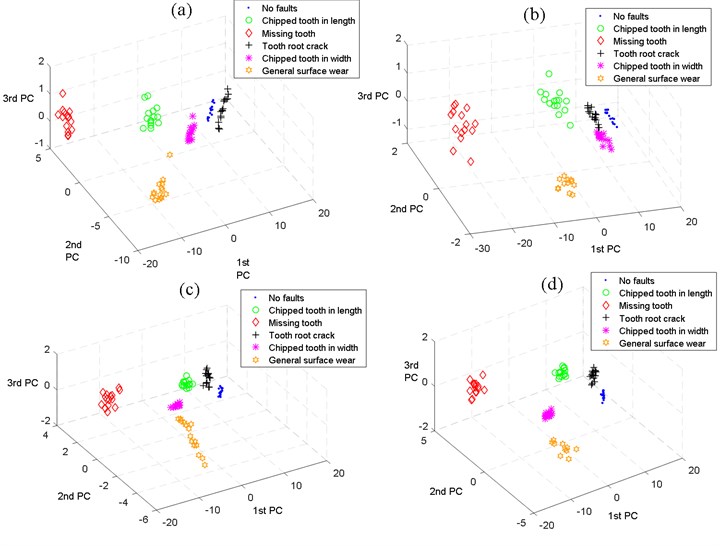
On the other hand, comparison between Figs. 12(a, c, d), Figs. 10(a, c, d) and Figs. s11(a, c, d) shows that: utilizing the PCA in the process of fault feature extraction for wavelet packet frequency band energy, the effect is significantly better than the results obtained by HHT-SVD and LMD-SVD. Nevertheless, there exist major fluctuations for all states, the clustering intervals between the faults states are relatively small. Moreover, the effect of classification is worst between gears with TRC and CTW as shown in Fig. 12(b).
Known from the above analysis, using HEWT with SVD for fault feature extraction under different operating modes is much better than HHT-SVD, LMD-SVD and WPT in tandem with PCA.
Since the instantaneous amplitude matrices of the vibration signals of different fault in the pinions are different, adaptively extracted by the HEWT, thus, they can be used as the feature of diagnostic fault. As the goal is to extract more efficient and more accurate fault features for fault recognition and classification, dimensionality reduction was done by the SVD, thus fault can be accurately identified.
It was obvious in the scatter plots that the various fault singles have a large difference and no overlapping portions in Figs. 9(a-d), from which we suggest that the various faults can be distinguished well.
3.3. State classification based on Elman neural network
Here, the fault feature vectors obtained by HEWT–SVD are used to identify and classify the gear states by using the Elman neural network.
The data sets are divided into training dataset with 168 groups (7 groups of data for each fault status) while the remaining data set (192 groups) are used to test the effectiveness and the accuracy of the classifier. State classification results are partly shown in Table 2, from which we can see that even under variable operating modes and even the signals are noisy the actual outputs of the Elman neural network are consistent with the target outputs. Therefore, combining HEWT-SVD with Elman neural network is effective for gear fault diagnosis under variable operating modes.
Table 2State classification results based on Elman neural network.
Condition | Operating condition | Target output | Actual output of the network | |||||
Normal | (900 RPM, 8 N.m) | (1 0 0 0 0 0) | 1 | 1.502 E-7 | 1.090 E-13 | 0.0071 | 0 | 4.647 E-8 |
(900 RPM, 11 N.m) | (1 0 0 0 0 0) | 0,9999 | 3,524 E-5 | 0 | 4,876 E-7 | 5,220 E-5 | 4,668 E-9 | |
(1200 RPM, 5 N.m) | (1 0 0 0 0 0) | 1 | 1.726 E-7 | 1.388 E-13 | 2.279 E-6 | 0 | 4.019 E-8 | |
(1200 RPM, 8 N.m) | (1 0 0 0 0 0) | 0,9998 | 4,778 E-6 | 3,896 E-14 | 3,791 E-14 | 1,719 E-5 | 3,492 E-8 | |
Tooth root crack | (900 RPM, 8 N.m) | (0 1 0 0 0 0) | 0,0083 | 0,9997 | 0,0002 | 0 | 0 | 8,203 E-7 |
(900 RPM, 11 N.m) | (0 1 0 0 0 0) | 0 | 0,9998 | 3,226 E-6 | 5,551 E-17 | 2,428 E-6 | 1,163 E-9 | |
(1200 RPM, 5 N.m) | (0 1 0 0 0 0) | 0 | 0,9993 | 2,013 E-7 | 5,551 E-17 | 0,0340 | 1,205 E-9 | |
(1200 RPM, 8 N.m) | (0 1 0 0 0 0) | 0 | 0,9997 | 3,226 E-6 | 5,551 E-17 | 2,428 E-6 | 1,163 E-9 | |
Chipped tooth in length | (900 RPM, 8 N.m) | (0 0 1 0 0 0) | 0 | 9,813 E-6 | 0,9999 | 0 | 0 | 2,7538 E-6 |
(900 RPM, 11 N.m) | (0 0 1 0 0 0) | 0 | 4,469 E-5 | 0,9999 | 0 | 8,479 E-5 | 4,360 E-5 | |
(1200 RPM, 5 N.m) | (0 0 1 0 0 0) | 0 | 6,750 E-6 | 0,9999 | 0 | 0 | 3,274 E-6 | |
(1200 RPM, 8 N.m) | (0 0 1 0 0 0) | 0 | 4,066 E-5 | 0,9999 | 0 | 8,210 E-5 | 4,748 E-5 | |
Chipped tooth in width | (900 RPM, 8 N.m) | (0 0 0 1 0 0) | 9,707 E-5 | 3,133 E-7 | 1,937 E-14 | 1 | 0 | 3,527 E-8 |
(900 RPM, 11 N.m) | (0 0 0 1 0 0) | 8,410 E-7 | 3,138 E-5 | 0 | 0,9999 | 3,382 E-5 | 5,475 E-9 | |
(1200 RPM, 5 N.m) | (0 0 0 1 0 0) | 0,0005 | 2,139 E-12 | 5,866 E-7 | 0,9996 | 0 | 4,369 E-9 | |
(1200 RPM, 8 N.m) | (0 0 0 1 0 0) | 0,0003 | 1,951 E-12 | 6,525 E-7 | 0,9998 | 0 | 4,280 E-9 | |
Missing tooth | (900 RPM, 8 N.m) | (0 0 0 0 1 0) | 1,963 E-7 | 6,033 E-5 | 3,774 E-15 | 1,110 E-16 | 0,9999 | 2,308 E-8 |
(900 RPM, 11 N.m) | (0 0 0 0 1 0) | 7,698 E-5 | 3,288 E-5 | 5,662 E-15 | 4,884 E-15 | 0,9991 | 2,609 E-8 | |
(1200 RPM, 5 N.m) | (0 0 0 0 1 0) | 0 | 1,017 E-8 | 3,951 E-10 | 0,0005 | 0,9928 | 7,962 E-10 | |
(1200 RPM, 8 N.m) | (0 0 0 0 1 0) | 0 | 6,293 E-08 | 1,030 E-10 | 2,068 E-05 | 0,9999 | 6,262 E-10 | |
General surface wear | (900 RPM, 8 N.m) | (0 0 0 0 0 1) | 0 | 1,591 E-10 | 5,182 E-5 | 0 | 0 | 0,9999 |
(900 RPM, 11 N.m) | (0 0 0 0 0 1) | 0 | 4,087 E-5 | 7,941 E-13 | 1,959 E-14 | 0 | 0,9999 | |
(1200 RPM, 5 N.m) | (0 0 0 0 0 1) | 0 | 4,116 E-7 | 6,221 E-6 | 0 | 7,648 E-5 | 0,9999 | |
(1200 RPM, 8 N.m) | (0 0 0 0 0 1) | 0 | 3,756 E-7 | 3,877 E-6 | 0 | 7,646 E-5 | 0,9999 | |
In order to compare the classification effect, another classification technique Back Propagation (BP) neural network is applied in classification. Comparison results are shown in Table 3 in which 5 examples are given to calculate the mean value of classification accuracy. As shown in the table, the Elman neural network has an advantage over BP in classification accuracy. Actually, both classifiers have classification accuracies higher than 0.9, because the obtained feature vectors have good separability. This gives confirmatory evidence about the effectiveness of the proposed feature extraction method.
Table 3Classification results of Elman and back propagation neural networks
Sequence | Test samples | Classification accuracy | |
Elman | BP | ||
1 | 192 | 0.9947 | 0.9895 |
2 | 192 | 0.9895 | 0.9843 |
3 | 192 | 1 | 0.9791 |
4 | 192 | 0.9895 | 0.9947 |
5 | 192 | 0.9947 | 0.9843 |
Mean value | 0.9936 | 0.9863 | |
4. Conclusions
Gearbox fault feature extraction and classification have always been unsatisfactory. This constitutes the principal motivation to develop a new approach to overcome this problem. Our new approach consists of combining HEWT, SVD and Elman neural network. Experimental datasets of normal gearbox and five pinion faults and under different operating modes were processed by the HEWT. The instantaneous amplitude matrices namely the feature matrices were decomposed by SVD to get the singular value communality. Their dimensions were hence reduced and more stable features were obtained. This is followed by using the Elman neural network for fault identification and classification according to the extracted feature vectors.
In this paper, the performance of the proposed HEWT-SVD-Elman method is shown to have an advantage over that of HHT-SVD, LMD-SVD and WPT-PCA for feature extraction and Elman neural network with BP for classification accuracy under different operating modes.
It is worth mentioning that in this study we only applied the proposed method for gearbox fault diagnosis, future experiments should be done on similar project to verify the effectiveness of this method.
References
-
Yang Y., He Y., Cheng J., Yu D. A gear fault diagnosis using Hilbert spectrum based on MODWPT and a comparison with EMD approach. Measurement, Vol. 42, Issue 4, 2009, p. 542-551.
-
Zhou G. H., Zuo C. C., Wang J. Z., Liu S. X. Gearbox fault diagnosis based on wavelet-AR model. International Conference on Machine Learning and Cybernetics, 2007, p. 1061-1065.
-
Mcfadden P. D. Detection of gear faults by decomposition of matched differences of vibration signals. Mechanical Systems and Signal Processing, Vol. 14, Issue 5, 2000, p. 805-817.
-
Li X. J., Jiang L. L., Yang D. L., Wang K. Cluster analysis and fault diagnosis for gear based on bispectrum distribution. Journal of Vibroengineering, Vol. 24, Issue 3, 2011, p. 304-308.
-
Martin H. R., Ismail F., Sakuta A. Algorithms for statistical moment evaluation for machine health monitoring. Mechanical Systems and Signal Processing, Vol. 6, Issue 4, 1992, p. 317-327.
-
Mcfadden P. D., Smith, J. D. A signal processing technique for detecting local defects in a gear from the signal average of the vibration. Proceedings of the Institution of Mechanical Engineers, Part C: Journal of Mechanical Engineering Science, Vol. 199, Issue 4, 1985, p. 287-292.
-
Zheng G. T., Wang W. J. A new cepstral analysis procedure of recovering excitations for transient components of vibration signals and applications to rotating machinery condition monitoring. Journal of Vibration and Acoustics, Vol. 123, Issue 2, 2001, p. 222-229.
-
Mark W. D., Lee H., Patrick R., Coker J. D. A simple frequency-domain algorithm for early detection of damaged gear teeth. Mechanical Systems and Signal Processing, Vol. 24, Issue 8, 2010, p. 2807-2823.
-
Qin S. R., Zhong Y. M. Research on the unified mathematical model for FT, STFT and WT and its applications. Mechanical Systems and Signal Processing, Vol. 18, Issue 6, 2004, p. 1335-1347.
-
Choy F. K., Polyshchuk V., Zakrajsek J. J., et al. Analysis of the effects of surface pitting and wear on the vibration of a gear transmission system. Tribology International, Vol. 29, Issue 1, 1996, p. 77-83.
-
Bartelmus W., Zimroz R. Vibration condition monitoring of planetary gearbox under varying external load. Mechanical Systems and Signal Processing, Vol. 23, Issue 1, 2009, p. 292-305.
-
Öztürk H., Sabuncu M., Yesilyurt I. Early detection of pitting damage in gears using mean frequency of scalogram. Journal of Vibration and Control, Vol. 14, Issue 4, 2008, p. 469-484.
-
Chen J., Li Z., Pan J., Chen G., Zi Y., Yuan J., He Z. Wavelet transform based on inner product in fault diagnosis of rotating machinery: a review. Mechanical Systems and Signal Processing, Vol. 70, 2016, p. 1-35.
-
Gilles J., Tran G., Osher S. 2D empirical transforms. Wavelets, ridgelets, and curvelets revisited. SIAM Journal on Imaging Sciences, Vol. 7, Issue 1, 2014, p. 157-186.
-
Huang Norden E., Shen Zheng, Long Steven R., et al. The empirical mode decomposition and the Hilbert spectrum for nonlinear and non-stationary time series analysis. Proceedings of the Royal Society of London A: Mathematical, Physical and Engineering Sciences. The Royal Society, 1998, p. 903-995.
-
Peng Z. K., Tse Peter W., F. L. A comparison study of improved Hilbert-Huang transform and wavelet transform: application to fault diagnosis for rolling bearing. Mechanical Systems and Signal Processing, Vol. 19, Issue 5, 2005, p. 974-988.
-
Liu B., Riemenschneider S., Xu Y. Gearbox fault diagnosis using empirical mode decomposition and Hilbert spectrum. Mechanical Systems and Signal Processing, Vol. 20, Issue 3, 2006, p. 718-734.
-
Feng Z., Liang M., Chu F. Recent advances in time-frequency analysis methods for machinery fault diagnosis: a review with application examples. Mechanical Systems and Signal Processing, Vol. 38, Issue 1, 2013, p. 165-205.
-
Cheng J., Yang Y., Yang Y. A rotating machinery fault diagnosis method based on local mean decomposition. Digital Signal Processing, Vol. 22, Issue 2, 2012, p. 356-366.
-
Frei Mark G., Osorio Ivan Intrinsic time-scale decomposition: time-frequency-energy analysis and real-time filtering of non-stationary signals. Proceedings of the Royal Society of London A: Mathematical, Physical and Engineering Sciences, 2007 p. 321-342.
-
Daubechies I., Lu J., Wu H. T. Synchrosqueezed wavelet transforms: an empirical mode decomposition-like tool. Applied and Computational Harmonic Analysis, Vol. 30, Issue 2, 2011, p. 243-261.
-
Hazra B., Narasimhan S. Gear fault diagnosis using synchro-squeezing transform based feature analysis. Key Engineering Materials, 2013, p. 449-456.
-
Gilles J. Empirical wavelet transform. IEEE Transactions on Signal Processing, Vol. 61, Issue 16, 2013, p. 3999-4010.
-
Chen J., Pan J., Li Z., Zi Y., Chen X. Generator bearing fault diagnosis for wind turbine via empirical wavelet transform using measured vibration signals. Renewable Energy, Vol. 89, 2016, p. 80-92.
-
Zheng J., Pan H., Yang, Cheng J. Adaptive parameter less empirical wavelet transform based time-frequency analysis method and its application to rotor rubbing fault diagnosis. Signal Processing, Vol. 130, 2017, p. 305-314.
-
Merainani Boualem, Benazzouz Djamel, Rahmoune Chemseddine Early detection of tooth crack damage in gearbox using empirical wavelet transform combined by Hilbert transform. Journal of Vibration and Control, Vol. 23, Issue 10, 2017, p. 1623-1634.
-
Merainani B., Benazzouz D., Ould Bouamama B., et al. Early fault diagnosis of gearbox using empirical wavelet transform and Hilbert transform. 24th Mediterranean Conference on Control and Automation, 2016, p. 1367-1372.
-
Merainani Boualem, Rahmoune Chemseddine, Benazzouz Djamel, et al. Rolling bearing fault diagnosis based empirical wavelet transform using vibration signal. 8th International Conference on Modelling, Identification and Control, 2016.
-
Sendhilkumar S., Mohanasundaram N., Senthilkumar M., et al. Elman neural network for diagnosis of unbalance in a rotor-bearing system. International Journal of Mechanical, Aerospace, Industrial, Mechatronic and Manufacturing Engineering, Vol. 10, Issue 3, 2016, p. 613-617.
-
Nakos G., Joyner D. Linear Algebra with Applications. PWS Publishing Company, 1998.
-
Fedala S., Rémond D., Zegadi R., Felkaoui A. Contribution of angular measurements to intelligent gear faults diagnosis. Journal of Intelligent Manufacturing 2015, https://doi.org/10.1007/s10845-015-1162-1.
-
Su Z., Zhang Y., Jia M., Xu F., Hu J. Gear fault identification and classification of singular value decomposition based on Hilbert-Huang transform. Journal of Mechanical Science and Technology, Vol. 25, Issue 2, 2011, p. 267-272.
Cited by
About this article
The authors would like to thank the laboratory of contact and structure mechanics (LAMCOS) and in particular Pr. Didier RÉMOND for sharing their valuable experimental data with us.

