Abstract
The accuracy of fused deposition modeling (FDM) prototype is affected by many factors, which process parameters are the most important factor. It is difficult to establish mathematical model accurately; the reason is that process parameters in FDM are coupled and the forming process is nonlinear. In order to define the effect of various process parameters on the forming precision and improve the precision of FDM printing, this paper established the precision prediction model based on process parameters by genetic algorithm optimizing the BP neural network’s weight and threshold. Compared with BP prediction model, the result has shown that the precision of the prediction model is better than those of BP prediction model.
1. Introduction
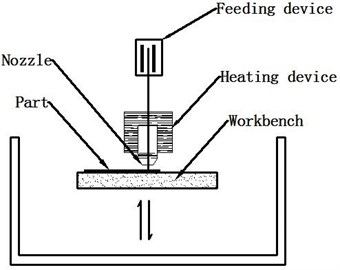
Addictive manufacturing technology is the advanced manufacturing technology which is the multidiscipline combination of manufacturing technology, information technology and new materials technology in recent 20 years [1]. The parts are produced by accumulating material layer by layer relatively to the traditional material removal (cutting machining) method. FDM is one of the most mature addictive manufacturing technology which was put forward by Scott Crump in 1988. It has been successfully applied in many fields in the conceptual model. As shown in Fig. 1, FDM rapid prototyping machine mainly consists of nozzle device, feeding device and workbench, et al. The nozzle is moved in horizontal x and y planes, the workbench moves vertically along the Z direction. The layers are formed by extrusion of a plastic filament (ABS, PLA) that is melted in the heating device. FDM in rapid prototyping technology is widely applied in industry because of its simple molding equipment, low expense of equipment and high reliability, but FDM prototype parts’ precision is low and its surface has the obvious texture, which has seriously restricted and hindered the further application of FDM [2]. In process, the precision of prototype parts is affected by multiple process parameters which are chosen based on experience and experiment. So, it is unfavorable to FDM users. Therefore, how to choose the process parameters scientifically and reasonably to improve the precision becomes an urgent demand to solve.
Fig. 1Principle diagram of FDM technology
2. Literature review
Some experiments have been made to improve dimensional accuracy of FDM parts by optimizing process parameters. Zou et al. [3] measured the various characteristics of FDM prototype parts by coordinate measuring machine and the surface roughness, then they get the relationship between the prototype parts quality and the process parameters by MATLAB. Luo et al. [4]. studied the important process parameters in FDM process. They discussed the effect of the FDM process control technology on the optimum choice of the process parameters, which provide rational selection for users.
The above literature review proved that the quality of FDM mechanical parts can be improved by the proper choice of optimum process parameters. However, it is difficult to establish functional relationship between process parameters and dimensional accuracy by the traditional method. In recent years, it has got a good predictive effect by combining the artificial neural network (ANN) with wavelet transform, fuzzy theory, simulated annealing algorithm and support vector machine method [5]. Gao et al. [6] diagnosed the degree of damage within a certain range of train speed wheel, which combined genetic algorithm with wavelet neural network, the results show that the algorithm is highly accurate and valid. Mei et al. [7] improved the function of the learning and inference of expert system through the sample analysis of the artificial neural network, the learning and reasoning functionalizes are enhanced and proved effective in terms of fault diagnosis on multilevel planetary gear increasers and reducers. D. Bellante et al. [8] developed forecasting model based on the design characteristics of homemade parts, they combined it with the neural network optimization algorithm, which determined the CAD model with the optimal value. Ji et al. [9] studied the wavelet neural network prediction model of product precision, which was built by using the MATLAB software. Simulation results indicate that the prediction model has sufficient accuracy. Based on the above research, this paper established a hybrid prediction precision algorithm, which is GA-BP model by combining genetic algorithm with BP neural network.
3. Methodology
In this paper, five process parameters (cable width offset, layer thickness, filling speed, extrusion speed and the fallback speed) are discussed. Table 1 shows the five process parameters and their levels, other FDM parameters are controlled at their fixed level.
Table 1Process parameters and their levels
Process parameters | Symbols | Levels | |||
V1 | V2 | V3 | V4 | ||
Cable width offset (mm) | A | 0.15 | 0.2 | 0.25 | 0.3 |
Lay thickness (mm) | B | 0.1 | 0.15 | 0.2 | 0.25 |
Filling speed (mm/s) | C | 30 | 40 | 50 | 60 |
Extrusion speed (mm/s) | D | 25 | 30 | 35 | 40 |
The fallback speed (mm/s) | E | 30 | 45 | 60 | 75 |
3.1. Acquisition of experimental samples
In order to assess the dimensional precision of parts produced by FDM printing machine, according to the research of H. S. Cho [10], this paper select the standard parts “letter-H” geometry. The shape of the “letter-H” is so sample that it can be easily measured and analyzed. It can be used to reflect on the material contraction error but also reflect on the warp deformation error. For the standard part, five dimensional parameters are required to measure, as shown in Fig. 2. Dimensional parameters a, b and c, d are correspond to the x and y directions respectively, and dimension e is corresponding to the z direction.
Fig. 2FDM standard parts
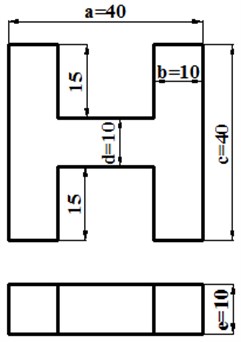
Fig. 3The Corexy structure machine of DIY 3D printer
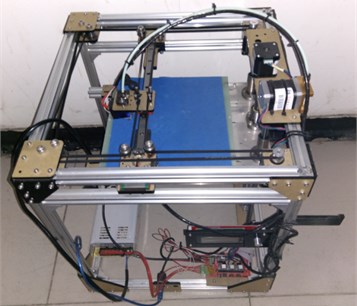
For the sake of improving the accuracy and efficiency of the experiment, this paper got 24 sets of process parameters with orthogonal test firstly, and then an additional 8 sets of data were obtained using the interpolation method. Finally, the parts were manufactured by the FDM printing machine based on above 32 sets of process parameters. To get a set of experimental samples, this article measures the standard parts one by one [11]. This experiment chooses the corexy structure machine of DIY 3D printer, as shown in Fig. 3. PLA is selected as experimental material. In this experiment, the temperature of extruder nozzle is kept at 210 degrees Celsius, the temperature of hot bed reaches 50 degrees Celsius and the environmental temperature is set to 25 degrees Celsius. The material of extruder nozzle is brass, and the inner diameter is 0.4 mm. The dimensional parameters of standard part can be measured with micrometer. For the dimension, each value should be measured by three times. Dimension errors can be obtained by calculating the difference between the actual size and the theoretical size, which are expressed as ∆a, ∆b, ∆c, ∆d, ∆e.The final experimental samples can be seen in Table 2, 6 groups experimental data (No.4, 7, 11, 15, 20, 31) are chosen as test samples from 32 groups experimental data, others are established as the training samples.
3.2. Training and simulation
For BP neural network, a set of weights are selected randomly, the given target output can be established as linear equation algebra directly and then come to power [12]. In the actual neural network, BP neural network and its various forms of transform occupy 80-90 % of the artificial neural network, but BP neural network also has many shortcomings, including slow convergence rate, low learning rate and easy to fall into local minima, etc. The genetic algorithm (GA) is a kind of natural selection and population genetics random optimization algorithm [13]. BP neural network’s weights and thresholds are random numbers within the range of –0.5-0.5. The initialization of these parameters has great influence on the network training, but they can’t be obtained accurately. Therefore, it is necessary to optimize the weights and thresholds by the combination of genetic algorithms and BP neural network to improve the prediction precision [14].
Table 2Experiment samples
Serial | A (mm) | B (mm) | C (mm/s) | D (mm/s) | E (mm/s) | ∆a (mm) | ∆b (mm) | ∆c (mm) | ∆d (mm) | ∆e (mm) |
1 | 0.15 | 0.1 | 30 | 35 | 60 | –0.433 | –0.17 | –0.332 | –0.158 | –0.149 |
2 | 0.15 | 0.1 | 60 | 55 | 30 | –0.373 | –0.2 | –0.412 | –0.179 | –0.007 |
3 | 0.15 | 0.15 | 30 | 45 | 75 | –0.391 | –0.138 | –0.32 | –0.106 | –0.007 |
4 | 0.15 | 0.15 | 60 | 25 | 30 | –0.365 | –0.162 | –0.339 | –0.185 | 0.024 |
5 | 0.15 | 0.2 | 40 | 35 | 60 | –0.399 | –0.145 | –0.356 | –0.108 | –0.021 |
6 | 0.15 | 0.2 | 50 | 55 | 30 | –0.376 | –0.131 | –0.365 | –0.126 | –0.243 |
7 | 0.15 | 0.25 | 40 | 45 | 75 | –0.418 | –0.129 | –0.374 | –0.075 | 0.083 |
8 | 0.15 | 0.25 | 50 | 25 | 30 | –0.38 | –0.138 | –0.37 | –0.124 | 0.088 |
9 | 0.2 | 0.1 | 30 | 25 | 60 | –0.466 | –0.189 | –0.355 | –0.17 | –0.013 |
10 | 0.2 | 0.1 | 60 | 45 | 45 | –0.455 | –0.134 | –0.279 | –0.083 | 0.069 |
11 | 0.2 | 0.15 | 30 | 55 | 75 | –0.429 | –0.119 | –0.434 | –0.136 | 0.038 |
12 | 0.2 | 0.15 | 60 | 35 | 30 | –0.373 | –0.176 | –0.349 | –0.173 | 0.092 |
13 | 0.2 | 0.2 | 40 | 25 | 60 | –0.434 | –0.189 | –0.357 | –0.169 | –0.067 |
14 | 0.2 | 0.2 | 50 | 45 | 45 | –0.448 | –0.149 | –0.37 | –0.142 | -0.042 |
15 | 0.2 | 0.25 | 40 | 55 | 75 | –0.508 | –0.127 | –0.393 | –0.093 | 0.053 |
16 | 0.2 | 0.25 | 50 | 35 | 30 | –0.55 | –0.131 | –0.427 | –0.124 | 0.053 |
17 | 0.25 | 0.1 | 40 | 55 | 30 | –0.746 | –0.214 | –0.399 | –0.277 | 0.002 |
18 | 0.25 | 0.1 | 50 | 35 | 75 | –0.406 | –0.22 | –0.406 | –0.211 | 0.001 |
19 | 0.25 | 0.15 | 40 | 25 | 45 | –0.417 | –0.193 | –0.381 | –0.164 | 0.043 |
20 | 0.25 | 0.15 | 50 | 45 | 60 | –0.46 | –0.168 | –0.349 | –0.105 | 0.022 |
21 | 0.25 | 0.2 | 30 | 55 | 30 | –0.428 | –0.167 | –0.379 | –0.13 | 0.034 |
22 | 0.25 | 0.2 | 60 | 35 | 75 | –0.52 | –0.157 | –0.398 | –0.151 | 0.053 |
23 | 0.25 | 0.25 | 30 | 25 | 45 | –0.43 | –0.134 | –0.332 | –0.089 | –0.08 |
24 | 0.25 | 0.25 | 60 | 45 | 60 | –0.562 | –0.178 | –0.459 | –0.167 | 0.221 |
25 | 0.3 | 0.1 | 40 | 45 | 30 | –0.444 | –0.224 | –0.421 | –0.224 | 0.01 |
26 | 0.3 | 0.1 | 50 | 25 | 75 | –0.436 | –0.189 | –0.384 | –0.244 | –0.079 |
27 | 0.3 | 0.15 | 40 | 35 | 45 | –0.423 | –0.201 | –0.355 | –0.155 | –0.115 |
28 | 0.3 | 0.15 | 50 | 55 | 60 | –0.402 | –0.171 | –0.373 | –0.168 | –0.15 |
29 | 0.3 | 0.2 | 30 | 45 | 30 | –0.363 | –0.15 | –0.336 | –0.128 | –0.109 |
30 | 0.3 | 0.2 | 60 | 25 | 75 | –0.449 | –0.151 | –0.405 | –0.145 | 0.113 |
31 | 0.3 | 0.25 | 30 | 35 | 60 | –0.375 | –0.141 | –0.374 | –0.073 | –0.202 |
32 | 0.3 | 0.25 | 60 | 55 | 75 | –0.676 | –0.185 | –0.49 | –0.179 | –0.021 |
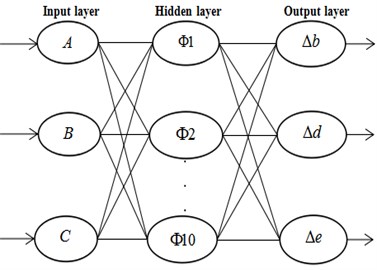
In this study, the hierarchy of chosen neural network is made up of input layer, hidden layer and output layer, as shown in Fig. 4. These dimensional errors (∆b, ∆d, ∆e) are chosen as simulation samples. Therefore, there are three input parameters and three output parameters in this prediction precision model. The number of nodes in the hidden layer is related to the network learning time and the size of the error, thus, the selection of the number of hidden neurons has a great influence on the prediction of the whole neural network. According to the study of Shen et al. [15], the optimal number of hidden neurons is n1 (refer to Eq. (1)):
where m is the number of output neurons, n is the number of input neurons, and a is a constant between 1 and 10. Thus, the number of optimal hidden neurons should be between 4 and 13, The training error is shown in Table 3, This paper chooses the number of hidden neurons that minimize the training error (the value is 10), therefore, a 3-10-3 neural network is built in this model.
Table 3The training error of different number of hidden neurons
The number of hidden neurons | 4 | 5 | 6 | 7 | 8 |
Training error | 9.0E-9 | 2.43E-9 | 8.92E-10 | 4.23E-10 | 9.87E-11 |
The number of hidden neurons | 9 | 10 | 11 | 12 | 13 |
Training error | 4.65E-11 | 3.39E-11 | 6.85E-11 | 1.20E-10 | 3.52E-10 |
The training of neural network is a process of optimizing the weights and thresholds which can make the network output errors small constantly. The BP neural network’s training function is “trainlm”, which use Levenberg-Marquardt to train network. The error of proposed network target is 0.00001, the choice of function for hidden layer and output layer has large effect on the prediction accuracy of BP neural network. In this simulation, the transfer functions of hidden layer neuron and output layer neuron are “logsig” and “purelin” respectively. The crossover probability and mutation probability of genetic algorithm paper are set 0.9 and 0.1 respectively [16], then the network can be trained after the determination of the network structure and corresponding parameters.
Fig. 4Structure of neural network
4. Analysis
Fig. 5 shows the change process of network error. After training for six times, the application of the optimization of the BP neural network by genetic algorithm can reach high precision. The accuracy of trained model reaches 3.3902e-11, which satisfies the required accuracy for 1.0e-5. Therefore, the optimal weight and threshold is chosen by training network for six times.
Fig. 5Change of SSE
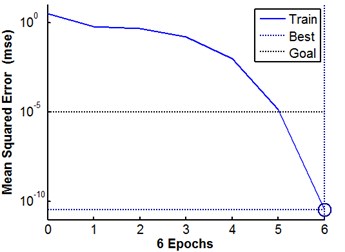
Fig. 6 shows the prediction results of dimension errors, ∆b, ∆d, ∆e, which are dimension errors of the x, y and z direction respectively. Fig. 6(a) is the dimensional error of ∆b, Fig. 6(b) is the dimensional error of ∆d, Fig. 6(c) is the dimensional error of ∆e. Among them, the black lines are the actual dimension errors, the blue lines are the predictive error of BP model and the red lines are predictive error of GA-BP model. In addition to a few cases, the figures show that the precision of GA-BP model is considerably higher than the prediction precision of the BP model. The combination of genetic algorithm with neural network can significantly reduce the possibility of local optimum. This is because the genetic algorithm can optimize the weight and threshold individually, which can reduce the possibility of BP neural network’s divergence and vibration. In short, the intrinsic mechanism of GA-BP model determines all kinds of training and prediction performance, which indicates that the method is feasible and valid in the evaluation of prediction precision and adaptive ability.
Fig. 6The prediction result of dimensional errors
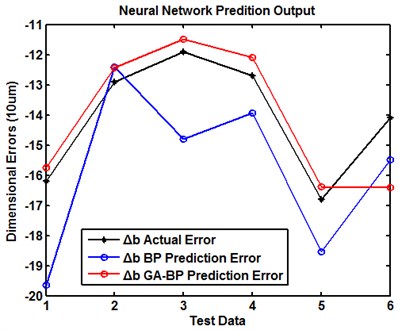
a) Dimensional error of ∆b
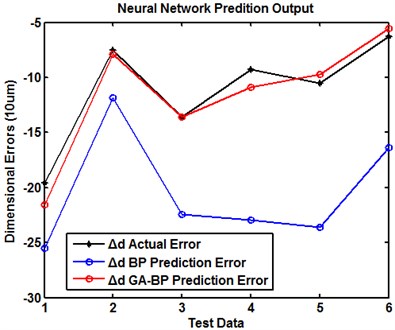
b) Dimensional error of ∆d
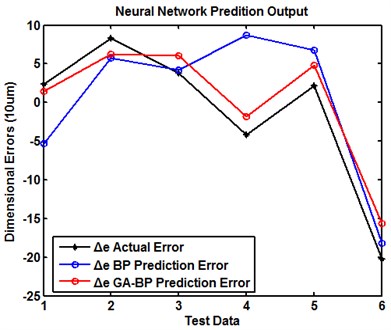
c) Dimensional error of ∆e
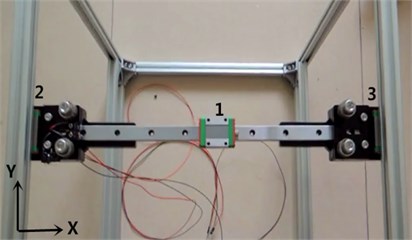
Fig. 7 shows the dimension errors in the x, y and z directions. The red line is the actual dimension error ∆b, for which the absolute average error is 0.165 mm. The blue lines are the actual dimension errors ∆d, for which the absolute average error is 0.149 mm. And the green line is the actual dimension error ∆e, for which the absolute average error is 0.072 mm. In this figure, in most cases, the error in z direction is less than errors in x and y direction. It is concerned with the principle of FDM, which is accumulating layer by layer. Therefore, the deformation is focused on the x and y directions. Besides, the dimension error in y direction is less than the error in x direction. The error is largely due to scan of machine, the gliding in the x direction is in single guideway while the gliding in the y direction is in double guideway, as shown in Fig. 8. Therefore, the motion of nozzle in y direction is smoother than the motion in the x direction which causes the error in the y direction less than the error in the x direction.
Fig. 7The contrast figure in the x, y and z directions
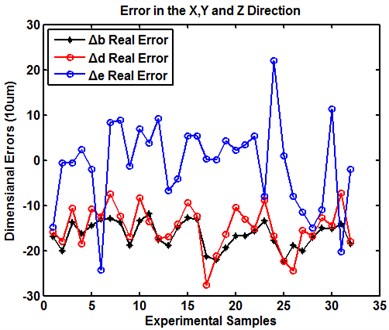
Fig. 8The figure of guideway: 1 – The guideway of x direction, 2 – The left guideway of y direction, 3 – The right guideway of y direction
5. Conclusions
This study has proposed an effective prediction method of FDM process parameters by using GA-BP model. The work presented the successful application of GA-BP model in FDM process parameter prediction method and solved the difficult problem (It is difficult to build accurate mathematical model). By the comparison on the same test data, this algorithm has a higher prediction accuracy than the BP neural network algorithm, which indicates that the GA-BP model is feasible and valid in the evaluation of prediction precision and adaptive ability.
Based on the data comparison of different direction and the same size, the error in z direction is less than the error in x and y directions. This is concerned with the principle of FDM, which is accumulating layer by layer. The dimension error of y direction is less than the error in x direction. The error is largely due to scan of machine, the gliding in the x direction is in single guideway while the gliding in the y direction is in double guideway, which causes the motion of nozzle in y direction is smoother than the motion in the x direction.
References
-
Lu Bingheng, Li Dichen Development of the addictive manufacturing (3D printing) technology. Machine Building and Automation, Vol. 42, Issue 4, 2013, p. 1-4.
-
Vahabli E., Rahmati S. Application of an RBF neural network for FDM parts’ surface roughness prediction for enhancing surface quality. International Journal of Precision Engineering and Manufacturing, Vol. 17, Issue 12, 2016, p. 1589-1603.
-
Zou Guolin,Guo Dongming, Jia Zhenyuan, Liu Shunfu Research on parameter optimization of fused deposition modeling. Journal of Dalian University of Technology, Vol. 42, Issue 4, 2002, p. 446-450.
-
Luo Jin,Ye Chunsheng, Huang Shuhuai The study on the important technologic parameters and their control of FDM system. China Metal Forming Equipment and Manufacturing Technology, Vol. 40, Issue 6, 2005, p. 77-80.
-
Tian Jingwen, Gao Meijuan Artificial Neural Network Algorithms and Application. Beijing Institute of Technology Press, Beijing, 2006.
-
Gao Ruipeng, Shang Chunyang, Jiang Hang A fault detection strategy for wheel flat scars with wavelet neural network and genetic algorithm. Journal of Xi’an Jiaotong University, Vol. 47, Issue 9, 2013, p. 88-91.
-
Mei Jie, Chen Dingfang, Li Wenfeng, Lu Quanguo, Yu Zhen Fault diagnosis expert system for multilevel planetary gear boxes based on neural networks. China Journal of Construction Machinery, Vol. 9, Issue 1, 2011, p. 117-121.
-
Bellante D. Dimensional accuracy improvement of FDM square cross-section parts using artificial neural networks and an optimization algorithm. The International Journal of Advanced Manufacturing Technology, Vol. 69, Issue 9, 2013, p. 2301-2313.
-
Ji Liangbo Precision prediction model in fused deposition modeling of three-dimensional printing based on wavelet neural network. Journal of Shanghai Jiaotong University, Vol. 49, Issue 3, 2015, p. 375-378.
-
Cho H. S., Park W. S., Choi B. W., Leu M. C. Determining optimal parameters for stereolithography processes via genetic algorithm. Journal of Manufacturing Systems, Vol. 19, Issue 1, 2000, p. 18-27.
-
Fang Kaitai, Ma Changxing Orthogonal and Uniform Experimental Design. Science Press Co. Ltd, Beijing, 2001.
-
Xu Liming, Wang Qing Chen Jianping, Pan Yuzhen Forecast for average velocity of debris flow based on BP neural network. Journal of Jilin University, Earth Science Edition, Vol. 43, Issue 1, 2013, p. 186-191.
-
Maslov I. V., Gertner I. Using neural network to improve the performance of the hybrid evolutionary algorithm in image registration. International Society for Optics and Photonics, 2003.
-
Zhang Xian, Jiang Airong Genetic algorithm optimized neural network prediction model of weld penetration. Light Industry Machinery, Vol. 29, Issue 3, 2011, p. 27-31.
-
Shen Huayu, Wang Zhaoxia, Gao Chengyao, Qin Juan, Yao Fubin, Xu Wei Determining the number of BP neural network hidden layer units. Journal of Tianjin University of Technology, Vol. 24, Issue 5, 2008, p. 13-15.
-
Li Junqi, Shi Guozhen A study of relationship of crossover rate and mutation rate in genetic algorithm. Journal of Wuhan University of Technology, Transportation Science and Engineering, Vol. 27, Issue 1, 2003, p. 97-99.
Cited by
About this article
This work was supported by the Fundamental Research Funds for the Central Universities (2017MS150).

