Abstract
In order to study the unsteady performance of a two-stage self-priming centrifugal pump, the unsteady numerical calculation in a two-stage self-priming centrifugal pump was performed and energy characteristics experiments and self-priming experiments were carried out. The pressure pulsation and radial force in the pump were then analyzed. The results show that numerical calculation values are close to the experiment values. Head deviation of the pump is less than 3 %, and efficiency deviation of the pump is less than 2 percentage points. Compared with monitoring point P1, the pressure fluctuation coefficient of monitoring point P3 at the design flow rate is reduced by 61 %. Compared with monitoring point P8, the pressure fluctuation coefficient of monitoring point P5 is reduced by 70 %. The radial force on the radial guide-vane is obviously smaller than that on the volute. Under the same flow rate, radial force on the volute of second-stage pump is almost 20 times larger than that on the radial guide-van of first-stage pump.
1. Introduction
Due to its small size, easy maintenance and simple installation, self-priming centrifugal pumps are widely used in agricultural irrigation, urban environmental protection, fire control, chemical industry and water supply field. With the development of technology and applications of self-priming centrifugal pumps, multi-stage self-priming centrifugal pumps are made. Because multi-stage self-priming centrifugal pump combines the advantages of self-priming centrifugal pump and multi-stage centrifugal pump. It can be used in some occasions where either the head of pump is required to be high, the pump and motor installation location is limited, or equipment needs to be started and stopped frequently.
At present the researches about self-priming centrifugal pump are mainly aimed at the single-stage self-priming pump [1-8]. Sato et al. [2] analyzed the influence of impeller blade angles of centrifugal pump on air/water two-phase flow performance by using of the numerical simulation and experiment, and found that the larger inlet angle and outlet angle of the impeller are disadvantageous to the air/water two-phase flow in the self-priming pump. John [6] introduced the basic working principle of the self-priming pump and compared the influence of the volute-type water chamber and the guide-vane-type water chamber on the self-priming performance. Henke [8] installed inducer in the inlet of the self-priming pump, which reduces the energy consumption and decreases the noise generated during the operation process of the pump.
However, researches about multi-stage self-priming centrifugal pump [9, 10] are relatively few, especially unsteady performance and self-priming experiment of multi-stage self-priming centrifugal pump. As to multi-stage centrifugal pumps, some scholars have always made some research achievements. Yutaka et al. [11] measured the dynamic characteristics of multi-stage centrifugal pump and researched the unsteady flow in multi-stage centrifugal pump, especially pressure fluctuation in the flow passage of guide vane and volute. Plutcki et al. [12] studied the single stage of multi-stage centrifugal pump by numerical simulation and analyzed the flow law of fluid in guide vane with ball-shape surface. Cukurel et al. [13] studied the flow law of fluid in circumferential and axial direction in radial guide vane as well as the variation in load.
Therefore, the main motive of this paper is to analyze the unsteady characteristics of pressure fluctuation and radial force in a two-stage self-priming centrifugal pump with numerical simulation and experimental study.
2. Calculation model and experimental device
2.1. Calculation model
The self-priming centrifugal pump is required to be installed in the sprinkler. The design parameters of the self-priming centrifugal pump are as followed. Flow rate Qd is 60 m3/h, head H is 105 m, rotation speed n is 3540 r/min, and efficiency η is 60 %. When the self-priming height is 4 m, the self-priming time of the pump Ts is less than 180 s.
The self-priming centrifugal pump used in the sprinkler is designed to be a two-stage self-priming centrifugal pump with a gear case. The head of first-stage pump is H1= 50 m, and the head of second-stage pump is H2= 55 m. The structure of the pump is shown in Fig. 1. Main design parameters of the pump are shown in Table 1.
Fig. 1Structure of the two-stage self-priming centrifugal pump: 1. First-stage impeller, 2. Radial guide-vane, 3. Pump body, 4. Second-stage impeller, 5. Mechanical seal, 6. Overdrive gear, 7. Gear shaft, 8. Pump shaft, 9. Gear case
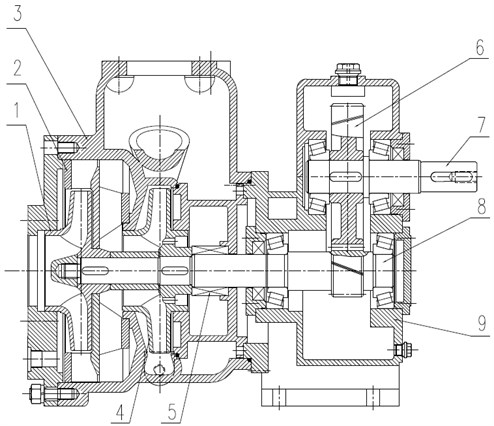
Table 1Main design parameters of the pump
Parameter | Inlet diameter of pump | Inlet diameter of first-impeller | Outlet diameter of first-impeller |
Value | 75 mm | 75 mm | 170 mm |
Parameter | Outlet blade width of first-impeller | Blade outlet angle of first-impeller | Blade wrap angle of first-impeller |
Value | 14 mm | 25 ° | 110 ° |
Parameter | Blade number of first-impeller | Inlet diameter of second-impeller | Outlet diameter of second-impeller |
Value | 6 | 75 mm | 175 mm |
Parameter | Outlet blade width of second-impeller | Blade outlet angle of second-impeller | Blade wrap angle of second-impeller |
Value | 13 mm | 25 ° | 110 ° |
Parameter | Blade number of second-impeller | Inlet diameter of guide vane | Outlet width of guide vane |
Value | 6 | 174mm | 17.5 mm |
Parameter | Blade number of guide vane | Outlet diameter of guide vane | Inlet diameter of volute |
Value | 7 | 237 mm | 180 mm |
Parameter | Inlet width of volute | Tongue angle of volute | Outlet diameter of pump |
Value | 22 mm | 29 ° | 70 mm |
Fig. 2 shows the calculation area of the whole flow field, including inlet extension part, first-stage impeller, radial guide-vane, first-stage pump chamber, second-stage impeller, volute, second-stage pump chamber, gas-liquid separation chamber and outlet extension part.
Fig. 2Calculation areas
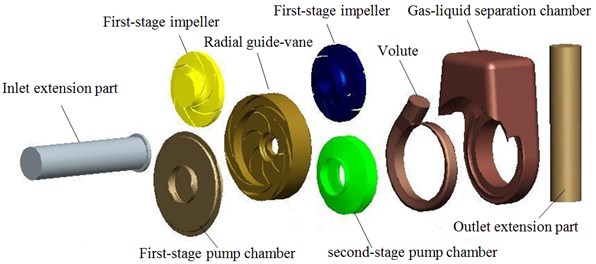
a) Explosion chart
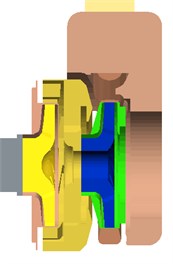
b) Profile chart
2.2. Experimental device
2.2.1. Energy characteristic test bench
Energy characteristic test device of the two-stage self-priming centrifugal pump is shown in Fig. 3.
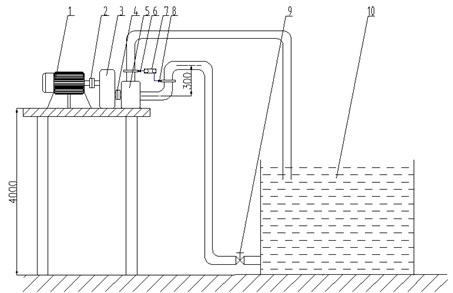
2.2.2. Self-priming test bench
Self-priming test bench of the two-stage self-priming centrifugal pump is shown in Fig. 4. In order to measure self-priming time of the two-stage self-priming centrifugal pump, the two-stage self-priming centrifugal pump is placed at a platform whose height is 4 m from the grand. A pipe upward bending is connected at the inlet of the pump, and the pipe is about 300 mm higher than the pump shaft.
Fig. 3Sketch of energy characteristic test bench: 1. Electric motor, 2. Coupler, 3. Speed changing case, 4. Coupler, 5. Pump, 6. Pressure sensor in the outlet, 7. Pressure displayer, 8. Pressure sensor in the inlet, 9. Electromagnetic flow-meter, 10. Flow meter displayer, 11. Sluice valve, 12. Water tank
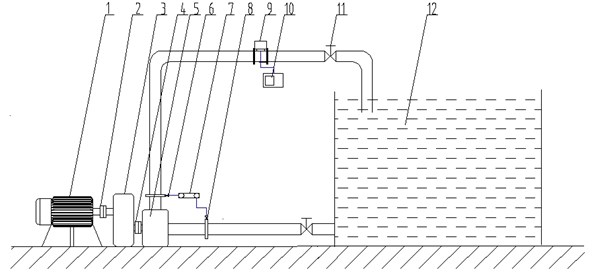
Fig. 4Sketch of self-priming test bench: 1. Electric motor, 2. Coupler, 3. Speed changing case, 4. Coupler, 5. Pump, 6. Pressure sensor in the outlet, 7. Pressure displayer, 8. Pressure sensor in the inlet, 9. Sluice valve 10. Water tank
3. Numerical method
3.1. Grid generation
In this paper, calculation area of the whole flow field was divided with the ICEM code. It is one of the key factors which affects the accuracy of numerical simulation and the calculation time, concerning whether grid generation is reasonable or not. Due to the complexity of the pump structure, the tetrahedral grid with strong adaptability is used during grid generation. Too few meshes will affect the accuracy of the calculation results. Too many meshes will increase the workload and consume too much calculation time. In order to ensure the accuracy of the calculation and save time, the grid independence check is performed. CFX software was used to simulate the centrifugal pump numerically, and the results are shown in Table 2.
Table 2Grid independence analysis
No. | 1 | 2 | 3 | 4 | 5 | 6 |
Grid number | 3845623 | 4581564 | 6862158 | 7912235 | 8516352 | 10013496 |
Head /m | 105.89 | 106.08 | 106.38 | 106.98 | 107.04 | 106.56 |
As seen from Table 2, although the difference in the total grid numbers is large, the deviation of head is within 0.5 %. As a result, the simulation results are stable. Considering the accuracy and time of the simulation, the total number of 6862158 is selected to do the next numerical simulation.
3.2. Boundary conditions
The inlet boundary condition was set as a standard atmospheric pressure (1 atm), which assumed that the flow velocity in the inlet section is uniformly distributed. The outlet boundary condition is set as the mass flow rate. All physical surfaces were set as no-slip wall and the near-wall regions were disposed with standard wall functions method. That is, the component of time indicated that velocity and the pulse velocity in all directions were zero.
3.3. Arrangement of monitoring point
According to the rotation speed of the impeller, the time step is set to 4.7081×10⁻⁵s. That is, 1 degree which the impeller rotated was chosen as a time step. In order to ensure the accuracy of analysis, the impeller was set to rotate 6 cycles, and the sixth period of the calculation results was selected to be analyzed.
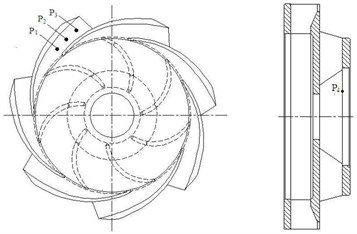
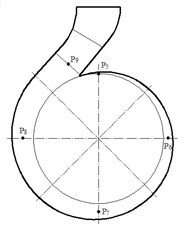
In order to study the pressure fluctuation in the flow channel of radial guide-vane and volute under different flow rate, the monitoring points P1, P2, P3, P4, P5, P6, P7, P8 and P9 are shown in Fig. 5.
Fig. 5Distribution of monitoring point
a) Radial guide-vane
b) Volute
4. Results and analysis
4.1. Comparison with numerical simulation and experiment
Under the design flow rate, the experiment value of head of the two-stage self-priming centrifugal pump is 108.65 m, and the efficiency of the pump is 60.58 %. Standard k-ε model, RNG k-ε model, Standard k-ω model and SST k-ω model is used to simulate the internal flow of the two-stage self-priming centrifugal pump. Numerical results are shown in Numerical results are displayed in Table 3.
Table 3Comparison of different turbulence models
Turbulence model | Head | Efficiency /% | ||
Calculation value / m | Relative error / % | Calculation value | Absolute error | |
Standard k-ε | 106.29 | –2.17 | 61.27 | 0.69 |
RNG k-ε | 106.46 | –2.01 | 61.15 | 0.57 |
Standard k-w | 107.11 | –1.42 | 61.08 | 0.50 |
SST k-w | 107.65 | –1.03 | 60.99 | 0.41 |
Which shows the slightly smaller or larger calculation of head values with four turbulence models in comparison with experiment head value and calculation efficiency value. When comparing experiment data, calculation error with SST k-ω model is minimum. In accordance, SST k-ω model is selected to predict energy characteristics and analyze transient performance of the two-stage self-priming centrifugal pump.
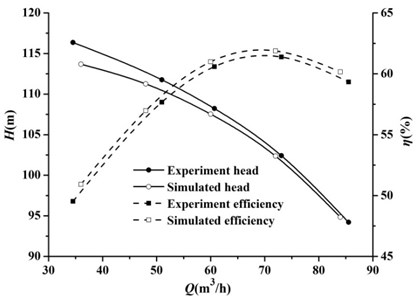
The numerical simulation and experiment of the two-stage self-priming centrifugal pump were carried out, and the results are shown in Fig. 6. As can be seen from Fig. 6, the numerical results are close to the experiment values. The head deviation is less than 3 %, and the efficiency deviation is less than 2 percentage points. The results show that the numerical simulation method is reliable and can accurately predict the energy characteristics of the two-stage self-priming centrifugal pump. It can be seen from Fig. 6 that the high efficiency area of the pump is relatively wide. From the flow rate of 52 m3/h to 85 m3/h, efficiency of the pump is higher than 58 %.
In order to improve the accuracy and repeatability of the data, self-priming time of the pump was measured three times. When the self-priming height is 4 m, the self-priming time was 154 s, 155 s and 153 s. So, the self-priming time of the two-stage self-priming centrifugal pump is 154 s, which meets the requirements of self-priming.
Fig. 6Comparison with numerical simulation and experiment
4.2. Velocity distribution
Fig. 7 shows the relative velocity distributions of middle section in the first-stage impeller under 0.8Qd, 1.0Qd and 1.2Qd. The relative velocities near pressure surfaces of the blades are obviously lower than that near suction surfaces of the blades. With the increase of flow rate, the relative velocity in flow channel of the first-stage impeller gradually increases. Under the 0.8Qd,vortices appear near the inlet of first-stage impeller and the relative velocity distribution in each channel of the impeller outlet is uneven. With the increase of the flow rate, the vortices decrease gradually and the relative velocity in each channel of the impeller outlet becomes well-distributed.
Fig. 7The relative velocity distributions of middle section in the first-stage impeller


a) 0.8Qd

b) 1.0Qd

c) 1.2Qd
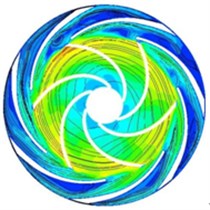
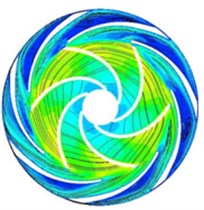
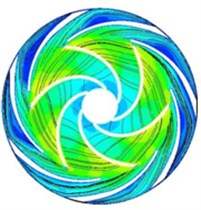
Fig. 8 shows the absolute velocity distributions of middle section in first-stage impeller and guide-vane under 0.8Qd, 1.0Qd and 1.2Qd. The absolute velocities in the inlet of first-stage impeller are smaller and the velocity distributions are more uniform. Under the 0.8Qd, the absolute velocity in the channel of the first-stage impeller is larger than that in the positive of radial guide-vane. And vortices appear in the radial guide-vane. With the increase of the flow rate, the vortices in the radial guide-vane decrease gradually.
Fig. 9 shows the relative velocity distributions of the second-stage impeller under 0.8Qd, 1.0Qd and 1.2Qd. The relative velocity distributions in flow channel of first-stage and second-stage impeller is basically the same. Compared with the first-stage impeller, the relative velocities in the second-stage impeller are lager. The vortices near the impeller inlet are obviously reduced. At the same time, the uneven distribution of velocity at the impeller outlet is relieved.
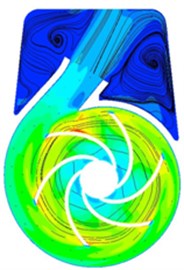
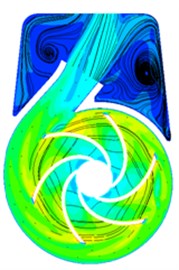
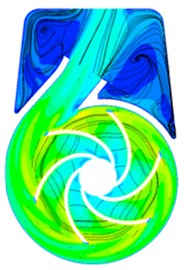
Fig. 10 shows the absolute velocity distributions in the volute and gas-liquid separation chamber under 0.8Qd, 1.0Qd and 1.2Qd. It can be found in Fig. 10 that the absolute velocity distributions in flow channel of second-stage and first-stage impeller are basically the same.
Fig. 8Absolute velocity distributions of middle section in first-stage impeller and guide-vane

a) 0.8Qd
b) 1.0Qd
c) 1.2Qd
Fig. 9The relative velocity distributions of middle section of the second-stage impeller


a) 0.8Qd

b) 1.0Qd

c) 1.2Qd
Fig. 10Absolute velocity distributions of middle section of volute and gas-liquid separation chamber

a) 0.8Qd
b) 1.0Qd
c) 1.2Qd
Due to the influence of volute tongue, there are differences in each channel of impeller, and the absolute velocity in the channel close to the volute tongue is lager. Because the pump is a self-priming pump, the fluid flowing out of the volute outlet enters the gas-liquid separation chamber. Due to the structure restriction of gas-liquid separation chamber, the liquid impacts the wall which generates vortices. The gas-liquid separation chamber is essential in self-priming pump, so the loss of efficiency is inevitable, which is one of the reasons for the relatively lower efficiency of self-priming pump.
4.3. Pressure fluctuation analysis
In order to further analyze pressure pulsation and radial force of the two-stage self-priming centrifugal pump, the unsteady numerical simulation of internal flow in the pump was carried out.
Due to the high-speed rotation of the impeller, periodic rotor-stator interference can be caused at the boundary condition between the outlet of first-stage impeller and inlet of radial guide-vane, which resulted in pressure pulsation in the flow field of radial guide-vane.
4.3.1. Analysis of time domain of pressure fluctuation
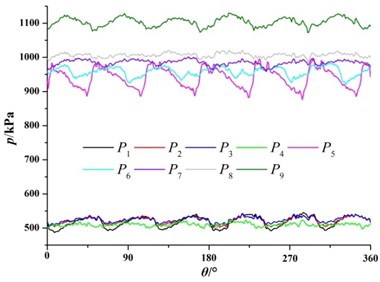
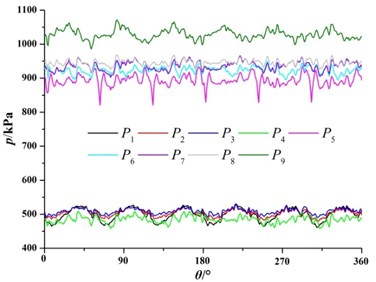
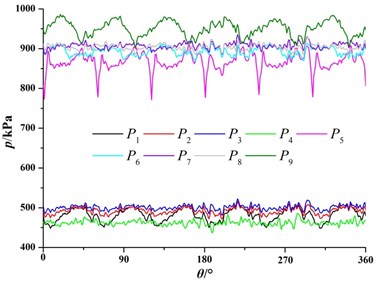
Fig. 11 shows time domain diagram of pressure fluctuation in 9 monitoring points. The horizontal coordinate θ represents angle which the impeller rotates 1 cycle and the longitudinal coordinate P is the static pressure of the monitoring points.
Fig. 11Time domain diagrams of pressure fluctuation at monitoring points
a) 0.8Qd
b) 1.0Qd
c) 1.2Qd
For monitoring point P4in the outlet of radial guide-vane, the average value of pressure fluctuation at P4 under the 0.8Qd is larger. With the increase of the flow rate, the pressure fluctuation at the outlet of the radial guide-vane gradually reduces. This is consistent with the change of pressure in the flow channel of positive guide vane. It as well suggested that the pressure pulsation of the monitoring point P4 does not have obvious periodicity, which is because the monitoring point P4 is far from first-stage impeller outlet and the influence of the rotor-stator interference on the monitoring point P4 is small.
For monitoring point P5, P6, P7, P8 and P9 in volute, pressure fluctuation in volute under different flow rate presents obvious periodicity. Six peaks and six troughs of pressure fluctuation have appeared in volute, which are the same with the blade number of second-stage impeller. This is consistent with the pressure pulsation regularity in the radial guide-vane of first-stage pump. Compared with the pressure fluctuation in the radial guide-vane, the pressure pulsation in volute is significantly larger than that in radial guide-vane. Under the same flow rate, the pressure increases gradually from the volute tongue to the diffuser section. The pressure at the monitoring point P9 in the diffuser section of volute is obviously higher than that at other monitoring points in volute. With the increase of the flow rate, the pressure in volute gradually reduces, and the difference value of the pressure between the three monitoring points is gradually reduced. It can clearly be seen that under the larger flow rate, when impeller blade moves through volute tongue, it causes great pressure fluctuations in the monitoring point P5. Under the small flow rate, this phenomenon is not obvious.
4.3.2. Analysis of frequency domain of pressure fluctuation
In order to quantitatively analyze the pressure fluctuation in the positive guide vane flow channel of radial guide vane, the pressure fluctuation coefficient is defined as followed:
where is the difference between instantaneous pressure and mean value, is fluid density, is circumferential velocity of first-stage impeller outlet.
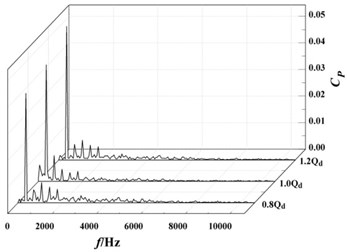
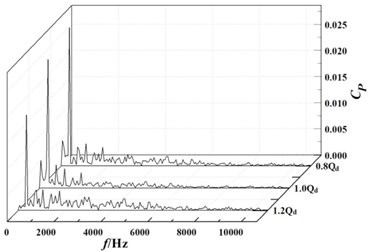
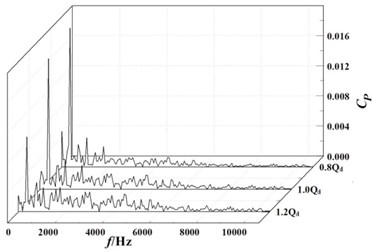
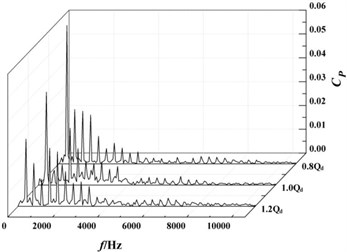
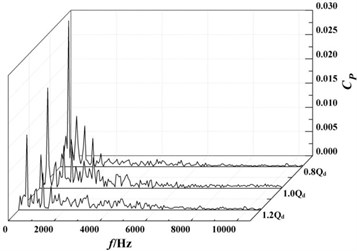
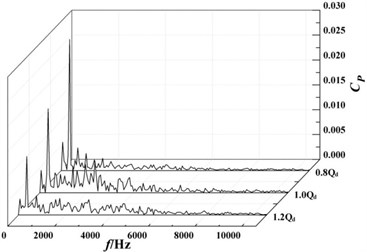
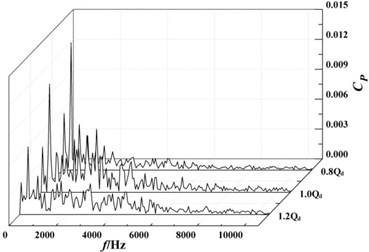
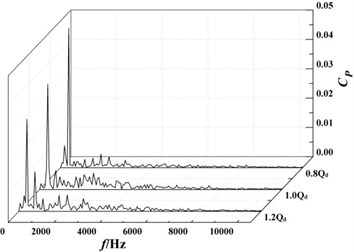
The pressure fluctuation coefficients were calculated with the Eq. (1). And the frequency domain diagram of the pressure fluctuation coefficients at monitoring points were obtained with fast Fourier transform, as shown in Fig. 12.
As it can clearly be seen from the Fig. 12(a), 12(b) and 12(c), pressure fluctuations at the monitoring points , and are not obvious in the high-frequency region, while there was a significant pressure pulsation in the low-frequency region. The maximum value of pressure fluctuation coefficient corresponds to the frequency of about 354 Hz, which is the passing frequency of first-stage impeller blades. And with the decrease of the flow rate, the pressure fluctuation coefficient in the low frequency region at the same monitoring point gradually becomes larger. For example, the pressure fluctuation coefficient at the monitoring point increases from the 1.2 of 0.041 to the 0.8 of 0.050, which causes the pressure fluctuation coefficient to increase by 21 %. Under the same flow rate, the pressure fluctuation coefficient at the monitoring point is the maximum, and the pressure fluctuation coefficient at the monitoring point is the minimum. For example, under the design flow rate, the pressure fluctuation coefficient at the monitoring point is 0.044, and the pressure fluctuation coefficient at the monitoring point is reduced to 0.017, which is equivalent to a reduction of 61 %. This is because the monitoring point is located in inlet of stationary radial guide-vane close to the outlet of rotating first-stage impeller. Thus, the effect of the rotor-stator interference at the monitoring point is the biggest. With the monitoring location moving away, the effect of the rotor-stator interference gradually becomes smaller.
It can be seen from Fig. 12(d) to 12(h) that pressure pulsation tendency in the volute and are basically the same in the positive guide-vane of radial guide-vane. The pressure fluctuation coefficient decreases with the increase of flow rate. At the monitoring point , pressure fluctuation coefficient is reduced from the 0.8 of 0.058 to the 1.2 of 0.028. And the frequency corresponding to the maximum value of the pressure fluctuation coefficient at monitoring points in the volute is all about 354 Hz, which is the pass frequency of the second-stage impeller blade. Under the same flow rate, the pressure fluctuation at the monitoring points in the spiral flow channel of volute is gradually reduced with moving away from the volute tongue. Under the design flow rate, the pressure fluctuation coefficient is reduced from the monitoring point of 0.039 to the monitoring point of 0.011, which is reduced by about 70 %. After fluid moving into the diffusion section of the volute, the pressure and the pressure fluctuation coefficient increase rapidly.
Fig. 12Frequency domain diagrams of pressure fluctuation at monitoring points
a)
b)
c)
d)
e)
f)
g)
h)
4.4. Radial force analysis
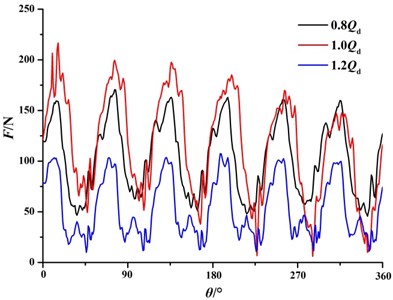
Time domain diagrams of radial force on the wall of radial guide-vane at the 0.8, 1.0, 1.2 are shown in Fig. 13. It can be seen from Fig. 13 that the radial force on the wall of the radial guide-vane is obviously periodic. With the increase of flow rate, the radial force on the wall of the guide-vane gradually reduces. Under different flow rate, the radial forces on the wall of the radial guide-vane are all small. It can only be 125 N under the small flow rate. This is because the radial guide-vane is a central symmetrical hydraulic component. The radial force on the wall of radial guide-vane generated by the fluid is mostly offset.
Fig. 13Time domain diagrams of radial force on the wall of radial guide-vane
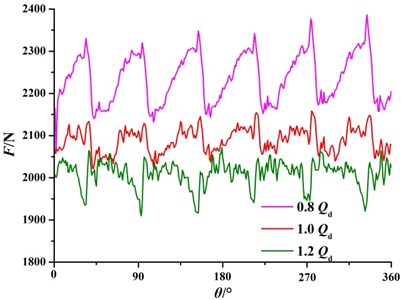
Time domain diagrams of radial force on the wall of volute under different flow rate are shown in Fig. 14. It can be seen from Fig. 14 that compared with the wall of the radial guide-vane, radial force on the wall of volute is larger. This is because the volute is a non-central symmetrical hydraulic component. Under the 0.8, the average radial force on the wall of volute is about 2240 N. And with the increase of flow rate, the radial force on the wall of volute is gradually getting smaller and smaller, which is only about 1990 N under the 1.2. At the same time, the fluctuation of the radial force also decreases with the increase of flow rate.
It can also be seen from Fig. 13 and Fig. 14 that radial force on the wall of volute is nearly 20 times larger than that on the wall of the radial guide-vane. So, the central symmetrical hydraulic component can offset the radial force generated by the fluid flow.
Fig. 14Time domain diagrams of radial force on the wall of volute
5. Conclusions
Through analyses on numerical results and experiment data in a two-stage self-priming centrifugal pump, the following conclusions can be obtained.
1) Under the design flow rate, experiment head of the pump is 108.65 m and experiment efficiency of the pump is 60.58 %. High efficiency area of the pump is relatively wide. Efficiencies of the pump are all higher than 58 % in the flow range of 52 m3/h to 85 m3/h. When the self-priming height is 4 m, the average self-priming time of the pump is 154 s, which meets the design requirements of the self-priming centrifugal pump.
2) The numerical simulation method in this paper is reliable and can accurately predict the energy characteristics of the two-stage self-priming centrifugal pump. The numerical calculation results with SST - turbulence model is close to the experiment values, head deviation is less than 3 %, and efficiency deviation is less than 2 percentage points.
3) With the monitoring point moving away from inlet of the radial guide-vane, pressure fluctuation coefficients in the guide vane decrease. Compared with monitoring point , the pressure fluctuation coefficient at monitoring point under the design flow rate is reduced by 61 %. The pressure fluctuation coefficient in the spiral flow channel of volute gradually reduces with the monitoring point moving away from the volute tongue. Compared with monitoring point , the pressure fluctuation coefficient at the monitoring point under the design flow rate is reduced by 70 %.
4) The radial force on the radial guide-vane is obviously smaller than that on the volute. Under the same flow rate, radial force on the volute of second-stage pump is almost 20 times larger than that on the radial guide-van of first-stage pump.
References
-
Yedidiah S. Analayzing suction performance of centrifugal pumps. Plant Engineering, Vol. 28, Issue 20, 1974, p. 69-72.
-
Sato S., Furukawa A., Takamatsu Y. Influence of impeller blade angles of centrifugal pump on air/water two-phase flow performance. Transactions of the Japan Society of Mechanical Engineers B, Vol. 59, 1993, p. 3513-3518.
-
Lane N. E., Minneaplis M. N. Self-priming pumps. World Pumps, Vol. 1996, Issue 426, 1996, p. 22-24.
-
Hubbard B. Self-priming characteristics of flexible impeller pumps. World Pumps, Vol. 2000, Issue 405, 2000, p. 19-21.
-
Shepard J. Self-priming pumps: an overview. World Pumps, Vol. 2003, Issue 444, 2003, p. 21-22.
-
John K. Self-priming pump centrifugal pumps: a primer. World Pumps, Vol. 2004, Issue 9, 2004, p. 30-32.
-
Wang Y., Peng S., Liu R. H., et al. Numerical simulation of pressure fluctuation in self-priming vortex pump. Journal of Drainage and Irrigation Machinery Engineering, Vol. 33, Issue 7, 2015, p. 583-588.
-
Henke J. The hygienic self-priming GEA TDS® – VARIFLOW centrifugal pump of the TPS series. Trends in Food Science and Technology, Vol. 20, Issue S1, 2009, p. 85-87.
-
Han J. Y., Chen J. Y., Liu Y. B. Study of vertical multiple self-priming centrifugal pump. Coal Mine Machinery, Vol. 27, Issue 3, p. 410-411.
-
Wang C. Investigation on Energy Loss and Self-Priming Mechanism of Low-Specific-Speed Multistage Self-Priming Spray Irrigation Pumps. Zhenjiang, Jiangsu University, 2016.
-
Yutaka K., Tomoshige T., Sakuichiro U. Prediction of system instability by measuring the dynamic characteristics of prototype multistage centrifugal pump. Technical Review Mitsubishi Heavy Industries, Vol. 25, Issue 3, 1988, p. 160-164.
-
Plutcki J., Skrzypace J. CFD simulations of 3D flow in a pump stator with a spherical surface. World Pumps, Vol. 2003, Issue 443, 2003, p. 28-31.
-
Cukurel B., Lawless P. B., Fleeter S. Particle image velocity investigation of a high speed centrifugal compressor diffuser: spanwise and loading variations. Journal of Turbo machinery, Vol. 132, Issue 2, 2010, p. 1-9.
Cited by
About this article
The authors gratefully acknowledge the support from the National Natural Science Foundation of China (Grant No. 51509109), the Industry-University-Research Cooperative Innovation Fund of Jiangsu Province of China (Grant No. BY2014123-09), the Science and Technology Support Program of Jiangsu Province of China (Grant No. BE2014116), China Postdoctoral Science Foundation(Grant No. 2016M600370), Postdoctoral Scientific Research Project of Zhejiang Province of China, and Priority Academic Program Development of Jiangsu Higher Education Institutions (PAPD).
Wang Kai designed the experiment schemes and numerical schemes of the two-stage self-priming centrifugal pump. Liu Houlin designed the two-stage self-priming centrifugal pump. Jiang Linglin made the unsteady numerical calculation of the pump and analyzed unsteady performance of the pump. Zhang Zixu and Li Yu made energy characteristics experiments and self-priming experiments of the pump.

