Abstract
Aiming at the skew and misalignment between the inner and outer rings of the spindle bearing during the installation process, a new method for detecting the spindle bearing assembly state is proposed combined an improved maximum correlated kurtosis deconvolution (IMCKD) and support vector machine (SVM). The vibration and impulse signals induced by bearing assembly skew or dislocation are quite weak. In this paper, the collected vibration signals were preprocessed by IMCKD algorithm with optimized parameters between the normal and skewed state of the outer rings at first, which aims to deconvolve periodic impulse characteristic and enhance the periodic impulse component from a new assembly spindle vibration signal. Then, wavelet packet decomposition method was adopted to extract the characteristic energy value of different frequency bands, and the eigenvector of the assembly state of the spindle bearing was calculated. Furthermore, the support vector machine classification method is implemented to analyze the eigenvectors under different assembly states. Finally, the proposed method was verified by experimental results. The results show that the IMCKD and SVM methods can effectively detect the bearing assembly skew state of the spindle with an accuracy of more than 95 %.
1. Introduction
As rolling contact ball bearings are commonly used in high-speed spindle and one of the most vulnerable components as well, their heat generation, stiffness and vibration characteristics have attracted lots of attention [1-5]. How to detect the quality of bearing assembly state is a major challenge in the practical application since its quality directly affects the performance of the spindle system.
Typically, the bearing states are difficult to determine in a sophisticated spindle system due to some uncontrollable factors during the assembly process. Such as wrong design, bad spindle parts, improper mounting of the spindle bearings, and bad operation of the operators. However, most of them can be detected through signal processing methods except the improper mounting, because the present research in this area has not been established. Besides, the previous studies pay more attention on the performance of the spindle system when the bearings suffer imbalance load [6-8]. Moreover, the skew and dislocation state of bearings are the most common states for a new assembly spindle during the running attrition test process. So how to extract the weak impact component induced by the skew installation of the spindle bearing is the principle problem. For weak fault of the machinery and equipment, the most important thing is how to extract effective feature information from measured signals [9-11].
In recent years, the application of weak fault signal extraction in spindle bearings has made significant progress [12-14]. Jiang proposed an improved method to accumulate envelope spectrum of all or part of sub-band signals rather than to demodulate selected sub-band signals, which was more robust to stochastic impulse disturbance and was able to capture weak period information as compared with FIR-based or WPT-based kurtograms [15]. Bin employs the EMD to decompose the reconstructed signal, and then the early fault diagnosis of the bearing is obtained based on the BP (back propagation) neural network classification with the calculation of the energy of each IMF as the eigenvectors [11]. Sawalhi adopts the minimum entropy deconvolution (MED) method on bearing fault diagnosis and achieve excellent results by eliminating the impact of bearing failure overlap phenomenon [16]. Antoni and Randall first proposed the short time Fourier transforms filter-based and finite impulse response filter based on spectral kurtosis (SK) to efficiently detect incipient faults [17]. However, the drawback of SK is that the method may fail in effectively detecting transients with a low signal to noise ratio. To remedy this drawback, a new time-frequency analysis method named minimum entropy deconvolution (MED) was originally proposed by Wiggins for application on seismic recordings [18]. On the basis of the MED algorithm, McDonald proposed a novel deconvolution algorithm for the detection of bearing faults from vibration data. The proposed MCKD method takes advantages of the periodic nature of the faults as well as impulse-like vibration behavior associating with most types of faults [19]. Considering that the kurtosis coefficient can be used to describe the convexity of the peak of the vibration signal, which is consistent with the axial impact characteristics caused by the deflection of the inner or outer rings of the spindle bearing. However, the MCKD algorithm unable to effectively extract the impact composition of weak fault signal under variable rotation speeds. Moreover, the effect of noise reduction is strongly influenced by selected parameters based on the experience of the operator. Therefore, an improved MCKD method is studied through grid search algorithm with global optimization to automatically search for the optimal parameter.
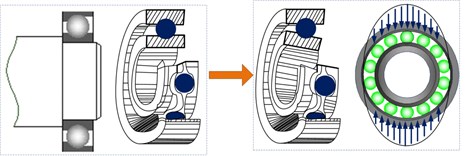
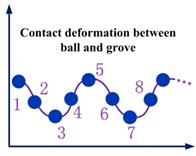
However, it is a challenge to develop and adopt effective signal processing techniques that can extract key information from the vibration signals of a newly assembly spindle bearing system. There is no obvious definite fault signal present in the measured signals. Literature reviews show that most of researches were used to focus on the defects in the spindle system [20-23]. Such as where is the damage occurred or what fault type is in the bearing. However, few people focus on the detection of spindle assembly quality. For a newly assembly spindle, there is no definite defect in the internal components in general when the bearing in the assembly process. For example, in practical engineering small assembly errors will be inevitably occurred in a spindle system, especially for the spindle bearings. Assembly quality problems (such as skew or misalignment of bearings) may accompany the assembly process due to differences in the proficiency of the assembler. Moreover, for the high-speed and high-precision spindle system, contact angle and contact pressure of the rolling bearing will change due to uneven thermal deformation, which will result in a weak periodic weak impact for the spindle system, as shown in Fig. 1. Therefore, it is necessary to carry out the state detection of the bearings whether it is a newly assembly spindle or the actual application one.
Fig. 1Contact deformation caused by the bearing internal cyclical impact load
a)
b)
However, the ultimate goal of the diagnosis is how to detect the improper mounting state of the assembly spindle bearing. So, how to diagnosis the bearing state with a high accuracy is another challenge for researchers. SVM, as a machine learning method, has been recognised by researchers in fault monitoring and diagnosis field because of its feasibility and effectiveness in mechanical fault diagnosis [23-27]. Rojas studies the application of support vector machines in the detection and classification of rolling element bearing fault. This proposal makes the classification procedure fast and effective [28]. Yang utilized the IMFs as the input of SVM to classify the bearing faults and achieved remarkable results [29]. Rajeswari proposes a multi-fault classification method, which contains four fault conditions of the bearing. Then the feasibility of the proposed multi-fault diagnosis is verified by comparing the classification accuracy and calculation time [30]. Abbasion combines the wavelet denoising and support vector machine for rolling element bearings multi-fault classification. The results show that the proposed method is fully agree with empirical results [31]. Ziani et al. proposed a method that combines support vector machines and binary particle swarm optimization algorithm in order to maximize the separability of classification. The experimental results show that this method has a beneficial effect on bearing health assessment and fault diagnosis by selecting the regularized Fisher Criterion as a fitness function [32].
In this paper, by combining the IMCKD and SVM methods, the detection and classification of the assembly quality of the spindle bearing are studied. The remaining parts of this paper are organized as follows. In Section 2, the new improved MCKD algorithm is put forward and the SVM algorithm is briefly described. An improved MCKD algorithm was employed to denoise the original signals and to highlight the continuous pulses, which are masked by strong noise. Section 3 introduces the experimental setup and descripts the certification of assembly quality for spindle bearing. Then the signals after noise reduction are processed by wavelet packet at a precise decomposition level. The energy distribution in the different frequency bands of the wavelet packet is calculated by analyzing the energy distribution of the vibration signal, which is used as the eigenvector of the assembly state of the spindle bearing. In Section 4, the results and discussions of the proposed method are given. The characteristic vectors of the vibration signal are introduced to construct the eigenvectors to characterize the installation of the bearing. The comparative studies show the priority of the method proposed in this paper. Finally, in Section 5, we conclude the results of this study and give the prospect research in the future.
2. Algorithm design
The proposed IMCKD method combines MCKD with grid search method to maximize the advantage of MCKD in extracting the impulse signal from the measured signal and utilizes the powerful of grid search method in global optimization for searching the optimal parameters.
2.1. Maximum correlated kurtosis deconvolution method
Starting from the collected discrete vibration acceleration signal xn, it can be expressed as the output of the input bearing vibration impact signal yn through the path transfer attenuation response hn, then we have the equation:
The algorithm of MCKD aims to recover the signal yn by applying a FIR filter f to the acquired signal xn:
where:f=[f1,f2,⋯,fL]T is the coefficient of the filter with the length of L.
The maximization of the correlated kurtosis indicator is treated as the optimization target in the MCKD algorithm by combing Eq. (1) and Eq. (2), and then the M-shift of correlated kurtosis CKM(T) is derived as:
The correlation kurtosis is suitable for measuring the pulse sequence with a specific period in the spindle vibration signal because of consideration of the periodic characteristics of the impact component. Compared with kurtosis, correlation kurtosis emphasizes the continuity of the impact component and was employed in this section. The filter coefficient f, which corresponds to the maximum correlated kurtosis, can be obtained by solving the derivatives of the numerator and denominator of CKMT:
where k= 1, 2, …, L: The Eq. (4) can be rewritten as a matrix form as:
The matrix X0XT0 is the autocorrelation matrix of x. The inverse (X0XT0)-1 is assumed to exist, and the filter coefficients are described as:
In general, experimental signals will be significantly improved by using a higher shift M, which usually takes 1-7. The impact characteristic is enhanced with the increase of the shift M because of the sequential impact of the deconvolution method. However, higher order shifts require better estimates of the impulse period T and increase the complexity of the calculation. When M> 7, solving accuracy will be decreased due to the iteration method is beyond the scope of floating-point index. Therefore, it is necessary to determine the order of the optimal filter L and the period T to maximum the effect of MCKD method. In this paper, grid search method is introduced to automatically calculate L and T from the constraint function values on the grid points within the given region. The problem of nonlinear programming in grid search is expressed as:
where T= (T1, T2, …, Tn), Tn is independent variables and the number of T is n; Ts= (T1s, T2s, …, Tns), Tns is the lower limit of T, Tf= (T1f, T2f, …, Tnf) and Tf is the upper limit of T. The search parameters are divided into a grid in a certain spatial range. The optimal solution of the corresponding point of the object function is gained by grid search method. In order to highlight the impact of the signal, the value of kurtosis is employed as the criteria of the output signal. The kurtosis is defined as:
In this paper, the kurtosis value of the signal with the maximum correlation kurtosis is used as the objective function. Eq. (10), which is nonlinear, can be solved iteratively through the following procedures:
1) Firstly, initialize the range and search step in the grid search, the step is set to 1, the period search scope is [2, fs/2] (fs is the sampling frequency). Then a two-dimensional grid is constructed on the coordinate system of L and T.
2) The current parameter is evaluated according to the kurtosis value of the signal after the maximum correlation kurtosis deconvolution. XT, XT0, (X0XT0)-1 can be calculated based on the test signal xn;
3) Initiate the filter coefficients f with L samples and calculate the output signal yn by using Eq. (9);
4) Compute αm, β based on signal yn respectively and update the filter coefficient f by Eq. (10);
5) Compute the change of the kurtosis during iteration. Determine whether the difference between iterations ΔCKm(T) is less than the given threshold. If the criterion is satisfied, the search progress will stop; otherwise, the search progress is reverted back to step 3.
6) The final output deconvolution signal can be obtained by Eq. (9), and the vibration signal is obtained after processing by IMCKD method.
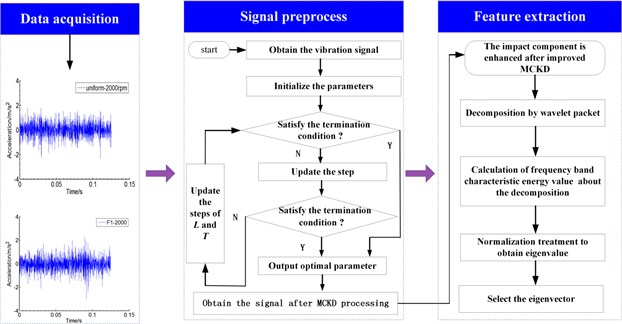
The detailed flow chart is illustrated in Fig. 2. The signal preprocess is completed and yn with the enhanced impact is obtained after the above steps. Then the wavelet packet transform (WPT) method is introduced in this paper on the processed signal to show the energy distribution in the time-frequency domain.
Fig. 2Signal preprocessing and feature extraction
2.2. SVM theories
This section briefly summarizes the principles and the procedure of SVM. The states of the spindle bearing are simplified into two categories (perfect assembly and skew installation). Suppose the spindle bearing sample data is X based on the collected acceleration signals under the two different assembly states, where xi∈Xn. The frequency band energies of the signal are taken as the state eigenvectors according to subsection 2.1. Given the state set of spindle bearing Ψ, ψi∈{0,1}, (where 0 represents the normal state and 1 represents the skew state of bearing). Bearing assembly quality state detection model is established based on the data set. So, the bearing quality state classification is attributed to a quadratic programming problem. The equations can be obtained based on the SVM principle:
Subject to:
where: xi is the input vector of the support machine, xi∈Rn, ψi is the category of xi, ψi∈{0,1}; w is the hyperplane normal vector; ξ is slack variable and C is a penalty factor. Radial basis function is selected as the kernel function of the SVM algorithm.
Fig. 3Flowchart of the proposed methodology
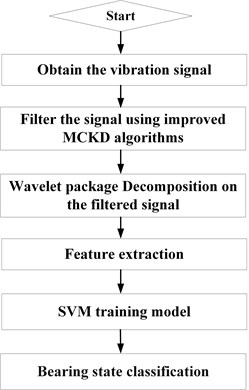
In summary, the flow chart of the proposed method is illustrated in Fig. 3. Based on the principle above, the SVM algorithm is described as follows:
1) According to the eigenvectors X= {x1, x2, …, xi} extracted in subsection 2.1, the training parameter set is established based on the SVM principle and the tag is built corresponding to the state class.
2) The training sample data are mapped to the high-dimensional feature space through the kernel function and the nonlinear case can be solved.
3) Then the SVM optimization algorithm is utilized to obtain the parameters γ, d and the C as well as the support vector α.
4) Hence the bearing quality state detection model is established through the support vector α.
5) Input the eigenvectors of different conditions to the established model in order to achieve the bearing assembly quality identification.
3. Experimental setup
3.1. Experimental spindle system design
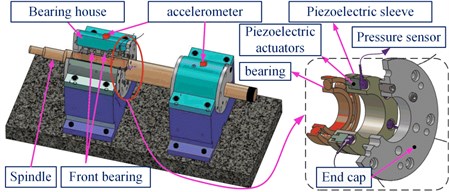
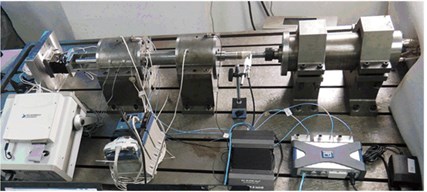
In order to verify the proposed methodology, an experimental spindle was constructed for diagnosing the bearing assembly quality. A motorized spindle, whose maximum rotating speed is 10000 r/min, is connected to the experimental mechanical spindle via elastic couplings. A servo system was employed to control the operation of the motorized spindle. The details of the spindle are shown in Fig. 4. Four NSK7014C angular contact ball bearings were employed in this spindle system, which are back to back arrangement (double O arrangement). The deviation of the bearing installation can be accurately achieved through a specially designed mechanism. As shown in the details of Fig. 4, this is the separately designed and constructed to apply the external axial preload on the outer ring to simulate the skew installation of bearings. Moreover, there is no external load applied on the spindle in order to minimize the impacts of external factors.
Fig. 4Structure sketch of the experimental test platform and location of the transducer
a)
b)
3.2. Design of the special loading device
In the spindle test system, three blind holes were designed and uniformly distributed in the end of the bearing spacer. The piezoelectric actuators were placed in these blind holes. Furthermore, the force applied on the bearing’s outer ring was displayed on computer in real time via a capacitive pressure sensor connected with the rear actuator. So, the preload applied on the bearing outer ring can be precisely controlled with the piezoelectric actuators and pressure sensors. The skew level of outer ring can be varied through the preload value. The structure and function of the preloading part are shown in Fig. 5.
Fig. 5Preload applied on the bearing outer ring

3.3. Program of the experimental system
As shown in Fig. 5, the deviation of the bearing outer ring is achieved by adjusting the preloads of F1, F2, and F3 applied on the outer ring of the bearing. The bearing is assumed as a rigid body. The force applied on the bearing is represented by a vector. This subsection gives expressions of the principal vector and the principal moment of applied force which are simplified toward center of the bearing according to space force theory. A principal moment and vector in relation to applied preload act on the outer ring: the moment is responsible for their deviation and the vector for their shift. The force points applied on the out ring are uniformly distributed around the axis. So, the principle vector and moment are expressed as:
where: i= 1,…, n. R is the distance from the force action point to the center of the bearing. In this experiment, three loading points were selected due to bearing outer ring size, sensor volume and other factors, so the variable i is 3.
According to the recommended bearing preload in NSK “Precision Rolling Bearing” product manual and considering the installation form of the bearings, a reasonable preload range is determined. The lower limit of preload is the smallest preload to prevent the roller slip and the upper limit is the maximum of the recommended value. Vibration acceleration signals were sampled with the data acquisition instrument Brüel&Kjær and then transmitted to a PC which was used for data storage and signal processing. The sampling frequency was set as 8192 Hz. Also, a 4096 bandwidth is set concomitantly during experimental procedure and the spindle speeds up to 8000 r/min. Two vibration acceleration sensors were employed in this signal measuring system, which were arranged on the front and rear of the spindle house, respectively. Experimental data were gathered under different rotation speeds, and different conditions.
As can be observed in subsection 3.2, the skewing level of the bearing is precisely quantified by the preload value. Deviation degree of the bearing is upon the preload condition. Each preload level is divided into uniform and skew condition. All of the experiment vibration signals were tested under light preload, middle preload and heavy preload conditions. Six altered working conditions C10-C30 were tested at each rotation speed (2000 r/min, 4000 r/min and 8000 r/min). A total of 18 groups of the sampling data were collected. Comparative analyses of the sampling data were done under different conditions.
Table 1Test conditions of spindle bearings (2000/4000/8000 rpm)
Bearing condition | |||
Condition tag | F1 (N) | F2 (N) | F3 (N) |
C10 | 400 | 200 | 200 |
C11 | 200 | 200 | 200 |
C20 | 800 | 400 | 400 |
C21 | 400 | 400 | 400 |
C30 | 1200 | 600 | 600 |
C31 | 600 | 600 | 600 |
4. Experimental results and discussions
4.1. Time-frequency analyses of vibration signals
In this section, the vertical radial Z direction of the measured signal is selected to analyze the bearing assembly state in the time domain. The signals present no difference between perfect mounting and incorrect mounting conditions due to the strong noise. There is no obvious regular impact characteristic under the skew installation.
Then frequency domain analysis method is employed to further analyze the signal and the signals were subjected to fast flourier transform (FFT) to obtain the spectrum, as shown in Fig. 6. It can be found that there is a noteworthy difference in the frequency range of 1500 Hz-3000 Hz. Moreover, comparative analyses under the skew and perfect conditions show that the frequency components are obviously different. There are highlight frequencies at 1800 Hz and 2700 Hz for the bearing skew condition (C10), as shown in Fig. 6(a). Fig. 6(b) shows that highlight frequencies are more prominent at 1500 Hz and 2700 Hz under perfect installation condition. However, the frequency does not serve as an evaluation criterion to determine whether the bearing is installed perfect or not, and the bearing does not present one or several definite fault frequencies under skew conditions. So, it is not possible to determine whether the bearing is skew state or not by searching the specific fault frequency. This is different from the traditional bearing fault diagnosis, whose main purpose is to find the definite fault frequency. Fault characteristic frequencies of this test spindle bearing are listed in Table 2.
Fig. 6Frequency domain signal under conditions C10-C11

a)

b)
Table 2Fault characteristic frequencies of rolling ball bearing
Pitch diameter D (mm) | Number of balls Z | Ball diameter d (mm) | Fault characteristic frequency of inner ring (Hz) | Fault characteristic frequency of outer ring(Hz) | Rolling fault characteristic frequency (Hz) | Inner ring rotation frequency (Hz) |
69.9305 | 14 | 12.7 | 6328 | 2487 | 177.89 | 66.7 |
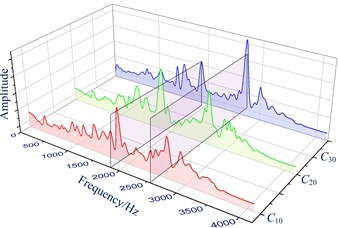
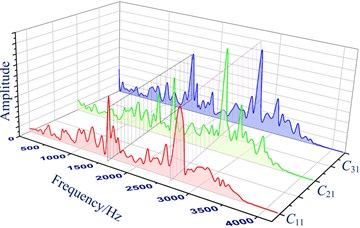
Fig. 7Frequency domain under conditions C10-C20-C30 and conditions C11-C21-C31
a)
b)
According to Table 2, there is no fault characteristic frequencies appeared in the newly assembled bearing. Moreover, it is also difficult to find the definite fault characteristic frequency in Fig. 7. Therefore, time and frequency domain methods cannot be used to estimate whether the bearing is installed perfectly or not, which limits its application on the spindle bearing installation status inspection.
Fig. 7 demonstrates that the regular characteristics of the frequency can be found through comparative analysis under different skewing levels (C10-C20-C30). It can be seen that there are some obvious frequency prominent points at 1800 Hz, 2650 Hz and 2900 Hz. However, the obvious frequencies are highlighted at frequencies around 1650 Hz and 2600 Hz of the bearing under normal state (C11-C21-C31).
4.2. Spindle bearing status classification
4.2.1. Eigenvector selection and calculation
The characteristic spectrum presents the same trend under the similar conditions based on the analysis in subsection 4.1. We found that the changing of relevant frequency component represents a certain installation state of the bearing. So, the bearing can be determined by analyzing the energy distribution of the measured signals.
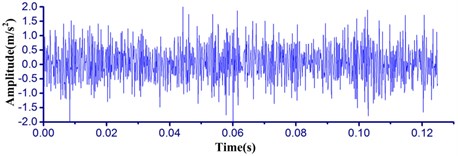
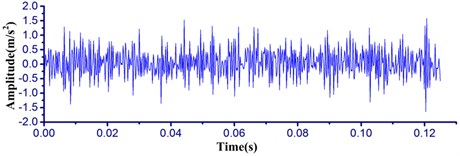
According to the sampling frequency and the spindle rotation frequency, the best parameter search center of the IMCKD algorithm Ts is 33.3 since the analyzed signal was acquired at the rotation speed of 2000 r/min. In order to optimize the extracting effect of the impact component, the shift order of M= 7 was chosen. The best filtering parameter L is automatically optimized aiming at the maximum signal kurtosis value through the proposed grid search algorithm.
Fig. 8The time waveform of the signal: a) original signal, b) filtered signal with IMCKD
a)
b)
The proposed IMCKD method is processed in order to highlight the impulse components which are insensitive to the change of the bearing state. Fig. 8 shows that the comparison results between the original signal (Fig. 8(a)) and the filtered signal by IMCKD algorithm (Fig. 8(b)). It can be observed in the figure that the signals filtered by the proposed method have better highlighted impact characteristics. The larger amplitude of the impact vibration is restrained, and the smaller amplitude is reflected through the comparative analysis about the impact amplitude.
4.2.2. Bearing state identification methodology
After being processed with IMCKD, feature extraction method is the second critical step for identifying the bearing states. The bearing assembly state indicator should show the correction to the change of the bearing assembly condition. It is necessary to note that the denoised signals are processed by the WPT in the feature selection process and energy eigenvectors are calculated in different frequency bands. Then normalized processing was having done as the input eigenvector of the SVM model.
The db1 wavelet was employed in this paper and the decomposition level was 3 according to experience. Eight corresponding packets were obtained during the wavelet packet decomposition calculation. The upper limit of signal analysis frequency, 4096 Hz, was determined from the sampling frequency based on Shannon's Theorem. The energy distribution of the vibration signal was obtained by the coefficients of the different frequency bands after the WPT. The energy values in each band were normalized to indicate the installation skew conditions. 100 sets of experimental data were selected, and the results of the final calculated eigenvalue were averaged, as shown in Table 3, each condition consists of 6 sets of data.
Table 3Energy eigenvalue of different frequency band after normalization
Node | 1 | 2 | 3 | 4 | 5 | 6 | 7 | 8 |
Frequency band f / Hz | 0-512 | 512-1024 | 1024-1536 | 1536-2048 | 2048-2560 | 2560-3072 | 3072-3584 | 3584-4096 |
C10 | 0.178 | 0.147 | 0.535 | 0.480 | 0.141 | 0.282 | 0.382 | 0.411 |
C20 | 0.125 | 0.121 | 0.486 | 0.399 | 0.142 | 0.288 | 0.452 | 0.486 |
C30 | 0.185 | 0.155 | 0.476 | 0.447 | 0.162 | 0.284 | 0.410 | 0.465 |
C11 | 0.189 | 0.118 | 0.340 | 0.406 | 0.178 | 0.355 | 0.411 | 0.576 |
C21 | 0.123 | 0.096 | 0.373 | 0.361 | 0.151 | 0.333 | 0.444 | 0.605 |
C31 | 0.166 | 0.166 | 0.295 | 0.327 | 0.190 | 0.374 | 0.393 | 0.650 |
As shown in Fig. 9, the energy distribution under each sub-bands corresponding to different bearing conditions which can be clearly distinguished from the eigenvectors. The signal energy value presents increase in some band range while presents decrease in another band range.
Fig. 9Eigenvalues under different conditions
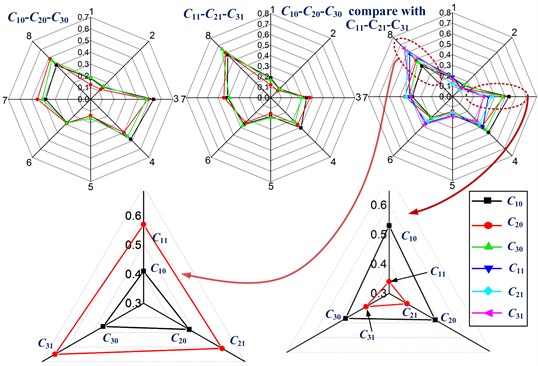
Moreover, the difference is becoming more pronounced with the increase of the bearing skewing level. This suggests that the sub-band energy value is a good bearing installation state indicator. In Fig. 9, the number 1, 2, …, 8 represent the different frequency bands (as shown in Table 3). The six separate lines in the figure represent the average of the energy characteristics of the sub-bands calculated under six installation conditions. The energy of the different bands changes significantly when the bearing installation was skewed compared to the perfect installation conditions, and these three sets of similar conditions present the same trend. In the frequency range of 1034-1536 Hz, the eigenvector of bearings skew state (under conditions C10/C20/C30) is 0.41/0.48/0.46, while the eigenvector is 0.57/0.61/0.65 corresponding to a perfect state (conditions C11/C21/C31). However, at the node 8 with the frequency range of 3584-4096 Hz, the eigenvector is 0.34/0.37/0.39 under the conditions C11/C21/C31, while the eigenvector is 0.58/0.48/0.47 under conditions C10/C20/C30. Fig. 12 demonstrates that the wavelet packet eigenvectors can be used as characteristics of the bearing installation state classification. The number of eigenvector is eight under each condition, that is, the dimension of the sample eigenvector is eight, and then samples were selected for classification experiments.
In the SVM classification training, the state classification model of the bearing was established according to the eight eigenvectors in Table 3. There is a total of 200 sets of sampling data in the classification model for each condition. For these data sets, 50 % data was used for training the SVM model while the others were used for testing.
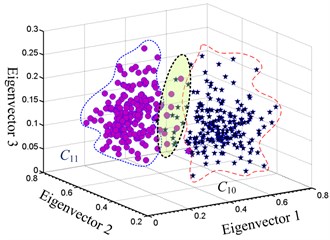
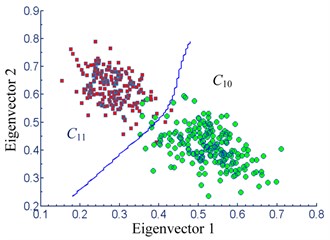
The parameters c= 17.82 and g= 6.89 were obtained based on the calculation. The accuracy of the classification is 94 %. The diagnosis performances of the datasets using proposed method are shown in Fig. 10. It can be seen that the energy distribution of the bearing vibration signal is relatively concentrated in the perfect installation state. However, the energy distribution of the vibration signal presents relatively dispersed under skew condition.
Fig. 10Classification performance based on the proposed method
a)
b)
The classification results show that the installation state of the bearings can be accurately detected under the experimental conditions by the proposed IMCKD and SVM method. The details of the experimental results under different conditions were presented in Table 4. Wavelet noising reduction processing method was adopted to diagnose the bearing state to show the superiority of our proposed method. The results demonstrate that the accuracy of the bearing installation is 83 % by using the wavelet de-noising method, and most of the bearing outer ring skewing states will be misdiagnosed as the perfect state. The main reason for the poor accuracy classification of the consequences may be the invalid effective impact of the characteristics. It can be observed that the classification accuracy of the installation state of bearing depends on the pretreatment of the measured signal.
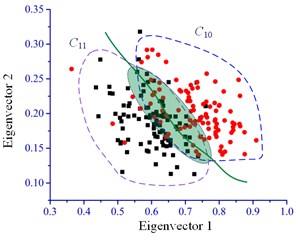
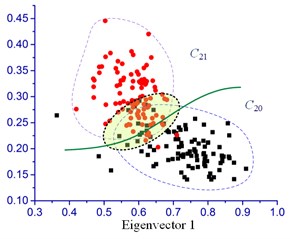
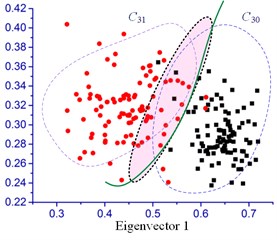
Other diagnose tests were also conducted in order to validate the advantage of the proposed IMCKD method. The test conditions are the same as above section, the classification results are shown in Fig. 11. Although there are obvious dissimilarity eigenvectors between C10 and C11 (C20 and C21, C30 and C31) conditions, this method fails to diagnose the bearings assembly with a high accuracy. The classification performance demonstrates that all of the accuracy is less than 80 % based on MCKD and SVM method. In engineering applications, it is unacceptable of the diagnostic with such a low accuracy. The proposed method can produce satisfactory results on extracting the impulse components and reach a high accuracy.
Therefore, preprocesses on the original signal seem to have been a greater influence on the classification accuracy. This highlights the feasibility and reliability of the IMCKD algorithm proposed in this paper in the applications of the newly assembled spindle bearing installation quality inspection.
In general, the impact characteristics of the bearings are obviously enhanced by the method proposed in this paper. The classification accuracy can reach more than 95 % by highlighting the characteristic frequency of the singles. Moreover, with the increase of the rotation speed, the classification accuracy will be a necessarily concerned question.
Table 4SVM output for test data
Type | C10 | C11 | C20 | C21 | C30 | C31 |
Misclassification number | 6 | 3 | 5 | 2 | 4 | 2 |
Accuracy of classification | 94 % | 97 % | 95 % | 98 % | 96 % | 98 % |
Fig. 11Classification performance under MCKD and SVM method
a)
b)
c)
4.2.3. Contrast analysis among different rotation speeds
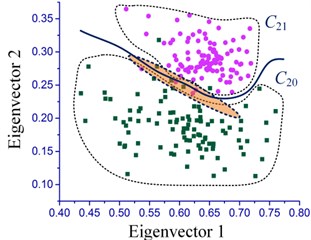
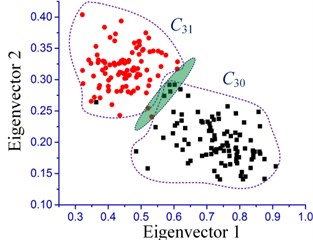
According to the experimental conditions sets in Table 2, the measured vibration signal was analyzed and the corresponding classification accuracy was calculated. The overall classification effect of bearing skewed installation state and perfect installation state is displayed in Fig. 12.
Fig. 12Classification performance about different conditions based on the proposed method
a)
b)
Fig. 12 shows the classification effect of the measured signal under the other different operating conditions. It can be seen from the area of the scattered distribution in the figure that the bearing skew and normal installation can be clearly distinguished. As expected, the impact of the composition is more obvious with the increase of deflection degree of the outer ring, so the classification effect is more clearly. Other analyses were also conducted under the rotation speed 4000 r/min and 8000 r/min to validate the proposed method; the overall classification accuracy is shown in Table 5.
It can be seen that under the experimental conditions established in this paper, the assembly state of the spindle bearing can be accurately diagnosed by the IMCKD algorithm combined with SVM method. All of the results of the classification accuracy are more than 95 %. This also illustrates that the feasibility and effectiveness of the proposed method for quality inspection of the spindle bearing assembly. However, due to the limitation of experiments, the eigenvectors of the dislocated condition of bearing are not determined in this work. Moreover, it is difficult to classify the case clearly between similar conditions (i.e. C20 and C30) due to the eigenvectors cross each other. In the future, the skew level of the bearing will be further studied based on these abundant data measured in the experimental process.
Table 5SVM output for test data under different rotational speeds
Rotational speed | Type | C10 | C11 | C20 | C21 | C30 | C31 |
4000 rpm | Accuracy of classification | 95 % | 98 % | 97 % | 98 % | 98 % | 99 % |
8000 rpm | Accuracy of classification | 97 % | 99 % | 98 % | 98 % | 98 % | 99 % |
5. Conclusions
In this study, a new assembly spindle bearing state diagnostic method was presented. To enhance the performance of the impact due to skew installation of bearing in a spindle, an IMCKD algorithm was proposed, which aims to deconvolve periodic impulse characteristic from a new assembly spindle vibration signal. Then WPT was utilized to analyze the preprocessed signals, and three levels of decomposition were obtained. To extract the impact characteristics, the normalized frequency band energy value was calculated as classification indices. Finally, SVM was implemented and eigenvectors were input to SVM classifier for detecting the bearing state under different conditions. The proposed method was verified through experiments under different rotation speeds and conditions, and the results have shown that:
The proposed method presents superiority on detecting the assembly spindle bearing state. Periodic impact characteristics of weak signals induced by skew or dislocation state can be effectively enhanced by using the proposed improving MCKD algorithm.
The results show that the different sub-band energy represents a certain installation state of the bearing. So, the spindle bearing assembly state (perfect installation or incorrect installation) can be determined by analyzing the energy distribution of sub-band of the measured vibration signals.
Comparative analysis of the results shows that the limitation of the proposed method, which is unsuitable for detecting similar assembly conditions (i.e. C10, C20 and C30) due to eigenvectors cross each other.
References
-
Bercher C., Spachtholz G., Paepenmüler F. Developments for high performance machine tool spindles. Annals of CIRP, Vol. 56, 2007, p. 179-182.
-
Altintas Y., Cao Y. Z. Virtual design and optimization of machine tool spindles. Annals of CIRP, Vol. 54, 2005, p. 379-382.
-
Yan Wang Zhu Hong K. Y. T. Y. S. J., Zhai Q. Investigation on heat dissipation characteristic of ball bearing cage and inside cavity at ultra high rotation speed. Tribology International, Vol. 93, 2016, p. 470-481.
-
Li Li B. T., Hong J., Liu Z. F. Stiffness design of machine tool structures by a biologically inspired topology optimization method. International Journal of Machine Tools and Manufacture, Vol. 84, 2014, p. 33-44.
-
Gao X. M., Li B. T., Hong J., Guo J. K. Stiffness modeling of machine tools based on machining space analysis. International Journal of Advanced Manufacturing Technology, Vol. 86, 2016, p. 2093-2106.
-
Zhang Xuening, Han Qinkai, Peng Zhike, Chu Fulei A new nonlinear dynamic model of the rotor-bearing system considering preload and varying contact angle of the bearing. Communications in Nonlinear Science and Numerical simulation, Vol. 22, 2015, p. 821-841.
-
Zhang Xuening, Han Qinkai, Peng Zhike, Chu Fulei Stability analysis of a rotor-bearing system with time-varying bearing stiffness due to finite number of balls and balanced force. Journal of Sound and Vibration, Vol. 332, 2013, p. 6768-6784.
-
Bai Chang Qing, Xu Qingyu, Zhang Xiaolong Nonlinear stability of balanced rotor due to effect of ball bearing internal clearance. Applied Mathematics and Mechanics, Vol. 27, 2006, p. 175-186.
-
Sidar R., Sen P. K., Sahu G. Review of vibration based fault diagnosis in rolling element bearing and vibration analysis techniques. Internal Journal of Science, Engineering and Technology Research, Vol. 4, 2015, p. 998-1003.
-
Zheng J. D., Cheng J. S., Yang Y. Generalized empirical mode decomposition and its applications to rolling element bearing fault identification. Mechanical Systems and Signal Processing, Vol. 40, 2013, p. 136-153.
-
Bin J., Gao G. F. J., Li X. J. Early fault diagnosis of rotating machinery based on wavelet packets-empirical mode decomposition feature extraction and neural network. Mechanical Systems and Signal Processing, Vol. 7, 2012, p. 696-711.
-
Gan M., Wang C., Zhu C. Z. Multiple-domain manifold for feature extraction in machinery fault identification. Measurement, Vol. 75, 2015, p. 76-91.
-
Chen F. F., Tang B. P., Song T. Multi-fault identification study on roller bearing based on multi-kernel support vector machine with chaotic particle swarm optimization. Measurement, Vol. 47, 2014, p. 576-590.
-
Qiu H., Jay L., Lin J., et al. Wavelet filter-based weak signature detection method and its application on rolling bearing element bearing prognostics. Journal of Sound and Vibration, Vol. 289, 2006, p. 1066-1090.
-
Jiang R., Liu S., Tang Y., Liu Y. A novel method of fault diagnosis for rolling element bearings based on the accumulated envelope spectrum of the wavelet packet. Journal of Vibration and Control, Vol. 21, 2015, p. 1-14.
-
Sawalhi N., Randall R. B., Endo H. The enhancement of fault detection and diagnosis in rolling element bearings using minimum entropy deconvolution combined with spectral kurtosis. Mechanical Systems and Signal Processing, Vol. 21, 2007, p. 2616-2633.
-
Antoni J., Randall R. B. The spectral kurtosis: application to vibratory surveillance and diagnostics of rotating machines. Mechanical Systems and Signal Processing, Vol. 20, 2006, p. 308-331.
-
Wiggins R. A. Minimum entropy deconvolution. Minimum entropy deconvolution. Geophysical Prospecting for Petrole, Vol. 16, 1980, p. 21-35.
-
Mcdonald G. L., Zhao, Zuo M. J. Maximum correlated kurtosis deconvolution and application on gear tooth chip fault detection. Mechanical Systems and Signal Processing, Vol. 33, 2012, p. 237-255.
-
Randall R. B., Antoni J. Rolling element bearing diagnostics-a tutorial. Mechanical Systems and Signal Processing, Vol. 25, 2011, p. 485-520.
-
Zhang Y. X., Randall R. B. Rolling element bearing fault diagnosis based on the combination of genetic algorithms and fast kurtogram. Mechanical Systems and Signal Processing, Vol. 23, 2009, p. 1509-1517.
-
Yan R., Gao R. X. Hilbert-Huang transform-based vibration signal analysis for machine health monitoring. IEEE Transaction on Instrument Measurement, Vol. 55, 2006, p. 2320-2329.
-
Antoni J. Cyclic spectral analysis of rolling-element bearing signals: facts and frictions. Journal of Sound and Vibration, Vol. 304, 2007, p. 497-529.
-
Jack L. B., Nandi A. K. Fault detection using support vector machines and artificial neural networks, augmented by genetic algorithms. Mechanical Systems and Signal Processing, Vol. 16, 2002, p. 373-390.
-
Wang W. J., Chen J., Wu X. K., Wu Z. T. The application of some nonlinear methods in rotating machinery fault diagnosis. Mechanical Systems and Signal Processing, Vol. 15, 2001, p. 697-705.
-
Su C. T., Yang C. H. Feature selection for the SVM: an application to hypertension diagnosis. Expert Systems with Applications, Vol. 34, 2008, p. 754-763.
-
Vapnik V. N. The Nature of Statistical Learning Theory. Second Edition, Spring – Verlag, New York, 1999.
-
Rojas Alfonso, Nandi Asoke K. Practical scheme for fast detection and classification of rolling-element bearing faults using support vector machines. Mechanical Systems and Signal Processing, Vol. 20, 2006, p. 1523-1536.
-
Yang Y., Yu D., Cheng J. A fault diagnosis approach for roller bearing based on envelops spectrum and SVM. Measurement, Vol. 40, 2007, p. 943-950.
-
Rajeswari C., Sathiyabhama B., Devendiran S., Manivannan K. Bearing fault diagnosis using multiclass support vector machine with efficient feature selection methods. Internal Journal of Mechanical and Mechatronics Engineering, Vol. 15, 2015, p. 1-12.
-
Abbasion S., Rafsanjani A., Farshidianfar A., Irani N. Rolling element bearings multi-fault classification based on the wavelet denoising and support vector machine. Mechanical Systems and Signal Processing, Vol. 21, 2007, p. 2933-2945.
-
Ziani R., Felkaoui, Zegadi R. Bearing fault diagnosis using multiclass support vector machines with binary particle swarm optimization and regularized Fisher’s criterion. Journal of Intelligent Manufacturing, Vol. 11, 2014, p. 1-13.
Cited by
About this article
This work is supported by National Science Foundation of China under Grant No. 51575434.

