Abstract
Interrelation of various approaches to the definition of the concept of entropy determines its wide using in applications. We consider entropy characteristics used in various research techniques for investigation of complex dynamical systems (including symbolic ones) behaviour. Methods of analysis of dynamical systems phase portraits, which are based on Rényi entropy, fractal and multifractal characteristics, and results of numerical experiments are given.
1. Introduction
Investigations of various real processes are often based on observations. As P. Bak [1] noted observations are mainly statistical in character, and the laws formalizing the observations are expressed by distribution functions for measurable values. It results in applying informational (statistical) approach to the studying complex system behavior and using characteristics based on obtained distribution functions. The concept of entropy introduced by R. Clausius in 1850 in thermodynamics subsequently began to take on more general meaning not related directly to thermodynamics. Clausius considered entropy of an isolated system as a measure of the system state changing under changes of temperature. The term entropy denoted the energy that does not perform work, and in any isolated system it can only grow. It was L. Boltzmann [2] who first introduced statistical approach in thermodynamics – he proposed to describe a system state by using its microstates. The extension of Boltzmann’s entropy to nonequiprobable distributions results in Gibbs-Shannon entropy, which is one of Rényi entropies set. In 1948 C. Shannon invented entropy as a term in information theory, A. Kolmogorov in 1958 created dynamical entropy in dynamical systems. Now the term entropy is widely used in mathematics, computer science and many other areas of exploration.
In dynamical systems by entropy is meant a characteristic of a system complexity. Topological entropy describes the complexity of orbit structure and is the most important numerical invariant under topological conjunction. Another approach to the system dynamics study is statistical description of orbit behavior, and metric entropy of measure-preserving transforms is a statistical analog of topological entropy. Comprehensive information on entropy in dynamical systems and the relation between topological and metric entropy are given in [3, 4].
Of fundamental importance is the class of symbolic dynamical systems which are used for the coding smooth dynamical systems. The coding means that to any element of a finite partition is assigned a symbol from a finite alphabet and a trajectory is written as a symbol sequence in accordance with the transition of a trajectory from one partition element to another. On the space of sequences the shift map is considered such that one step along the trajectory is the shift of the corresponding sequence. Symbolic dynamical systems with a simple graphic presentation – topological Markov chains – are of frequent use.
Practical application of symbolic dynamical systems is based on elaboration of applied symbolic dynamics methods. In 1898 J. Hadamar [5] applied trajectory coding to describe global behavior of geodesic on the surfaces with negative curvature. H. Morse and G. Hedlung [6] and R. Bowen [7] contributed significantly to the progress of the method. V. Alekseev [8] applied it for celestial mechanics problems. In 1983 G. Osipenko proposed the method of symbolic image in which trajectory transitions between partition elements are represented by an oriented graph. Symbolic image is a topological Markov chain, and symbol sequences correspond to paths on the graph. This method was applied to approximation of invariant sets, Morse spectrum and invariant measures [9].
The dynamics of a system may be studied by analyzing its phase portrait. In this work, we consider the image analysis methods based on combining symbolic dynamics and information approach, and various types of entropies serve as connecting links between different problems and methods. The operating with symbolic sequences naturally leads to the calculation of a statistical characteristic of the system – relative frequency of a symbol occurrence, which corresponds to the frequency that a trajectory of an initial system visits a partition element. Hence, we obtain a measure of trajectory distribution in phase space, which provides calculation techniques for spectral characteristics – multifractal spectrum, Rényi spectra and divergences.
One may model the dynamics of diffusion processes by constructing the Markov chain on an oriented graph corresponding to a digital image which is a phase portrait of the process. The flow is defined by pixel intensities and nearest neighbours. Then the stationary state of the chain is calculated, which maximizes so called weighted entropy. This value (interpreted as a “distance” between an initial state and the stationary one) may be used as a classifying sign in image analysis.
These methods appear to have considerable promise for analysis of high resolution images with complex structure. We show the application of the construction of stationary flow on the graph and calculation of Rényi divergences to the analysis of biomedical preparation images. (All the images were provided by the department of morbid anatomy of Mariinsky hospital and medical center Terapeuticum in St. Petersburg.)
2. Calculation and estimation of topological and metric entropy
Topological entropy may be defined by different ways, for example through minimal coverings or separated sets [10]. For some systems it coincides with the growth rate of periodic orbits and may be calculated at once (linear extending maps, hyperbolic automorphism of torus). But for the most part of systems direct calculations are difficult and we should use methods of estimations. In 1993 S. Newhouse and T. Pignataro [11] proposed a method for estimating the topological entropy of a smooth dynamical system. The method is based on estimating the logarithmic growth rates of suitably chosen curves in the system. The method may be successfully applied for studying the complex system having strange attractors. In [12] the authors described the algorithm for obtaining rigorous lower bound for the topological entropy of planar diffeomorphisms based on approximation of stable and unstable manifolds of hyperbolic periodic points. Basing on these methods estimations of topological entropy were obtained for Henon and Ikeda map. Topological entropy with relative ease may be obtained for topological Markov chain – as the module of maximal eigenvalue of the adjacency matrix for the chain graph.
The symbolic image method may be effectively applied to the problem of approximation of an invariant measure for a dynamical system. The existence of an invariant measure means the existence of a stationary flow on the symbolic image graph. To obtain it we should construct a stationary distribution for a Markov chain. Metric entropy of the distribution gives a lower bound for the topological entropy of symbolic image which is calculated as topological entropy of topological Markov chain. The algorithms of the construction of stationary flow were described and implemented in [13, 14], where we obtained a lower bound of topological entropy for delay map, double logistic map, Henon and Ikeda map.
3. Entropy and image analysis
3.1. Weighted entropy
A description of a system dynamics by using oriented graph may be applied for images illustrating diffusion processes. The image is considered as a pixel lattice, being every pixel i is a vertex of the graph with the measure pi equal to the pixel intensity. There are edges from every vertex to nearest neighbours and for every edge (i,j) its measure pij is pi divided on the number of neighbours. Norming the distribution pij we obtain a Markov chain on graph in which a vertex measure is equal to the sum of measures of outcoming edges. Construct a stationary distribution uij (for every vertex the sum of measures of incoming edges is equal to the sum of measures of outcoming ones). It was shown in [15] that such a distribution maximizes weighted entropy:
which in accordance with maximum entropy principle means that the system goes from an initial state into the state with maximal entropy – stationary one.
In [16] we proposed a model for digital image analysis which is based on the calculation of a stationary flow on the graph associated with given image. Weighted entropy is considered as a classification sign. The implementation of the algorithm and results of the classification of pharmacological Ag solution images are given in [17].
We consider an example of calculation of weighted entropy for liver images (given in Fig. 1) from 4 classes: plethora, dystrophy, cirrhosis and metastasis. In Table 1 the results of experiments are given. Component H of HSV palette seems to be more effective than others.
Fig. 1Images of liver tissue with plethora, dystrophy, cirrhosis and metastasis
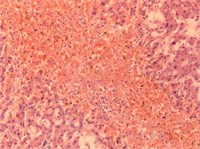
a) Plethora

b) Dystrophy

c) Cirrhosis

d) Metastasis
Table 1Weighted entropy values in several palette components
Image | Grayscale | H | S | V |
Plethora | 0,00001861 | 0,13403192 | 0,00002513 | 0,00001609 |
Dystrophy | 0,00001713 | 0,12524680 | 0,00002104 | 0,00001625 |
Cirrhosis | 0,00001607 | 0,08331278 | 0,00002021 | 0,00001627 |
Metastasis | 0,00001676 | 0,09522161 | 0,00003831 | 0,00001648 |
3.2. Multifractal spectrum versus entropy
Digital images with complex texture are often fractals or multifractals. Fractal sets have a self-similarity property and may be described one numerical characteristics – fractal dimension. Multifractal sets are unions of several fractal subsets, which of them has its own fractal dimension, being these subsets are arranged in a complex intertwined manner. As numerous experimental data show, for complex textures there is a power law between the cell measure and the cell size. The set of these exponents is called singularity spectrum. All the cells having close exponent values form a fractal subset, and fractal dimensions of these subsets form multifractal spectrum.
Basing on the Egglestone result about the Hausdorff dimension of the set of numbers in unit interval with given distribution of digits [18] the authors of [19] proposed to calculate the dimension of a measure {pi} support M (the set of trajectories described by the given distribution) as:
As the measure {pi} depends on the cell size l and l=1/N Eq. (2) is equivalent to:
which is the expression for information dimension.
The authors also propose to use direct multifractal transform of a given initial normed measure distribution and Eq. (3) for calculation of information dimensions of subsets that are supports of the initial measure and its multifractal transforms.
In what follows we assume that pi≈lαi, then αi≈lnpi(l)/lnl. Consider the generalized statistical sum φ(k)=∑Ni=1pki(l), where k – a real number and assume that there is the function τ(k) such that φ(k)≈lτ(k). Given an initial distribution {pi} construct the sequence of measures μ(k,l)={μi(k,l)} obtained by direct multifractal transform:
For each measure μ(k,l) one can calculate the information dimension of its support by Eq. (3) and obtain a set f(k) – dimensions of μ(k,l) supports:
We also calculate averaging of exponents over the measure μ(k,l) and then the limit α(k)of the averaging when l tends to zero:
Hence Eqs. (5) and (6) define the set of dimensions (multifractal spectrum) f(k) and the set of averaging exponents α(k) as functions of the parameter k. Excluding k one may obtain the dependence f(α).
This method was applied in [20] to calculate Rényi spectrum. We applied it in [21] to classify biomedical preparation images.
3.3. Rényi divergences
To reveal difference between structures of two images one can calculate Rényi divergences of order α (or α-divergences) which for given probabilistic distributions p={pi} and q={qi} are defined as follows:
It is known that values given by Eq. (6) are nonnegative for any α and the Rényi divergence is a non-decreasing function of α.
For α=1 the divergence is given by the formula:
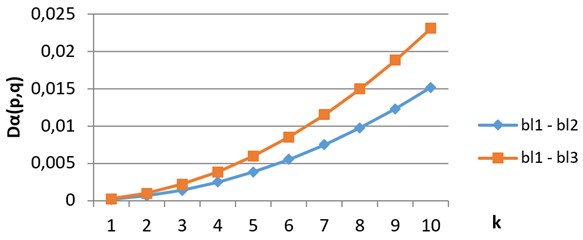
and called the Kullback-Leibler divergence. Note that up to sign Eq. (8) is the expression for weighted entropy (1). To obtain a vector characteristic we applied direct fractal transform Eq. (4) to given initial measures and calculated Rényi divergences between members of obtained sequences of measures. The feature that may be used as a classifying sign is the rate of the growth of the vector. For images having similar structures this rate is lower than for images with different structures. This approach was applied in [22, 23] for biomedical preparation images analysis and classification.
As an example, compare digital images of blood crystals from 3 classes – acute inflammatory process (bl1), chronic inflammatory process (bl2) and degenerative processes (bl3), which are shown from left to right on Fig. 2. The results of comparing of divergence vectors for α=1 in grayscale are shown on Fig. 3, the same in H component – on Fig. 4. We see that growth rates of divergence vectors are different.
Fig. 2Images of blood crystals: acute inflammatory process, chronic inflammatory process, degenerative process


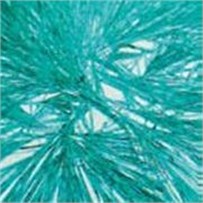
Fig. 3Divergence vectors when comparing images from classes bl1, bl2 and bl3 in grayscale
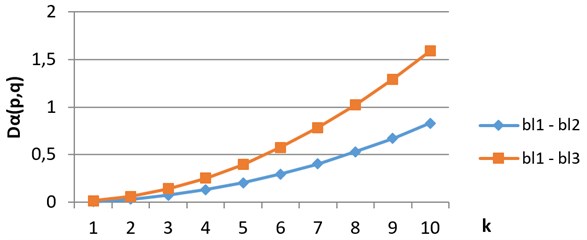
Fig. 4Divergence vectors when comparing images from classes bl1, bl2 and bl3 in H component
4. Conclusions
Using the concept entropy in various subject areas is determined by the quest for applying a general characteristic to describe different processes as a whole. It is statistical character of observations of natural phenomena that leads to using distribution functions of measurable values, and entropy is described in these terms. It turns out that entropy characteristics may be obtained both for a system described analytically and for its phase portraits. For applications relating to digital image analysis the calculation of Rényi entropies and multifractal spectra makes possible the revealing essential peculiarities of image structure and solving classification problem.
References
-
Bak P. How Nature Works. Springer, 1996.
-
Boltzmann L. Kinetic Theory of Matter. Moscow, 1939, (in Russian).
-
Downarowicz T. Entropy in Dynamical Systems. Cambridge University Press, 2011.
-
Katok A., Hasselblatt B. Introduction to the Modern Theory of Dynamical Systems. Cambridge University Press, 1995.
-
Hadamar J. Les surfaces a courbures opposees et leur ligues geodesiques. Journal de Mathematiques Pure et Appliquees, Vol. 5, Issue 4, 1898, p. 27-73.
-
Morse H., Hedlung G. Symbolic dynamics I, II. The American Journal of Mathematics, Vol. 60, Issue 4, 1938, p. 815-866; Vol. 62, Issue 1, 1940, p. 1-42.
-
Bowen R. Symbolic Dynamics. American Mathematical Society Providence, R. I., Vol. 8, 1982.
-
Alekseev V. Symbolic Dynamics. 11 Mathematical School, Kiev, 1976.
-
Osipenko G. Dynamical Systems, Graphs, and Algorithms, Lecture Notes in Mathematics 1889. Tiergartenstrasse 17, Heidelberg, Germany, D-69121, 2007, p. 300.
-
Hasselblatt B., Katok A. A First Course in Dynamics: with a Panorama of Recent Developments. Cambridge University Press, 2003.
-
Newhouse S., Pignataro T. On the estimation of topological entropy. Journal of Statistical Physics, Vol. 72, 1993, p. 1331-1351.
-
Newhouse S., Berz M., Grote J., Makino K. On the estimation of topological entropy on surfaces. Contemporary Mathematics, Vol. 469, 2008, p. 243-270.
-
Osipenko G. Symbolic image and invariant measures of dynamical systems. Ergodic Theory and Dynamical Systems, Vol. 30, 2010, p. 1217-1237.
-
Ampilova N., Petrenko E. On application of balance method to approximation of invariant measures of a dynamical system. e-Journal “Differential Equations and Control Processes”, Vol. 1, 2011, p. 72-84, http://www.math.spbu.ru/diffjournal/RU/numbers/2011.1/article.1.6.html.
-
Bregman L. M. The proof of the G.V. Sheleihovsky method for problems with transport restrictions. Journal of Computational Mathematics and Mathematical Physics, Vol. 7, Issue 1, 1967, p. 147-156, (in Russian).
-
Ampilova N. Stationary processes on graphs and image analysis. Computer Tools in Education. Vol. 2, 2013, p. 31-36, (in Russian).
-
Batiukov A. Image analysis based on the construction of stationary processes on graphs. Vestnik St. Petersburg University, Series 10, Applied Mathematics, Informatics and Control Processes, Vol. 2, 2015, p. 115-122, (in Russian).
-
Billingsley P. Ergodic Theory and Information. The University of Chicago, New York, 1965.
-
Chabra A., Meneveau C., Jensen R., Sreenivasan K. Direct determination of the f(α) singularities spectrum and its application to fully developed turbulence. Physical Review A, Vol. 40, Issue 9, 1989, p. 5284-5294.
-
Vstovsky G. Elements of Information Physics. Moscow, MGIU, 2002.
-
Ampilova N., Sergeev V., Soloviev I. Digital image analysis based on direct multifractal transform. Humanities and Science University Journal, Vol. 19, 2016, p. 23-32, http://submit.uni-journal.ru/article/8850.
-
Ampilova N., Sergeev V., Soloviev I. The application of Renyi divergences to image analysis and classification. Izvestia Herzen University Journal of Humanities and Sciences, Vol. 176, 2015, p. 35-44, (in Russian).
-
Ampilova N., Soloviev I. On application of entropy characteristics to texture analysis. WSEAS Transactions on Biology and Biomedicine, Vol. 11, 2014, p. 194-202.

