Abstract
We discuss entropy characteristics used in various research techniques for investigation of complex dynamical systems including symbolic ones. The dynamics of a system may be studied by analyzing the phase portrait of a system obtained as a digital image. Symbolic dynamics methods allow combining entropy of a given dynamical system with the entropy characteristics of its phase portrait. We apply methods of image analysis based on symbolic dynamics, Rényi entropy, fractal and multifractal characteristics to analyze high resolution images having a complex structure. We also describe the results of applications of described methods to images of biomedical preparations.
Highlights
- The concept of entropy in various subject areas was considered.
- Entropies of dynamical systems and their phase portraits were described.
- The connection between entropies and fractal dimensions was shown.
- Examples of using entropy characteristics in digital image analysis were given.
1. Introduction
Scientific investigations of various processes are often based on observations. P. Bak in [1] noted, that observations are statistical in nature, and we use some distribution functions for measurable values to formalize them. It leads to forming informational (statistical) approach to study the behavior of a complex system, which is described by models processes we observe using the characteristics based on distribution functions.
In 1850, R. Clausius introduced the concept of entropy of an isolated system in thermodynamics as a measure of the change of system state under a change of temperature. The term “entropy” denoted the energy that does not perform work, and in any isolated system it can only increase.
L. Boltzmann [2] introduced the statistical approach in thermodynamics – he proposed to describe a system state by using its microstates. The Boltzmann entropy – statistical entropy for equiprobable distribution of a system over N states:
For non-equiprobable distributions, the ensembles of microcanonical subsystems are used so that all its Ni states are equiprobable with a probability pi for every i-th subsystem. The Boltzmann entropy (1) of i-th subsystem is HiB=-lnpi. The averaging of ensembles results in the expression for Gibbs-Shannon entropy:
The development of informational approach to the description of complex systems led to the creation of other forms of informational entropies, in particular Rényi entropies — a set of functions depending on a real parameter q:
These functions are important characteristics of a complex system, in particular in image analysis. Rényi spectra are calculated by using Renyi entropies. The Gibbs-Shannon entropy Eq. (2) is the Rényi entropy Eq. (3) for q=1.
Then the term of “entropy” began to take on more general meaning not related directly to thermodynamics. In 1948, C. Shannon invented entropy as a term in the information theory, A. Kolmogorov in 1958 created the concept of “dynamical entropy” in the theory of dynamical systems. Now, one can find the term entropy in mathematics, physics, and computer science. In dynamical systems, the entropy characterizes the system complexity. Topological entropy describes the complexity of orbit structure. Moreover, topologically conjugated systems have the same entropy, thus they have the characteristics of a class of systems. To describe the statistical behavior of orbits, the metric entropy of measure-preserving transforms, which is a statistical analog of topological entropy, is introduced. A comprehensive review on entropy in dynamical systems and the relation between them are given in [3, 4].
Symbolic dynamical systems form one of fundamentally important classes of dynamical systems. They are obtained in the process of coding the smooth dynamical systems. The coding means that we construct a finite partition of a phase space and assign a symbol from a finite alphabet to any element of the partition. Then we code a trajectory with a symbol sequence by writing one-by-one codes of partition elements which the trajectory visits. We obtain a space of symbol sequences corresponding to an approximation of the set of system trajectories, and define the shift map on the space so that one step along the trajectory is the shift of the corresponding sequence on one symbol. Symbolic dynamical systems having a presentation by the oriented graph are topological Markov chains, which are very important in different applications.
Practical application of symbolic dynamical systems was made possible due to elaboration of applied symbolic dynamics methods. Trajectory coding for description of global behavior of geodesic on the surfaces with negative curvature was applied in 1898 by J. Hadamar [5]. The papers of H. Morse and G. Hedlung [6, 7] and R. Bowen [8] made an important contribution to the progress of the method. V. Alekseev [9] applied it for celestial mechanics problems. In 1983 G. Osipenko elaborated the method of symbolic image, in which the system dynamics is represented by an oriented graph constructed by some rules. Actually, symbolic image graph is a topological Markov chain, where symbol sequences correspond to paths on the graph. By applying the technique of adaptive partition subdivision, one can construct a sequence of symbolic images that is an approximation of the dynamics of the initial system. This method was successfully applied to the approximation of invariant sets, Morse spectrum and invariant measures [10].
To study the dynamics of a system, one may analyze its phase portraits in various points in time. The operations with symbolic sequences naturally result in the calculation of a statistical characteristic of the system — relative frequency of a symbol occurrence in the sequence, which corresponds to the frequency at which a trajectory of the initial system visits a partition element. When considering phase portraits as digital images, we may interpret the set of frequencies as a measure distribution. Basing on this distribution, we may calculate multifractal spectra, Rényi spectra and divergences. These characteristics use Rényi entropies.
One can simulate the dynamics of diffusion processes illustrated by their phase portraits by constructing an oriented graph and the Markov chain on it. The flow is defined by pixel intensities. Then the stationary flow (state) of the chain is calculated, which maximizes so called weighted entropy. This value interpreted as a “distance” between an initial state, and the stationary one may be used as a classifying sign in image analysis. These methods appear to have a considerable promise for high resolution images with complex structure.
In this work, we consider the application of analysis methods of dynamical systems including image analysis ones, which are based on combining the symbolic dynamics and information approach. Various types of entropies serve as connecting links between different problems and methods. The described methods were used to analyze and classify digital images of biomedical preparations having a complex structure.
2. Calculation and estimation of topological entropy
Topological entropy may be defined by different ways, for example through minimal coverings or separated sets [11]. For simple system having complex structure of orbits, one may calculate the growth rate of periodic orbits. Examples of such systems are linear extending maps, and hyperbolic automorphism of torus. For them, the topological entropy coincides with the growth rate, which may be easily calculated. But for the most part of systems, we need to use methods of estimations. In 1993, S. Newhouse and T. Pignataro [12] proposed a method to estimate the topological entropy of a smooth dynamical system by calculating the logarithmic growth rates of suitably chosen curves in the system. The method may be successfully applied to study complex systems with strange attractors. In [13], the authors described the algorithm for obtaining rigorous lower bound of the topological entropy of planar diffeomorphisms. They used a method of approximation of invariant manifolds of hyperbolic periodic points, and applied it to estimate entropy for Henon and Ikeda maps. An effective algorithm was proposed in [14], where the authors calculated lower bound of the topological entropy and used it to identify regions of high mixing.
Topological entropy with relative ease may be obtained for a topological Markov chain: we should calculate the module of maximal eigenvalue of the adjacency matrix for the corresponding graph. In this connection, we may estimate topological entropy of a system by using the symbolic image method: in accordance with a given partition to construct the oriented graph (which is a topological Markov chain) and calculate eigenvalues of the adjacency matrix. In order to simplify the problem, one may perform this procedure for each component of strong connectivity of the graph.
The technique for estimation of topological entropy for the spaces of symbol sequences (“edge space” and “vertex space”) on oriented graphs was proposed in [15]. Basing on this approach, G. Osipenko in [10] designed and implemented algorithms for estimation of the entropy of symbolic image and obtained the estimation of topological entropy of Henon and logistic maps.
3. Metric entropy estimation
The concept of metric entropy of a map is introduced for maps preserving a measure. It means that we should deal with invariant measures of a map. The Krilov-Bogolyubov theorem [4] guarantees that any continuous map on a compact space has an invariant measure. One may construct an approximation to the invariant measure using the symbolic image method. In this case, we should calculate stationary flow on the graph of symbolic image. In doing so, we obtain a stationary distribution for a Markov chain. Then metric entropy of the distribution is a lower bound for the topological entropy of symbolic image. The algorithms of the construction of stationary flow were described and implemented in [16, 17], where the estimations for topological entropy of delay map, double logistic map, Henon and Ikeda map were obtained.
In this work, we also use the idea of construction of stationary flow on a graph constructed for a digital image by a specific way. It is known that stationary flow gives maximum to the function dealing with initial and stationary distributions (so called weighted entropy). For digital images weighted entropy may be considered as a classifying sign.
4. Entropies as goal functions in variational problems
The Shannon and Rényi entropies are often used as goal functions when finding distributions that maximize (minimize) the function for some given restrictions. We consider one problem which is related to multifractal spectrum calculation.
Let a distribution {pi} with ∑Ni=1pi=1 be given. Find the distribution μi maximizing the Shannon entropy -∑μilnμi on the conditions ∑Ni=1μi=1, and the constraints on lnpi averaged over μi, i.e. ∑Ni=1μilnpi=k, where k is a real constant.
Consider the Lagrange function with parameters q and λ:
Equaling partial derivatives of φ (given by Eq. (4)) by μi to zero, we obtain the system:
It follows that:
Combining Eq. (5), we obtain 1=eλ-1∑Ni=1pqi, that taking into account Eq. (6) leads to excluding λ:
For given conditions on average values (k), one can calculate q and solve the optimization problem. But it is significant that Eq. (7) determines a set of solutions depending on the parameter q. In fact, it is a transform of the initial measure {pi} (so called direct multifractal transform). It is easy to see that for q≠0 transforms Eq. (7) forms a group, namely if we denote fq(p)=pqi/∑pqi, then fq1(fq2)=fq1q2,fq(Id)=fq and fq(f1/q)=Id, where Id=f1. For q=1 we have the fixed point. The set of probabilistic measures falls into non-intersecting transitivity classes.
5. Entropy in analysis of digital images
5.1. Weighted entropy
Digital images illustrating diffusion processes may be analyzed by the construction of an oriented graph, which helps to describe the process dynamics. For this purpose, the image is considered as a pixel lattice, number of vertex in the graph is equal to the number of pixels. The measure pi of a vertex (pixel) i is assumed to be equal to the pixel intensity. Then we construct edges from every vertex to nearest neighbors (4 or 8) and for every edge (i,j), its measure pijis equal to pi divided into a number of neighbors. After standartizing the distribution pij, we obtain a Markov chain on the graph having the property: vertex measure is equal to the sum of measures of outcoming edges. For such a chain, one can construct a stationary distribution (stationary flow) uij, namely: the sums of measures of incoming and outcoming edges are equal in every vertex. As it was shown in [18], stationary distribution maximizes so-called weighted entropy:
According to the maximum entropy principle, it means that the system goes from an initial state into the state with the maximal entropy – stationary one.
The stationary state of the Markov chain describes a stable (stationary) state of the system generating the considered image. The existence of a stationary flow constructed on the graph related to this image may be interpreted as the existence of an invariant set of the system.
Problems from different subject areas may lead to the construction of а stationary flow on a graph. This method is applied in linear programming (transport tasks), dynamical systems (construction of an invariant measure on the graph of symbolic image). It should be noted that the solution exists if there are cycles on the graph.
In [19], a model based on the calculation of a stationary flow on the graph was considered to obtain a classification sign – weighted entropy – for a digital image. The implementation of the algorithmand results of the classification of pharmacological Ag solution images is given in [20]. In [21], this method and its optimization based on the choice of a cell instead of a pixel were successfully applied to some classes of biological preparations images, and in [22] methods of optimization using parallel calculation and another data representation were implemented. These methods allowed reducing the run time 3-4 times.
5.2. Weighted entropy calculation
Weighted entropy is calculated for 4 classes of biomedical preparation images, and each class contains 12 images. The images were obtained by microscope AxioCam MRc5 of the company Carl Zeiss Microimaging GmbH. All the images were made with 200-fold zoom, represented in RGB and with the size of 2584×1936 pixels.
A preliminary classification was performed by an expert. All the images are represented both in grayscale and HSV palette (component wise).
Fig. 1 shows images from 4 classes of liver tissue: plethora, dystrophy, cirrhosis, metastasis.
Fig. 1Images of liver tissue with plethora, dystrophy, cirrhosis and metastasis
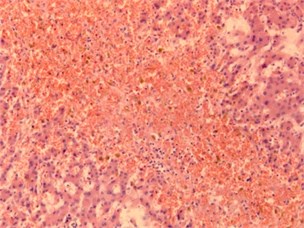
a) Plethora
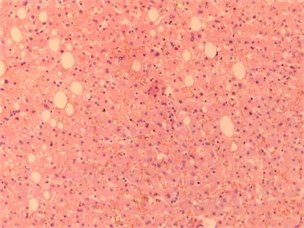
b) Dystrophy
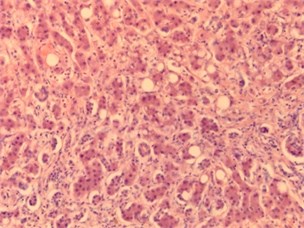
c) Cirrhosis
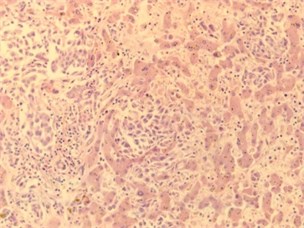
d) Metastasis
In Table 1 values of weighted entropy for images in Fig. 1 are given. Experiments show that the values of weighted entropy are different in H component.
Table 1Weighted entropy values in several palette components
Image | Grayscale | H | S | V |
Plethora | 0.00001861 | 0.13403192 | 0.00002513 | 0.00001609 |
Dystrophy | 0.00001713 | 0.12524680 | 0.00002104 | 0.00001625 |
Cirrhosis | 0.00001607 | 0.08331278 | 0.00002021 | 0.00001627 |
Metastasis | 0.00001676 | 0.09522162 | 0.00003832 | 0.00001648 |
5.3. Fractal dimensions and entropy
There is a connection between Shannon entropy and fractal dimensions. The first example is the Egglestone theorem concerning the Hausdorff dimension of a set of numbers in the unit interval with given distribution of relative frequencies of digits. It was described in [23]. The author gave the more common definition of Hausdorff’s dimension which was used in problems relating to r-adic decompositions. He considered a probabilistic measure on Borel sets on unit interval. The dimension of a set of numbers in the interval with a given distribution of relative frequencies of digits was expressed through the entropy of the probabilistic vector and coincided with the Hausdorff dimension.
The presentation of real number ω was considered in unit interval in the numbering system with base r>1, namely:
where coefficients xN(ω) take values from 0 to r-1.
The number of occurrences of symbol i is denoted in the sequence x1(ω),…,xN(ω) by Pi(ω,N). Note that the sequence {Pi(ω,N)} has the subadditivity property: Pm+n(ω,N)≤Pm(ω,N)+Pn(ω,N). Hence by the Pólya lemma there is:
Thus, to any sequence Eq. (9), one can match the probabilistic vector formed by relative frequencies of occurrences of symbol i in the sequence. Denote the set of numbers ω for which pi(ω) satisfy Eq. (10) by а M(p0,…pr-1). Then the Hausdorff dimension of the set M(p0,…,pr-1) may be calculated as:
It should be noted that in [24], H. Furstenberg obtained a more common result using symbolic dynamics. Namely, he considered a set of one-sided r-ary sequences Σ+m and a closed subset X which is σ invariant, where σ is shift map. Let φ:Σ+r→[0,1], where φ({ωn})=∑∞n=1ωnrn, ωn=xn(ω). In other words, by this way, we can match a number from unit interval to a symbol sequence over m-symbol alphabet. Let also M=φ(X). Then the Hausdorff dimension of the set M is given by the formula dimM=h(σ|X)logr, where h is the topological entropy of σ.
Hence it can be seen that taking into account the map φ, a record of a number in a numbering system with the base r may be interpreted as the image of a symbolic sequence which presents the coding of a dynamical system trajectory related to a chosen partition. Note that the set of numbers ω in unit interval with a given distribution pi(ω) may be thought as a set of encodings for trajectories of a dynamical system, and the Hausdorff’s dimension of this set is calculated by Eq. (11).
5.4. Multifractal spectrum and entropy
Another example of the connection between fractal dimensions and entropy is the information dimension, which is a member of Rényi dimensions set. This dimension may be interpreted as the dimension of the measure-theoretic support of a particular measure (in other words, the complement of the support has zero Lebesgue measure).
Digital images with complex texture often have fractal or multifractal structures. Fractal sets may be described by a numerical characteristic called as fractal dimension, which reflects the main property of such sets – self-similarity. The last one may be strict (as for Cantor set) and statistical (as for majority of nature objects). Multifractal sets may be interpreted as unions of several fractal subsets. Each of subsets has its own fractal dimension, and they are arranged by a very complex way. Fractal dimensions of these subsets form multifractal spectrum. In the fractal analysis, we use a main assumption based on experimental data: if we divide an image on cells with a given size and calculate a measure of cells then there is power dependence between the measure and size. This exponent is an approximate value of the fractal dimension of the set.
Let us to give the number of cell of a partitions (N) with size l for a set M. In [25], the authors considered a calculation method for the dimension of a measure {pi} support M (in other words, the dimension of the set of trajectories on the phase portrait which corresponds to the given distribution) as:
Taking into account the dependence measure {pi} on the cell size, and l~1/N, we obtain Eq. (12) rewritten as follows:
The last one is the information dimension formula.
The authors also proposed to calculate multifractal spectrum by obtaining a sequence of measures from a given initial normalized measure distribution by applying direct multifractal transform, and then calculate information dimensions of supports of measures from the sequence by Eq. (13).
Later on we assume that pi≈lαi, hence αi≈lnpi(l)⁄lnl. We also assume that for the generalized statistical sum φ(q)=∑Ni=1pqi(l) (q is a real number), there is the function τ(q) such as φ(q)≈lτ(q). For an initial distribution {pi} we obtain the sequence of measures μ(q,l)={μi(q,l)} by applying Eq. (7): μi(q,l)=pq(l)i∑Ni=1pq(l)i. For each measure μ(q,l), we calculate the information dimension of its support by Eq. (13) and obtain a set f(q) – dimensions of measures μ(q,l) supports:
Following the method mentioned above, we also calculate averaging of exponents pi(l) over the measure μ(q,l) and then the limit α(q) of these averaging:
So, Eqs. (14) and (15) give the q-parametric presentation of multifractal spectrum f(q) and averaging exponents α(q).To obtain the dependence f(α), we should exclude q. Excluding q one may obtain the dependence f(α).
It is interesting to note that substituting μi(q,l)=pqi(l)/∑Ni=1pqi(l) in Eq. (14) we obtain:
=qliml→0∑Ni=1μi(q,l)lnpi(l)lnl-liml→0∑Ni=1μi(q,l)lnφ(q,l)lnl
=qα(q)-liml→0lnφ(q)lnl=qα(q)-τ(q).
Besides that:
=liml→0∑iμi(q,l)lnpi(l)lnl=α(q).
In other words, on the sequence of measures obtained from an initial measure by direct multifractal transform, the formula for the Legendre transform is made.
This method was applied in [26] for calculation of Rényi spectrum. Namely, by obtaining α(q) and f(q) and using the Legendre transform, we have τ(q)=qα(q)-f(q) and Dq=τ(q)/q-1, where Dq is q-order Rényi dimension.
We applied the described method in [27] to classify biomedical preparation images.
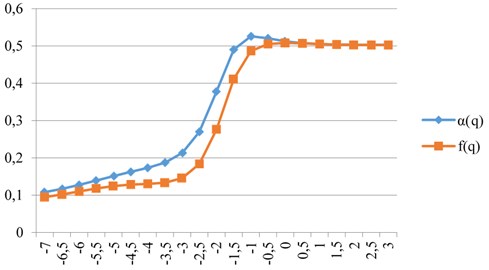
Example: Now the example of calculation of f(q) and α(q) is considered for images of a healthy bone tissue and a tissue with osteoporosis. Images have the size [350, 279]. Calculations were performed for a grayscale palette, the parameter k changed within the interval [–7, 3] with the step of 0.5. The cell measure is calculated as the relation of pixel intensities in the cell to the sum of pixel intensities of the image. To calculate f(q) and α(q) by Eqs. (14) and (15) the least square method was used with cell sizes {5, 6, 7, 8, 9, 10, 11}.
Fig. 2Images of healthy bone tissue and bone tissue with osteoporosis
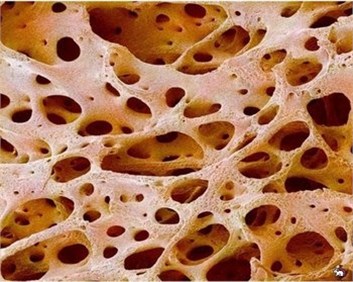
a) Healthy bone tissue
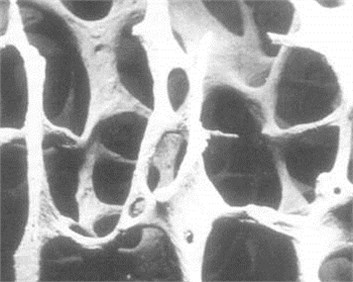
b) Bone tissue with osteoporosis
Fig. 3Graphics of parametrized spectra for healthy bone tissue
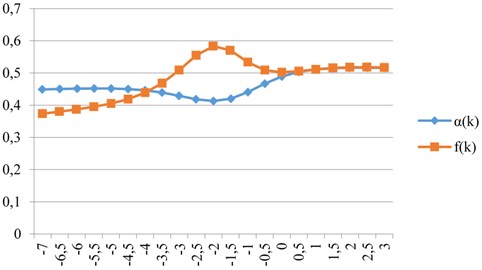
It should be noted that the choice of interval of values of parameter q depends on the image structure and palette. Nevertheless, the obtained results show that parametrized spectra may be used as classification signs in the image analysis.
Fig. 4Graphics of parametrized spectra for bone tissue with osteoporosis
5.5. Rényi divergences
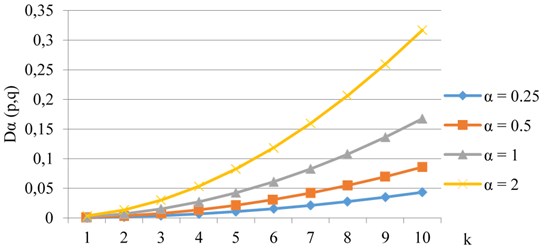
A calculation of Rényi divergences of order α (or α-divergences) allows us finding differences in structures of two images. For given probabilistic distributions p={pi} and q={qi} and the α-divergence is defined for some α as follows:
It is not difficult to verify that these values are non-negative for any α, and the Rényi divergence as a function of αis non-decreasing.
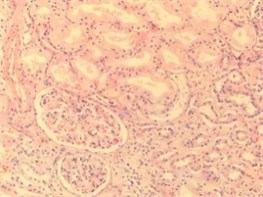
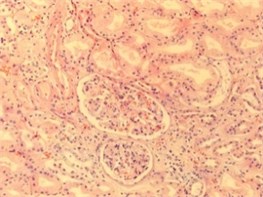
Fig. 5a), b) Healthy kidney tissue and c) tissue with pyelonephritis
a)
b)

c)
Fig. 6Graphics of Rényi divergences for various parameter values when comparing images of healthy tissues Fig. 5(a-b)
For α=1 the divergence is given by the formula.
It is known as the Kullback-Leibler divergence, and up to sign the Eq. (17) is the Eq. (8), which describes the weighted entropy.
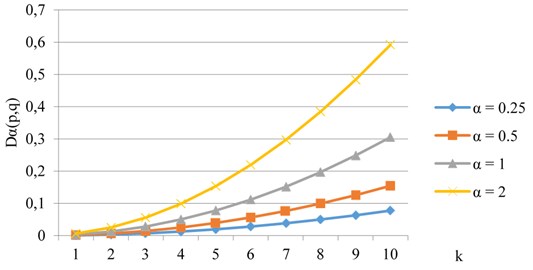
For given initial measures, we applied direct fractal transform Eq. (7), obtained two sequences of transformed measures and calculated Rényi divergences between corresponding members of these sequences. We applied this approach in [28, 29] to analyze and classify some classes of biomedical preparation images. Consider the example of application of this method to the analysis of healthy tissue and tissue with pyelonephritis images.
Fig. 7Graphics of Rényi divergences for various parameter values when comparing images of healthy and invaded tissues Fig. 5(a, c)
6. Conclusions
Nowadays the concept of entropy may be considered as a general characteristic for the description of many processes. It is natural that our descriptions are based on observations, which are statistical by its nature. The mathematical formalization for statistical events is expressed in terms of distribution functions, and the entropy is also written by using these functions. It is significant that one may obtain entropy characteristics both for various dynamical systems, and for digital images which are phase portraits of such systems. Symbolic dynamics allows us giving a natural interpretation of statistical description of the dynamic system behavior: it shows the frequency with which a typical trajectory visits cells of a given partition. Thereby such a characteristic describes a distribution of a measure on the phase space. For a given measure, one can calculate the partition entropy and metric entropy. Namely metric entropy is the base to calculate the information dimension of the measure support. The set of these dimensions is a kind of multifractal spectrum. Rényi entropies also use the metric entropy. Multifractal characteristics reveal essential peculiarities of image structure and may be used as classification signs. These methods are successfully applied in the analysis of a wide range of biomedical preparations images which have high resolution and very complex structure. So, the concept entropy, which is understood in dynamical systems as the system complexity, preserves its meaning in the application problems: based on entropy, the numerical characteristics of phase portraits show their complexity and in this way the behavior of the initial system.
References
-
Bak P. How Nature Works. Springer, 1996.
-
Boltzmann L. Kinetic Theory of Matter. Moscow, 1939, (in Russian).
-
Downarowicz T. Entropy in Dynamical Systems. Cambridge University Press, 2011.
-
Katok A., Hasselblatt B. Introduction to the Modern Theory of Dynamical Systems. Cambridge University Press, 1995.
-
Hadamar J. Les surfaces a courbures opposees et leur ligues geodesiques. Journal De Mathematiques Pure et Appliquees, Vol. 5, Issue 4, 1898, p. 27-73.
-
Morse H., Hedlung G. Symbolic dynamics I. American Journal of Mathematics, Vol. 60, Issue 4, 1938, p. 815-866.
-
Morse H., Hedlung G. Symbolic dynamics II. American Journal of Mathematics, Vol. 62, Issue 1, 1940, p. 1-42.
-
Bowen R. Symbolic Dynamics. American Mathematical Society Providence, Vol. 8, 1982.
-
Alekseev V. Symbolic Dynamics, 11 Mathematical School. Naukova Dumka, Kiev, 1976.
-
Osipenko G. Dynamical Systems, Graphs, and Algorithms. Lecture Notes in Mathematics, Vol. 1889, Heidelberg, Germany, 2007.
-
Hasselblatt B., Katok A. A First Course in Dynamics: with a Panorama of Recent Developments. Cambridge University Press, 2003.
-
Newhouse S., Pignataro T. On the estimation of topological entropy. Journal of Statistical Physics, Vol. 72, 1993, p. 1331-1351.
-
Newhouse S., Berz M., Grote J., Makino K. On the estimation of topological entropy on surfaces. Contemporary Mathematics, Vol. 469, 2008, p. 243-270.
-
Candelaresi S., Pontin D. I., Hornig G. Quantifying the tangling of trajectories using the topological entropy. Chaos, Vol. 27, 2017, p. 093102.
-
Lind D., Marcus B. An Introduction to Symbolic Dynamics and Coding. New-York, 1995.
-
Osipenko G. Symbolic image and invariant measures of dynamical systems. Ergodic Theory and Dynamical Systems, Vol. 30, 2010, p. 1217-1237.
-
Ampilova N., Petrenko E. On application of balance method to approximation of invariant measures of a dynamical system. Journal Differential Equations and Control Processes, Vol. 1, 2011, p. 72-84.
-
Bregman L. M. The proof of the G.V. Sheleihovsky method for problems with transport restrictions. Journal of Computational Mathematics and Mathematical Physics, Vol. 7, Issue 1, 1967, p. 147-156, (in Russian).
-
Ampilova N. Stationary processes on graphs and image analysis. Computer Tools in Education, Vol. 2, 2013, p. 31-36, (in Russian).
-
Batiukov A. Image analysis based on the construction of stationary processes on graphs. Vestnik St. Petersburg University, ser.10 Applied mathematics, informatics and control processes. SPb, Vol. 2, 2015, p. 115-122, (in Russian).
-
Ampilova N., Sergeev V., Soloviev I. On the method of digital image analysis based on the construction of a stationary flow on graph. Humanities and Science University Journal, Vol. 22, 2016, p. 29-36.
-
Sergeev V. On optimization of the algorithm of construction of a stationary flow on oriented graph. Computer Tools in Education, Vol. 2, 2017, p. 16-24, (in Russian).
-
Billingsley P. Ergodic Theory and Information. The University of Chicago, New York, 1965.
-
Furstenberg H. Disjointness in ergodic theory, minimal sets and a problem in diophantine approximation. Mathematical Systems Theory, Vol. 1, Issue 1, 1965, p. 1-49.
-
Chabra A., Meneveau C., Jensen R., Sreenivasan K. Direct determination of the f(α) singularities spectrum and its application to fully developed turbulence. Physical Review A, Vol. 40, Issue 9, 1989, p. 5284-5294.
-
Vstovsky G. Elements of Information Physics. Moscow, MGIU, 2002.
-
Ampilova N., Sergeev V., Soloviev I. Digital image analysis based on direct multi-fractal transform. Humanities and Science University Journal, Vol. 19, 2016, p. 23-32.
-
Ampilova N., Sergeev V., Soloviev I. The application of Renyi divergences to image analysis and classification. Izvestia Herzen University Journal of Humanities and Sciences, Vol. 176, 2015, p. 35-44.
-
Ampilova N., Soloviev I. On application of entropy characteristics to texture analysis. WSEAS Transactions on Biology and Biomedicine, Vol. 11, 2014, p. 194-202.
Cited by
About this article
The work was partially supported by the grant Erasmus + International Mobility (KA107) / National Technical University of Athens – St. Petersburg State University.

