Abstract
This work compares experimental and numerical results concerning the elastic dynamic response of air-backed plate to underwater explosion. Experiments were performed in a centrifuge, both the shock loadings and structure responses were tested, and the bubble oscillation considering centrifugal force was predicted with Geer and Hunter model. The experimental and numerical results illustrates that the centrifugal force have no effect on shockwave for the short duration of action, and with the increase of centrifugal force, the bubble pulse motion cycle, maximum bubble radius, and peak pressure of bubble pulse decreased; both the peak of high-frequency and low-frequency response of the plate decline slightly when alpha damping rising ,the high-frequency response mode almost have no change with different alpha damping ,while, the low-frequency response tends to be an obvious oscillation waveform when the alpha damping is too low; although the difference of the peak acceleration owing to shock wave and bubble reaches to tens of times, the strain responses caused by the two factors are very close, which enucleates that the train response is related to shock energy and has a higher sensitivity to time accumulation; both the peak acceleration and peak strain due to the shock wave remain steady and the two kinds of response by bubble pulse decrease with the centrifugal force increasing; when the target position is more close to the area that the shock wave vertically impact ,the linear correlation between peak velocity and shock factor is much better. Key words: underwater explosion; centrifugal effect; FEM.
1. Introduction
Understanding and prediction of the dynamic response of submerged structure subjected to underwater explosion (UNDEX) is an important step for naval ship designers. The UNEDX experiment is the major research method to study the structure responses and failure modes. A prototype experiment is very close to the real experimental condition; however, it also has the defects of high expense, complicated process and poor repeatability. And the available information obtained from a prototype experiment is frequently limited for the instrument used. So, comparing with the prototype experiment, the model experiment is more available to the UNDEX researchers.
By high-speed rotation, the centrifugal force is exerted by centrifuge on the model, and the self-weight stress, deformation and failure mechanism of the model can match the prototype [1], so the centrifuges can not only solve many conventional rock and soil mechanics ,such as the explosive-induced soil ejected kinematic and crater morphology [2], and the variably saturated flow in soil and fractured rock [3], but also directly simulate the damage effect of structures subjected to kinds of dynamic loadings, such as earthquake, explosion and impact [4-6], and other engineering problems such as dam construction by directional blasting, mining, slope treatment and foundation treatment [7-9]. Among them, the centrifugal model study on the dynamic responses and the protection of the structures under the impact of explosion loadings has become a hot topic of the research field of dynamics in recent years. Liu [10] carried out centrifuge experiment on the thin-walled aluminum tubes to investigate the response of transit tunnels in saturated soils under internal blast loading; De [11] simulated the effects of surface explosion on the underground tunnel with the centrifuge and gave potential mitigation measures through numerical analysis; De [12] also used centrifuge to build the physical model to study the effect of an underwater explosion on a buried tunnel and found that the strains in the tunnel increased with water level above the ground surfaces and then remained constant at a certain point ,which was related to the mass of explosives. Lu [13] conducted centrifugal model experiment on the brittle failure of a concrete dam subjected to underwater explosion and put forward the concept of the failure load intensity scale, and that the breaking strength of the brittle material scale is equal to the failure load intensity scale for the first time.
The interaction between the UNEDX shock loading and a structure is very complicated, and usually, the action time of shock wave is very short within a few microseconds while a bubble pulse can usually last for hundreds of microseconds [14]. Since the responses of structure subjected to UNDEX shock wave and bubble loading are totally different, only one part of structure response is studied in some researches. However, many experiments have proved the importance to consider both the two factors during an UNDEX analysis [15, 16]. With the fast development of study method, numerical simulation has become another important and effective approach to study UNDEX problems expect experiment and theoretical analysis. Based on the acoustic-structure coupling technique, the ABAQUS UNDEX Analysis (AUA) method [17] can effectively solve complex UNDEX problems. The advantages of the AUA are that the shock wave and the bubble pulse pressure can be both simplified as the acoustic wave, which means that the two different shock loadings can be unified, and they can be also imposed on the structures by steps according to the experimental conditions.
A plate panel is a basic structural component of ships and submerged structures. In this paper, UNDEX experimental studies carried out on an air-backed rectangular steel plate with different charge weights, standoff distances and centrifugal forces were presented. Small charges and micro detonators were used. The response of the plate panel remained within the elastic range, and no permanent deformation occurred. The numerical analysis of the plate was performed with ABAQUS finite element(FE) code and the results are compared with the experimental data from reference [18] and [19].
2. Approximation of shock loading
2.1. Shock wave
During an underwater explosion, there are two main shock loadings, shock wave and bubble pulse. The shock energy delivering to the structure by the underwater explosion is closely related to the charge weight and standoff distance. On the shock wave, Cole had made lots of experimental researches. By analyzing the pressure-time cures of the specific test point, he put forward the empirical formula of UNEDX shock wave based on the similarity theory. The shock pressure at a given point has a sharp peak in time, followed by a decaying exponential function, which can be given by [20]:
And the function of peak pressure Pm (MPa), and the time decay constant θ (μs) are:
where, P(t) is the pressure (MPa) at any instantaneous t (μs), W is the charge weight (kg), R is the standoff distance (m), R0 isthe shortest radial distance, td=(R-R0)/cwis the time delay (μs), cw is the sound velocity in water (m/s), and k1, k2, α1 and α2 are the shock wave parameters of the explosive.
2.2. Bubble pulse
On the periodic motion of bubble pulse, the approximate relation of the emergence time of the first of bubble pulse T (ms) and the maximum bubble radius rmax (cm) are given by Cole as follows [20]:
where D is the water depth (m) of the explosive, D0 is of equivalent water depth (m) of atmospheric pressure, which is about 10.33 m, and k3 and k4 are the motion parameters of the bubble.
Moreover, based on the assumption of linear compressible fluid, Geer and Hunter [21] derived the equations of motion of UNDEX bubble, through doubly asymptotic approximation technique (DAA), which simultaneously considers both dilation and translation during bubble oscillation. And the bubble motion can be expressed as:
where ρg and cg respectively represent density and corresponding sound velocity of inner gas product, ζ is the impedance of inner gas and outer fluid, PI is the hydrostatic pressure, which includes the atmospheric pressure, Pg is the gas product pressure, CD is the empirical flow drag parameter, and ED is the correction coefficient to match the experiment result. By giving the initial condition, the five characteristic parameters of bubble oscillation, namely, bubble radius a, floating upward displacement u, expansion velocity potential φl0, translational potential φl1 of outer fluid and translational potential φg1 of gas product, can be calculated with Runge-Kutta method.
And the free-field pressure during the bubble oscillation phase can be expressed as [22]:
where ¨V(t) and ¨a are the second derivative of bubble volume and radius versus time, respectively.
3. Experiment
3.1. Experiment setup
In this work, the experiments were performed on LXJ-4-450 centrifuge in IWHR laboratory, which has a maximal acceleration of 300 G, effective load of 1.5 t and maximal turning radius of 5.03 m. As Fig. 1 shown, the model box (1.2 m×0.7 m×0.9 m) was put in the basket (1.5 m×1.0 m×1.5 m) and excited centrifugal force NG along the cantilever direction. The model box was made with alloy plates fastened by bolts, and there was a glass observation window at one of side of the box. The inner walls of the box were coated with absorption materials to reduce the wave reflection. As indicated in Fig. 3, the steel plate of size 0.7 m×0.6 m×0.05 m with an exposed area of 0.6 m×0.65 mwas fastened by cement mortar with thickness of 5 cm at the right, left and bottom side. A3 steel was selected as the target plate and the water-storage depth in the model box was 0.6 m.
Fig. 1The centrifuge
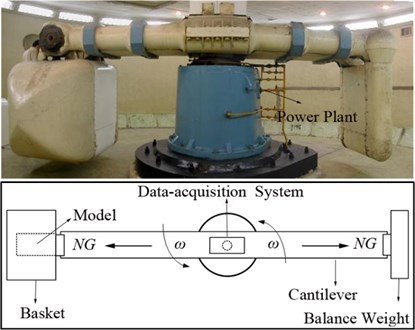
Fig. 2Micro detonators and RDX spherical explosives [18]
![Micro detonators and RDX spherical explosives [18]](https://static-01.extrica.com/articles/18646/18646-img2.jpg)
The explosives or micro detonators and the pressure sensor (ICP138) were located along the perpendicular line though the symmetry axis of the plate and at a same water depth. There was a high-speed camera (FASTCAM-ultima APX) with a frequency of 2000 fps and resolution of 1024×1024 put near the observation window to shoot the bubble pulse. The accelerometers (ICPM350B01) and strain gauges (TSJ120-4AA) were installed at the back of the plate (Fig. 4). All the dynamic signals were collected through data-acquisition system with 32 channels, which was put on the top of the shaft of centrifuge. The data-acquisition system was set delay trigger up to 20 ms to ensure obtain the complete measured data containing the initiating time of the charge. The sampling rate was set to 1 MHz, and the strain amplifier adopted 1/4 bridge circuit.
Fig. 3Schematic diagram of setting in model box (mm) [18]
![Schematic diagram of setting in model box (mm) [18]](https://static-01.extrica.com/articles/18646/18646-img3.jpg)
Fig. 4Schematic diagram of sensors setting (mm) [18]
![Schematic diagram of sensors setting (mm) [18]](https://static-01.extrica.com/articles/18646/18646-img4.jpg)
3.2. Explosives
In order to ensure precision in small quantity, RDX spherical explosives and micro detonators were used in the experiments (Fig. 2). The RDX spherical explosives are composed by two separated hemispherical explosives, and a 10 cm long detonating fuse with a diameter of 2.6 mm and equivalent TNT weight of 48 mg/m, was detonated by a micro detonator (RDX equivalent 50 mg) to guarantee the reliable central initiation of the charge. Thin plastic sleeve made by 3D printing, hot pyrocondensation (HP) pipe and hydrophobic membrane were adapted to tightly connect and protect the whole detonation device. The density of explosive is 1.65 g/cm3, the detonation heat is 5200 J/g, and the detonation velocity is 8160 m/s. Three micro detonators were bounded together to simulate the effect of 150 mg detonator in this work. The explosive is converted to TNT equivalent by a coefficient of 1.58.
3.3. Determining shock parameters of shock wave
Seventeen tests, using different amounts of RDX charges and detonators, were performed in this work. The experimental conditions are shown in Table 1, and W, CF, D, L and R separately represent charge weight, centrifugal force, water depth, test distance between the charge and the plate, and standoff distance between the charge and the pressure sensor. Since some errors may occur during experiments due to underwater currents and irregular tension from the signal cables , all the effective standoff distances in each case were modified by the multiplication of the wave-propagating velocity (1498 m/s, 25℃) [21] .The Fig. 5 shows some of the time-history of pressures measured, from which it can be found that the peak pressure increases with the decrease of R, and although there is some difference between the peak of S1 and S4 owing to the charge weight or test error, it can also prove that the centrifugal force have no effect on the shock wave, which can be also indicated in Table1. The reason is that the shock wave phase is too short, so the centrifugal (or gravity) effect can be ignored, and in addition, the peak pressure of S6 and S7 illustrate that the small change in water depth almost have no influence on the shock wave test of this work, so, the shock wave parameters can still be dealt with Eqs. (1) to Eqs. (3).
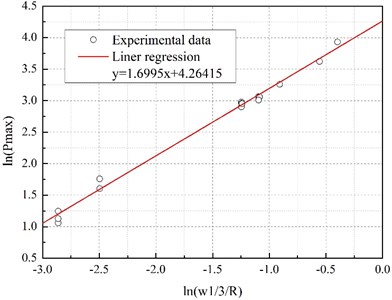
The relationship between peak pressure Pm and weight-distance parameter W1/3/R can be determined through a bi-logarithm linear regression [23], and the regressive curve is y= 1.6695x+ 4.26415, where, x=ln(P) and y=ln(W1/3/R). Fig. 6 shows the experimental data and regression curve. The peak pressure can be calculated by taking exponential of the curve, and the time decay constant can be obtained through a bi-logarithm linear regression on each pressure time-history curve. According to Eqs. (2) and (3), the peak pressure Pm and time decay constant θ are given as:
Table 1Experimental conditions and results [18]
No. | W (g) | CF (G) | D (cm) | L (cm) | R (cm) | Filmed | Pm (Mpa) | θ(μs) |
S1 | 1.02 | 20 | 30 | 30 | 35 | √ | 19.43 | 9.53 |
S2 | 1.021 | 30 | 30 | 30 | 35 | √ | 18.27 | 10.05 |
S3 | 1.023 | 40 | 30 | 30 | 35 | √ | 17.62 | 8.20 |
S4 | 1.025 | 40 | 30 | 30 | 35 | √ | 18.21 | -- |
S5 | 1.038 | 50 | 30 | 30 | 35 | √ | 19.28 | 10.21 |
S6 | 1.015 | 40 | 30 | 20 | 30 | 21.49 | 9.64 | |
S7 | 1.04 | 40 | 20 | 20 | 30 | 21.29 | 9.91 | |
S8 | 1.016 | 20 | 20 | 20 | 30 | 20.20 | 9.24 | |
S9 | 1.024 | 40 | 30 | 25 | 25 | 25.49 | 9..24 | |
S10 | 1.01 | 40 | 30 | 15 | 17.5 | 36.94 | 7.72 | |
S11 | 1.025 | 40 | 30 | 5 | 15 | √ | 49.35 | 7.39 |
S12 | 0.050 | 1 | 30 | 30 | 35 | √ | 3.5 | -- |
S13 | 0.050 | 20 | 30 | 30 | 35 | √ | 3.47 | 8.94 |
S14 | 0.050 | 40 | 30 | 30 | 30 | √ | 4.99 | 8.56 |
S15 | 0.050 | 30 | 25 | 30 | 35.4 | √ | 3.08 | 9.23 |
S16 | 0.150 | 20 | 37.5 | 30 | 35.8 | √ | 4.98 | 10.63 |
S17 | 0.150 | 40 | 30 | 30 | 35 | √ | 3.31 | 10.43 |
Fig. 5Pressure-time curves under different working conditions
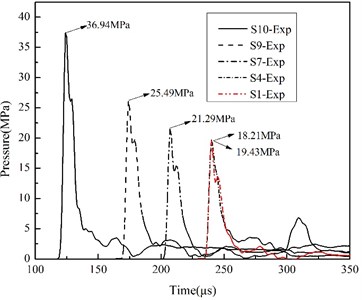
Fig. 6Relationship between peak pressure and weight-distance parameter of charge
3.4. Centrifugal effect on bubble pulse
Before every test, a scale was put at the same position of the charge and shoot by the high-speed camera. Many data points of every bubble image were depicted according to the scale to get the mean radius of the bubble at a given time, and since the detonation process is very short when compared with the bubble oscillation, the moment of the emergence of the highlight area for the first time was approximately regarded as the beginning time of the bubble oscillation.
Owing to the centrifugal force generated by the high-speed rotation of centrifuge, the gravitational field of fluid and bubble buoyancy change a lot. According to empirical Eq. (4) and (5), the motion parameters T and rmax of bubble are only related to the water depth D when the charge type and weight is determined. In this work, different centrifugal force NG were converted to water depth D based on the equivalent conversion of hydrostatic pressure, and with the test data of bubble, the emergence time of the first of bubble pulse T and the maximum bubble radius rmax are fitted as follows:
From Eqs. (12) and (13), and the bubble motion image (Fig. 9), it can be directly seen that T and rmax decrease with the increase of centrifugal force. And in order to explain this phenomenon in centrifugal model experiment, the radius-time and pressure-time curve of bubble are calculated through Eq. (6) to Eq. (9). Fig. 7 and Fig. 8 shows the comparison of Geer and Hunter model and experimental data.
Fig. 7History of bubble radius
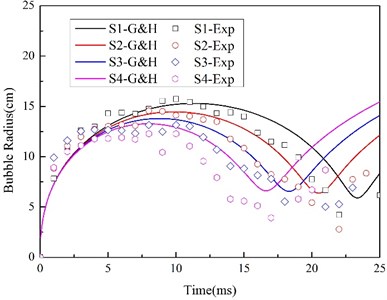
Fig. 8Pressure-time curves of bubble loadings [18]
![Pressure-time curves of bubble loadings [18]](https://static-01.extrica.com/articles/18646/18646-img8.jpg)
Fig. 9Bubble motion under different centrifugal forces

a) S2, CF= 30 G

b) S5, CF= 50 G
It can be seen that the change trend of the measured and the theoretically calculated bubble motion are compared well, and peak bubble loadings decline when centrifugal force rising, ignoring the initial charge weight difference. In addition, the theoretical loading curves are more symmetric as a result of assumption of symmetric bubble in Geer and Hunter model. Zamyshlyayev [24] also established a shock loading model dividing the whole explosive process into five phases. On the basis of Zam’s theory, the hydrostatic pressure higher, the peak bubble loading higher, which seems to be opposite to our result. And it is because of the assumption of still bubble in the first motion cycle in his model. However, when the centrifugal force increases more, the bubble oscillation become more obvious with the expansion and translational potential changing more sharply, so, the whole bubble displacement in vertical direction increase a lot, and the first bubble motion cycle shorten for the increasing drag force, which can be calculated by the Geer and Hunter model. In each case of this work, the pressure sensor was set up at a specific position, but the bubble center is a moving point source and the distance from the bubble center to the sensor lengthen with the rising centrifugal force, so, although the increase of initial hydrostatic pressure raises the bubble potential energy when bubble shrinking to the minimum radius, the measured loading peak decrease. As a result, in this work, the pressure field caused by bubble oscillation must take consideration of the vertical moving of bubble for the big change of centrifugal force.
4. Numerical simulation
Based on acoustic-structure coupling technique, the dynamic response of air-backed steel plate subjected to UNDEX explosion considering the centrifugal effect was simulated with explicit analysis on program ABAQUS 16.4.
4.1. Analytical model
On account of the fact that the inherent nature of the materials is mainly related to the electromagnetic forces, so the basic material properties in the centrifugal model can be regarded as to be the same with the conventional model [25]. The numerical model was established under the same experimental condition (Fig. 10), which was composed by three parts, namely, water, steel plate and cement mortar. Since the response of cement mortar is not the concern of this study, it was treated as discrete rigid body considering its specific shape and meshed with 22650 R3D4 4-node 3-D bilinear rigid quadrilateral elements [26]. In the simulation, the steel plate adapts the linear elastic model and the material constant used were summarized in Table 2. The plate part was modeled by 21000 C3D8R 8-node linear brick, reduced integration, hourglass control, solid elements, which is not easy to lead to volume locking and save computing cost, and the steel plate was meshed with five elements in the thickness direction to avoid hourglass [27].
Fig. 10Numerical model
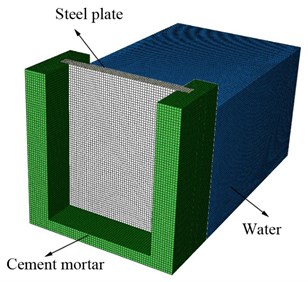
The external fluid water was approximate to a regular cuboid, so it was modeled using acoustic medium element AC3D8R, and the material property constant are also described in Table 2. AC3D8R element is a 8-node linear acoustic brick, reduced integration, hourglass control, solid element, which does not have displacement degrees of freedom [28] (Fig. 10). The explicit time integration method is a conditional stable integration and is closely related to the element characteristic length. Since the wavelength of shockwave increase with the frequency decreasing, the maximum permitted element length of fluid element Lmax, can be determined by calculating the upper range of shockwave frequency fmax. The general principal is Lmax<cw/(n.fmax), where n is the wavelength of the shock wave within the element, and the recommended value is n≥ 6. [29]. And the water domain was established with 444600 elements in the model.
Fig. 11General time-history curves of shock loading
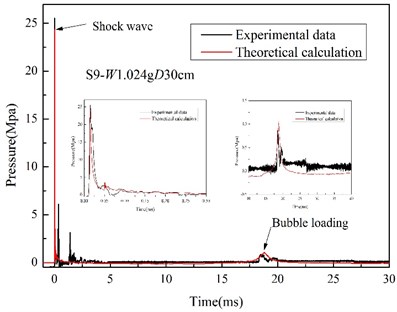
Fig. 12History of floatation displacement of the bubble
4.2. Boundary condition
The interface between steel plate, cement mortar and water respectively adapt acoustic-structure coupling interaction, the interaction between the plate and cement mortar was set as surface to surface contact, and the interfaces between steel plate, cement mortar and the inner walls of model box were separately set as clamped boundary. Although the fluid boundary may lead to the scattering and reflection, which will reinforce or weaken the shock loading, the influence of inner walls and free water surface were ignored in the simulation, considering the small weight of charges and test results. So, the interfaces between fluid and inner walls were set as non-reflective boundary and the reflective effect of free water surface was also not considered.
Table 2Material property constants of A3 steel and water
A3 steel property | Value [30] | Water property | Value [24] |
Density ρs | 7.83 kg/m3 | Density ρw | 1025 kg/m3 |
Poisson ratio | 0.3 | Underwater acoustic wave speed cw | 1498 m/s |
Young’s modulus E | 210 GPa | Vapor pressure of water Pv | 1780 Pa |
Yield stress δY | 790 MPa | Bulk modulus EB | 2.1404 GPa |
4.3. Input shock loading
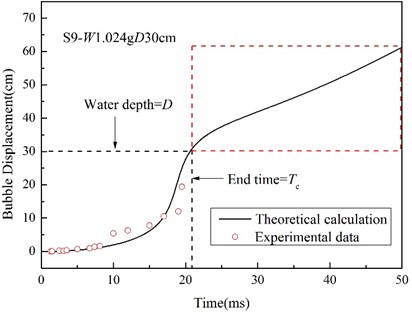
Usually, if the bubble oscillates at a very close distance near the surface of the structure or free surface, either the bubble motion cycle or the maximum bubble radius will be much affected , the bubble will be rejected at the expansion stage, and be drawn at the collapse stage, and a water jet will form ,which can be explained by the Bjerkness effect [31].While, in most cases of this work, the test distance L and water depth D was much bigger than the maximum bubble radius rmax (Fig. 7), namely, L/rmax> 2 and D/rmax> 2, so, the experiment condition can be approximately treated as mid-field or far-field underwater explosion [32]. Mu [33] applied MSC. Dytran to study the characteristics of UNDEX bubble under different boundary conditions, and found that when D/rmax> 2, the free surface will not influence the bubble oscillation, so the Geer and Hunter model can be applied to calculate the bubble motion parameters, which also has been proved in section 3.4 and reference [18]. From the comparison of the bubble motion tested and calculated, the boundary condition do not affect the bubble oscillation for most experiment cases a lot, so the general input loading-time curves of numerical model were approximately calculated from Eqs. (9) and (10). Fig. 11 compares the experimental and theoretical data of shock loading of S9, and considering the obvious bubble flotation, the theoretical vertical displacement-time curve is applied on the source point as a displacement constraint. When the bubble floats to the free water surface, namely the bubble displacement are equal to water depth, the loading input process in FEM analysis will automatically terminate at end time Te. Fig. 12 shows experimental and theoretical displacement of the bubble of S9, and only the data segment in the black dashed are valid.
4.4. Alpha damping effect on the response
Different from the static analysis, the dynamic analysis must consider the effect of structure deformation and motion, such as damping, which refers to the energy dissipation in the actual motion of the structure. Damping exists in most engineering problems, and even though it is only the approximated simulation of the energy absorption features of the structure, rather than the simulation of the physical mechanism bring about this effect, it is very important for obtaining accurate calculation results [34]. And the introduction of a reasonable damping value to the numerical simulation can effectively restrict numerical oscillation and increase the physical damping of the whole calculation system to make the numerical results better reflect the real physical phenomenon.
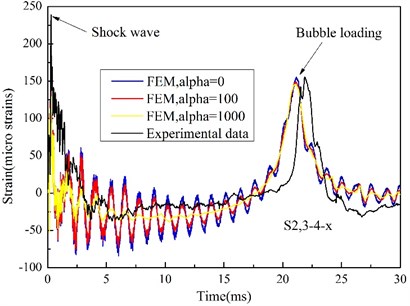
Since the interaction between the plate and UNDEX shock loading is the main concern of this work, the influence of mass ratio damping Alpha is mainly investigated. The Alpha factor define a damping contribution proportionate to element mass matrix, which is related to the absolute nodal velocity of the numerical model, and the effect of the definition of Alpha damping can be compared to the movement of the structure going through a viscous liquid [35], therefore, any nodal movement in the model can lead to the damping force. In the ABAQUS/Explicit analysis, the oscillation of low-frequency response can be effectively adjusted by setting a reasonable Alpha damping [26]. Fig. 13 and Fig. 14 show the effect of Alpha damping on the acceleration and strain response of the steel plate, from which it can be seen that the effect is significant. Both the peak of high-frequency responses caused by shock wave impact and low-frequency responses induced by bubble pulse has a little decline with Alpha damping increasing. However, comparing with high-frequency responses, low-frequency responses are more sensitive to the change of Alpha damping. When Alpha damping is very small, the low- frequency responses of acceleration and strain tend to be obvious oscillations, and the acceleration even cannot be distinguished (Fig. 13), while the high-frequency responses almost keep a stable mode of vibration. And by a great deal of trail calculation, the numerical results agree well with the test results when Alpha damping is close to 1000.
Fig. 13Time history of acceleration at measurement point AC-1
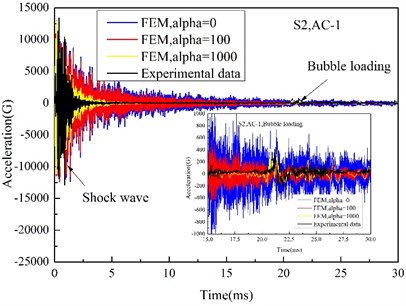
Fig. 14Time history of transverse strain at measurement point 3-4
5. Result and discuss
5.1. Acceleration
Comparison of numerical and tested peak acceleration at various measurement points on the target plate is shown in Table 3. Combined with Fig. 13, it can be seen that the difference between the peak of high-frequency and low-frequency response is very obvious, which is corresponding to the peak loadings and reaches to tens of times. The peak acceleration induced by shock wave is relatively steady, and the peak acceleration caused by bubble pulse decrease gradually for rising centrifugal forces. Owing to the test error, some test and numerical data does not fit very well, and when the standoff distance is very small (15 cm at S10 and 5 cm at S11), the errors between experimental and numerical results all become very big, and it is because that when the charge is very close to the target plate, the formation of bubble jet is greatly affected, which impact the plate like a water hammer [36], and the shock wave and bubble loading will significantly interrelate, so the approximate treatment for free field of a bubble pulse in is not very appropriate again.
5.2. Velocity
Although the particle velocity of the steel plate was not measured in this work, it can be obtained through integration the measured accelerations. And since the acceleration peaks caused by shock wave loading are much bigger than that of the bubble loading, only the velocity responses during shock wave phase are discussed. The period of the integration was from the arrival of the shock front to local cavitation occurred [37]. In the light of the complex constraint boundary of steel plate and initiation condition of charge, some simplification were adopted in the velocity analysis, including that the transmission of shock wave into the plate are ignored, and that the included angle between the straight line through the source point and a given particle and the normal through the source point is equal to the incident and reflection angle of shock wave, and lastly, the upper surface of the plate part exposed to the air is handled as a clamped boundary. Rajendran [38] have derived the particle velocity of plate under normal incident shock wave, and an angle parameter ω were introduced in this paper to calculate the velocity considering the impact at any angle of incidence.
Table 3Peak acceleration (G) at various measurement points on the target plate
NO | AC-1 | AC-2 | AC-3 | ||||
Shockwave | Bubble | Shockwave | Bubble | Shockwave | Bubble | ||
S1 (20 G) | Experiment | 17013 | 235 | 13028 | 426 | 8396 | 155 |
FEM | 13381 | 434 | 9829 | 420 | 7889 | 401 | |
S2 (30 G) | Experiment | 13579 | 398 | 9769 | 360 | 7922 | 305 |
FEM | 13291 | 406 | 9963 | 355 | 7827 | 328 | |
S4 (40 G) | Experiment | 13422 | 355 | 9847 | 331 | 8108 | 276 |
FEM | 13345 | 336 | 9810 | 324 | 7863 | 308 | |
S5 (50 G) | Experiment | 13827 | 291 | 9990 | 243 | 8020 | 239 |
FEM | 13375 | 272 | 9763 | 209 | 7818 | 187 | |
On the basis of boundary continuity, the velocity of the particle on the incident side is calculated as:
And according to Talyor’s theory [39], the total pressure in normal direction, which acted on the air-backed plate can be expressed as:
where vp(t) is the normal velocity of the particle on the plate-water boundary, Pi(t) and Pr(t) are the incident and reflected shock wave, respectively, ω is the incident angle, which is equal to reflection angle, and Ptotal(t)is total wall pressure of the plate.
The particle velocity can be obtained by substituting Eq. (1) into Eq. (13) and Eq. (14):
where mp is plate mass per unit area, and β is the characteristic mass ratio. When Ptotal(t) drop to zero, the plate and fluid will be separate and cavitation occur [37], the acceleration process of plate owing to shock wave stop and the normal velocity of plate particle reach to the maximum, given by:
Fig. 15Relationships between the peak velocity and shock factor
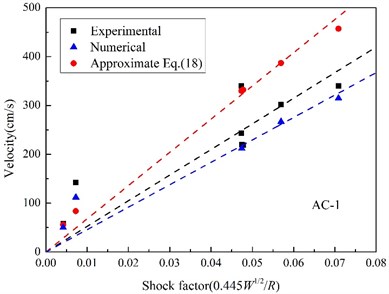
a) AC-1
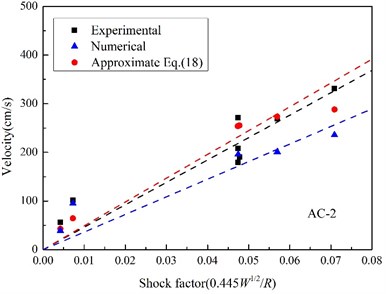
b) AC-2
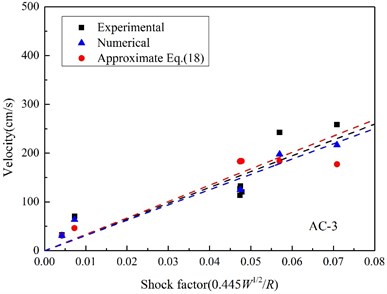
c) AC-3
The time t0, when the total wall pressure drops to zero, can be calculated as:
And vmax is covert to the theoretical result of Rajendran [38] at ω= 0.
In UNDEX researches, shock factor is always regarded as an effective characteristic parameter indicating shock energy of UNDEX shock wave, and a shock factor is adopted in this paper to evaluate the velocity response, which is defined as [40]:
Fig. 15 shows the maximum velocity obtained by integrating measured acceleration, approximated by Eq. (18) with peak pressure, and the velocity calculated by the finite element method. All scattered points of peak velocity are linear fitted with the shock factor from the original point, and it can be found that the linear correlation between the peak velocity and the shock factor is much better at the position, where it is much closer to the area the shock wave vertically impact. In particular, when the standoff distance reduces to a certain extent (in Fig. 15(c)), the peak velocity calculated by Eq. (18) begins to decrease with shock factor increasing, which is not consistent with the experimental and numerical results, and it is because of the approximation of the incident angle. When the target position is far from the point shock wave vertically incidents upon, the approximated oblique incidence angle is too big and not reasonable again.
5.3. Strain
In this work, all the strain gauges were firmly adhered to the steel plate, and the experimental and numerical peak strain (S1, S2, S4 and S5) at various measurement points were indicated in Fig. 16 and Fig. 17. The peak strain caused by shock wave in experiment are relatively decentralized for test errors, and most of the experimental peak strains induced by bubble pulse well match the numerical peaks. From the numerical results, it is can be seen that the peak strains induced by shock wave remain stable when centrifugal force changing, the peak strains due to bubble pulse also fall with the centrifugal force increasing, just like the peak accelerations, however, the peak strains induced by the two factors are very close, which is totally different from the acceleration responses.
Fig. 16Peak strain caused by UNDEX shock wave
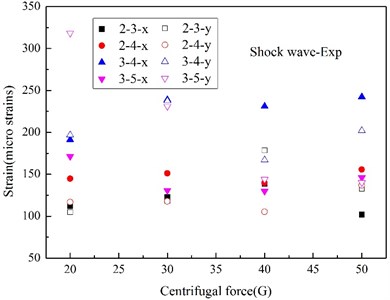
a) Experimental [19]
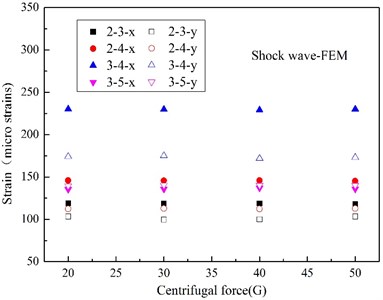
b) Numerical
According to the modal analysis theory on distributed strain measurement [41], the strain response is more similar to the displacement response than the acceleration response, and it is more sensitive to the low-frequency response from the angle of time-frequency domain, which are the responses caused by bubble pulse in this work. Although the pressure of bubble pulse is much lower than that of the shock wave, the duration time of bubble pulse is much higher than that of shock wave, so, even though the high-frequency responses of the strain and acceleration are similar, the change amplitudes of the low-frequency responses of the strain are much higher in contrast to the acceleration responses for the accumulation of time domain. In other words, the strain responses are more sensitive to time accumulation than the acceleration responses. Moreover, from the angle of shock energy, although there is a big difference between the peak pressure of the shock wave and the bubble pulse, the shock energy carried by shock wave and bubble are close [20], so, the difference between the acceleration and strain response can illustrates that the strain response is tightly related to shock energy. And actually, Rajendran has [42] deduced the maximum equivalent strain at one position of the plate in the light of air-backed steel plate impacted only by shock wave, which can be expressed as a function related to peak pressure and decay time, and it can also indirectly elucidate this phenomenon.
Fig. 17Peak strain caused by bubble pulse
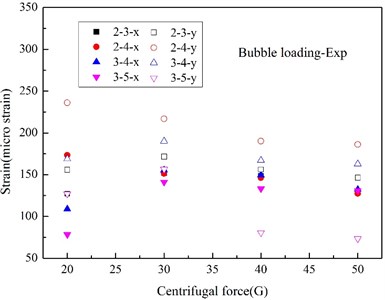
a) Experimental
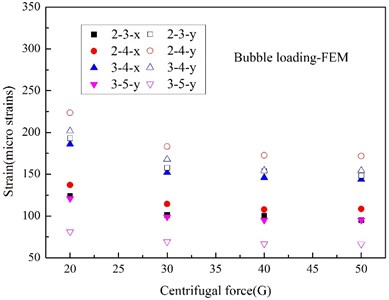
b) Numerical
6. Conclusions
In this study, the UNEDX experiments were carried out in a centrifuge to expound the dynamic response of an air-backed steel plate impacted by shock loadings. The bubble oscillation considering centrifugal effect were predicted with Geer and Hunter model, and the experimental response were compared with Finite element analysis under the same plate and shock loadings. According to the experimental and numerical results, we conclude the following:
1) The centrifugal force has no effect on UNDEX shock wave for the short function time, however, with the increase of centrifugal force, the initial hydrostatic pressure increase, the bubble motion cycle and maximum bubble radius decrease, the floating upward of the bubble become more obvious, and the peak pressure of bubble pulse decrease.
2) Both the high-frequency and low-frequency response have a slight decline as the alpha damping rising; the vibration model of high-frequency response remains stable when centrifugal force changes and the low-frequency response tend to be an obvious oscillation waveform as the alpha damping is too low.
3) The difference between the peak accelerations respectively induced by shock wave and bubble pulse are very large ,tending to be tens of times, while, the peak strains caused by the two factors are very close, which illustrates that the strain response is related to shock energy and more sensitive to time accumulation; during the shock wave impact ,both the acceleration and strain response are not influenced by centrifugal force and the two kinds of response peaks decline with centrifugal force increasing.
4) The linear correlation between the peak velocity and the shock factor is much better at the position, where it is closer to the area shock wave vertically impact.
References
-
Ulgen D., Saglam S., Ozkan M. Y. Dynamic response of a flexible rectangular underground structure in sand: centrifuge modeling. Bulletin of Earthquake Engineering, Vol. 13, Issue 9, 2015, p. 2547-2566.
-
Ronald Pak Y. S. Centrifuge characterization of buried, explosive-induced soil ejecta kinematics and crater morphology. Journal of Dynamic Behavior of Materials, Vol. 2, Issue 3, 2016, p. 306-325.
-
Jones Brendon R., Brouwers Luke B., Van Tonder Warren D., et al. Assessing geotechnical centrifuge modelling in addressing variably saturated flow in soil and fractured rock. Environmental Science and Pollution Research, Vol. 24, Issue 15, 2014, p. 13203-13223.
-
Zana Karimi, Shideh Dashi Seismic performance of shallow founded structures on liquefiable ground: validation of numerical simulation using centrifuge experiments. Journal of Geotechnical and Geoenvironmental Engineering, Vol. 142, Issue 6, 2016, https://doi.org/10.1061/(ASCE)GT.1943-5606.0001479.
-
Lanzano Giovanni, Bilotta Emilio, Russo Gianpiero, et al. Experimental and numerical study on circular tunnels under seismic loading. European Journal of Environmental and Civil Engineering, Vol. 9, 2015, p. 539-563.
-
Abate Glenda, Massimino Maria Rossella, Maugeri Michele Numerical modelling of centrifuge tests on tunnel-soil systems. Bulletin of Earthquake Engineering, Vol. 13, Issue 7, 2015, p. 1927-1951.
-
Zhang Zelin, Wang Tao, Wu Shuren, et al. Seismic performance of loess-mudstone slope by centrifuge tests. Bulletin of Engineering Geology and the Environment, Vol. 76, Issue 2, 2017, p. 671-679.
-
Mehrzad B., Haddad A., Jafarian Y. Centrifuge and numerical models to investigate liquefaction-induced response of shallow foundations with different contact pressures. International Journal of Civil Engineering, Vol. 14, Issue 2, 2016, p. 117-131.
-
Park Dong Soon, Kim Nam Ryong Safety evaluation of cored rockfill dams under high seismicity using dynamic centrifuge modeling. Soil Dynamics and Earthquake Engineering, Vol. 97, 2017, p. 345-363.
-
Liu Huabei, Asce M., Nezili Soufiane Centrifuge modeling of underground tunnel in saturated soil subjected to internal blast loading. Journal of Performance of Constructed Facilities, Vol. 30, Issue 2, 2016, https://doi.org/10.1061/(ASCE)CF.1943-5509.0000760.
-
De Anirban, Zimmie Thomas F. Effects of surface explosion on underground tunnel and potential mitigation measures. Transportation Infrastructure Geotechnology, Vol. 3, Issue 2, 2016, p. 74-90.
-
De Anirban, Niemiec Anthony, Zimmie Thomas F. Physical and numerical modeling to study effects of an underwater explosion on a buried tunnel. Journal of Geotechnical and Geoenvironmental Engineering, Vol. 143, Issue 5, 2017, https://doi.org/10.1061/(ASCE)GT.1943-5606.0001638.
-
Lu Lu, Kong Xianjing, Dong Yun, et al. Similarity relationship for brittle failure dynamic model experiment and its application to a concrete dam subjected to explosive load. International Journal of Geomechanics, Vol. 17, Issue 8, 2017, https://doi.org/10.1061/(ASCE)GM.1943-5622.0000889.
-
Rajendran R. Reloading effects on plane plates subjected to non-contact underwater explosion. Journal of Materials Processing Technology, Vol. 206, 2008, p. 275-281.
-
Julian Lee J., Malcolm Smith J., James Huang, et al. Deformation and rupture of thin steel plates due to cumulative loading from underwater shock and bubble collapse. Shock and Vibration, Vol. 18, 2011, p. 459-470.
-
Hao Wang, Xi Zhu, Yuan Sheng Cheng, et al. Experimental and numerical investigation of ship structure subjected to close-in underwater shock wave and following gas bubble pulse. Marine Structures, Vol. 39, 2014, p. 90-117.
-
Yin Caiyu, Jin Zeyu, Chen Yong, et al. Shock mitigation effects of cellular cladding on submersible hull subjected to deep underwater explosion. Ocean Engineering, Vol. 117, 2016, p. 221-237.
-
Hu Jing, Chen Zuyu, Zhang Xuedong, et al. Underwater explosion in centrifuge Part I: Validation and calibration of scaling laws. Science China Technological Sciences, 2017, https://doi.org/10.1007/s11431-017-9083-0.
-
Long Y., Zhou H. Y., Liang Z. Q., et al. Underwater explosion in centrifuge Part II: Validation and calibration of scaling laws. Science China Technological Sciences, 2017, https://doi.org/10.1007/s11431-017-9107-2.
-
Cole R. H. Underwater explosions. Princeton University Press, Princeton, New Jersey, 1948.
-
Geers T. L., Hunter K. S. An integrated wave-effects model for an underwater explosion bubble. Journal of the Acoustical Society of America, Vol. 111, Issue 4, 2002, p. 1584-1601.
-
Hunter Kendall S., Geers Thomas L. Pressure and velocity fields produced by an underwater explosion. Journal of the Acoustical Society of America, Vol. 115, Issue 4, 2004, p. 1483-1496.
-
Hung C. F., Hsu P. Y. Elastic shock response of an air-backed plate to underwater explosion. International Journal of Impact Engineering, Vol. 31, 2005, p. 151-168.
-
Zamyshlyayev B. V., Yakovlev Yu S. Dynamic Loads in Underwater Explosion. Naval Intelligence Support Center, 1973.
-
Tsinidis Grigorios, Rovithis Emmanouil, Pitilakis Kyriazis, et al. Seismic response of box-type tunnels in soft soil: Experimental and numerical investigation. Tunnelling and Underground Space Technology, Vol. 59, 2016, p. 199-214.
-
Fernandes F. A. O., Jardin R. T., Pereira A. B., et al. Comparing the mechanical performance of synthetic and natural cellular materials. Materials and Design, Vol. 82, Issue 5, 2015, p. 335-341.
-
Yin C., Jin Z., Chen Y., et al. Shock mitigation effects of cellular cladding on submersible hull subjected to deep underwater explosion. Ocean Engineering, Vol. 117, 2016, p. 221-237.
-
Helal Mahmoud, Elsayed M. K., Fathallah, et al. Dynamic behavior of stiffened plates under underwater shock loading. Materials Testing, Vol. 57, 2015, p. 506-517.
-
Jen Chan Yung, Tai Yuh Shiou Deformation behavior of a stiffened panel subjected to underwater shock loading using the non-linear finite element method. Materials and Design, Vol. 31, 2010, p. 325-335.
-
Chen Gang, Huang Xicheng Simulation of deformation and fracture characteristics of a 45 steel Taylor impact specimen. Engineering Transactions, Vol. 64, Issue 2, 2016, p. 225-240.
-
Blake J. R., Gibson D. C. Cavitation bubbles near boundaries. Annual Review of Fluid Mechanics, Vol. 19, 1987, p. 99-123.
-
Lei Liu, Rui Guo, Ke Gao, et al. Full-field peak pressure prediction of shock waves from underwater explosion of cylindrical charges. Propellants, Explosives, Pyrotechnics, 2017, https://doi.org/10.1002/prep.201700070.
-
Mu Jin Lei, Zhu Shi Jian, Diao Ai Min, et al. Analysis on the characteristics of UNDEX bubbles under different boundary conditions. Journal of Vibration and shock, Vol. 33, Issue 13, 2014, p. 92-97, (in Chinese).
-
Clogh R. W., Penzien J. Dynamics of Structures. McGraw-Hill, 1975.
-
Spence P. W., Kenchington C. J. The Role of Damping in Finite Element Analysis. Report R0021, Nafems Ltd.,1993.
-
Gauch E., Leblanc J., Shillings C., et al. Response of composite cylinders subjected to near field underwater explosions. Dynamic Behavior of Materials, Vol. 1, 2016, p. 153-157.
-
Ma Kinen K. Cavitation models for structures excited by a plane shock wave. Journal of Fluids and Structures, Vol. 12, 1998, p. 85-101.
-
Rajendran R., Lee J. M. Blast loaded plates. Marine Structures, Vol. 22, 2009, p. 99-127.
-
Taylor G. I. The pressure and impulse of submarine explosion waves on plates. Compend Underwater Explos Res ONR, Vol. 1, 1950, p. 1155-74.
-
Rajendran R., Narasimhan K. A shock factor based approach for the damage assessment of plane plates subjected to underwater explosion. Journal of Strain Analysis for Engineering Design, Vol. 40, 2006, p. 417-425.
-
Li S. Z., Wu Z. S. Development of distributed long-gage fiber optic sensing system for structural health monitoring. Structural Health Monitoring, Vol. 6, Issue 2, 2007, p. 133-143.
-
Rajendran R., Narasimhan K. Linear elastic shock response of plane plates subjected to underwater explosion. International Journal of Impact Engineering, Vol. 25, 2001, p. 493-506.
Cited by
About this article
This research was supported by the National Nature Science Foundation of China (No. 51339006, No. 51508569), and the National Nature Science Foundation of Jiang Su Province (No. Bk20151449).
Jianyu Wu is the principal person to complete this paper, Long and Zhong gave important advice to this paper, and Song and Hu participated in the experiment of this paper.

