Abstract
A one-fifth scale, two-story, two-bay reinforced lightweight aggregate concrete (LWAC) frame subjected to quasi-static cyclical loading was analyzed to investigate the seismic behavior of this innovative system, primarily focusing on the failure modes, plastic hinge mechanism, load-deformation response, skeleton curves, stiffness degradation and energy dissipation capability. Overall, the test demonstrates that the LWAC frame meets the requirement of a “strong-column and weak-beam, strong-joint and weak-member” design criteria, exhibiting a mixed failure mechanisms consisting of both the beam hinge mechanism and column hinge mechanism. The former was the predominant failure mechanism and was fully developed after reaching the peak load point, while the latter was the inevitable result in the final failure of the LWAC frame. The fatter hysteretic loop and the displacement ductility factor Δu/Δy of 3.49 observed from LWAC frame indicate excellent energy dissipation and reliable displacement ductility capability, which are comparable to those of NWC frames. The test data observed in this study can provide theoretical guidance for the application of LWAC frames in seismic regions.
1. Introduction
Lightweight aggregate concrete (LWAC) has many advantages including better durability, higher fire-resistance capacity, lower permeability and can effectively reduce the dead load and dimensions of elements while improving the seismic resistance capacity of building structures [1, 2]. During the production of lightweight aggregates and the resulting concrete, substantial industrial wastes are used in order to protect the ecological environment. Therefore, LWAC has been widely used in bridge engineering and high-rise building construction [3, 4]. However, due to the lower elasticity modulus and significant brittle character, shear failure easily occurs in LWAC elements. To promote the engineering application of this material, especially in seismic zones, it is crucial to ensure the proper ductility of structures and members.
In 1971, the San Fernando Valley in California experienced a 6.6 magnitude earthquake. Many buildings constructed of LWAC, including the Olive View Hospital, were severely damaged or collapsed due to shear failure. Initial investigation showed that the brittle defects of LWAC might have been the main cause for the collapses, while subsequent studies indicated that the building collapses were mainly caused by the unreasonable consideration of ductility design and the insufficient configuration of lateral shear reinforcements. During the 1989 Loma Prieta earthquake with a magnitude of 6.9, high-strength LWAC columns in highway overpasses experienced serious damage due to the same causes, namely, insufficient shear reinforcements and poor ductility. Thus, by acknowledging that the brittle feature will become more evident with an increase in the concrete strength, the American code (ACI 318-08) limited the application of high-strength LWAC. It also simultaneously emphasized that the compressive strength of LWAC should be lower than 34.5 MPa unless it can be ensured with proper ductility through experimental investigation.
Several experimental tests were performed to investigate the seismic performance of lightweight concrete components under cyclic loads. Kowalsky et al. demonstrated that LWAC columns exhibit slightly lower shear resistant capacity and ductility but a comparable energy dissipation capability when compared to normal weight concrete (NWC) specimens [5]. Rabbat et al. tested sixteen full-scale column-beam assemblies representing a portion of a frame subjected to simulated seismic loading and indicated that the ductility of the LWAC columns can be significantly improved by the increasing of the lateral reinforcement ratio [6]. Hendrix and Kowalsky compared the seismic behavior of LWAC and NWC square columns and stated that the LWAC columns can also meet the requirement of seismic performance when properly improving the concrete strength and lateral reinforcement ratio [7]. Thereafter, Decker et al. focused on determining the behavior of LWAC beam-column joints and implied that, if designed and detailed in accordance with current code provisions and if joint shear stress is kept within a reasonable limit, high-strength LWAC beam-column joint can perform as well as similarly built NWC specimens [8].
This paper reviews the preparation and testing of a one-fifth scale, two-story, two-bay LWAC frame subjected to quasi-static cyclical loading that gave an indication of its ductility in seismic events. Reported test results, including the loading process, failure modes, plastic hinge mechanism, load-deformation response, skeleton curves, stiffness degradation and energy dissipation capability were fully discussed. The results of experiments and the analysis reported in this paper will help to characterize the seismic behavior of LWAC frames.
2. Experimental program
2.1. Design of testing model frame
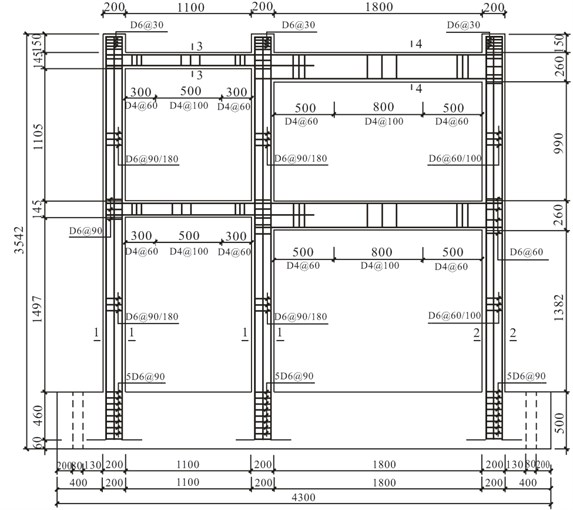
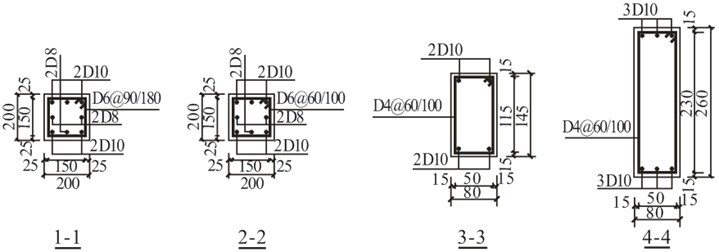
A three-story reinforced concrete high-speed train station designed under the seismic fortification intensity of 7 degrees was chosen as the prototype structure. The main structure adopts the cast-in-place reinforced concrete framework with a designed strength of 30 MPa (Fig. 1). A one-fifth scale model of the lower two-stories of the original frame was constructed in accordance with the principle of “strong column and weak beam, strong shear strength and weak flexural strength and strong joint and weak member” design criteria. Table 1 summarizes the details of the test frame and Fig. 2 depicts the instrumentation and reinforcement details of the model frame.
Fig. 1The original framework model
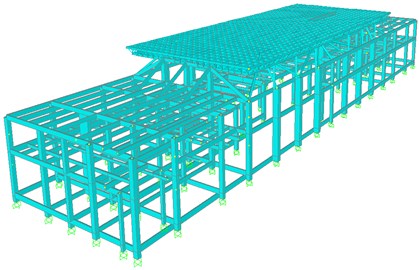
Table 1Basic configuration of prototype and model frame
Items | Floor height (mm) | Bay span (mm) | Beam size (mm) | Column size (mm) | |||
First | Second | Left | Right | Left | Right | ||
Prototype frame | 7850 | 6250 | 6500 | 10000 | 725×400 | 1300×400 | 1000×1000 |
Model frame | 1570 | 1250 | 1300 | 2000 | 145×80 | 260×80 | 200×200 |
The test model was cast using LWAC and the mixture proportion is shown in Table 2. Expanded shale with a maximum size of 16 mm and natural sand were used as lightweight coarse aggregates and fine aggregates, respectively. In should be noted that the expanded shale aggregates with special water absorption properties should be wet sufficiently before mixing with the rest of the materials to maintain a uniform water volume fraction. All materials were mixed in a standard forced mixer and three groups of standard test cubes with a dimension of 150 mm were reserved to determine the compressive strength of the LWAC. Both test cubes and frame models were wet-cured for seven days and then cured under a natural environment until testing. The measured values of the mechanical properties of LWAC and steel bars are shown in Table 3. Hot rolled ribbed bars with diameters of 10 mm and 8 mm were used as the longitudinal reinforcement of the model frame beams and columns. The plain bars with a diameter of 6 mm and the wires with a diameter of 4 mm were used as the lateral reinforcements in columns and beams, respectively. The properties of steel bars shown in Table 3 were obtained through tensile tests carried out on three coupon samples with a length of 450 mm. The model frame was built on a foundation beam that was fixed to the strong reaction floor.
Fig. 2Instrumentation and reinforcement details of the model frame
a)
b)
Note: C, S, LG, W, WR and FA refer to cement, natural sand, lightweight coarse aggregate, water, high-range water-reducing admixture and fly ash, respectively; w/c is the water-cement ratio by weight, S/A is the fine aggregate-to-total aggregate ratio by volume.
Table 2Mixture proportion of LWAC
Mixture | w/c (%) | S/A (%) | Mixture proportions per unit volume (kg/m3) | |||||
C | S | LG | W | HRWRA | FA | |||
LWAC | 33 | 35 | 432 | 675 | 475 | 173 | 9.5 | 95 |
Table 3Properties of LWAC and reinforcing steel
Material | Experiment items | Measured values |
LWAC | Cubic strength of compression (MPa) | 45.7 |
Elastic modulus (GPa) | 210 | |
Dry density of hardened concrete (kg/m3) | 1760 | |
Longitudinal reinforcement (HRB400) | Yield strength (MPa) | 532 for D10; 488 for D8 |
Ultimate tensile strength (MPa) | 725.6 for D10; 656.6 for D8 | |
Lateral reinforcement (HPB300) | Yield strength (MPa) | 467 for D6 |
Ultimate tensile strength (MPa) | 646.6 for D6 |
2.2. Loading method and instrumentation
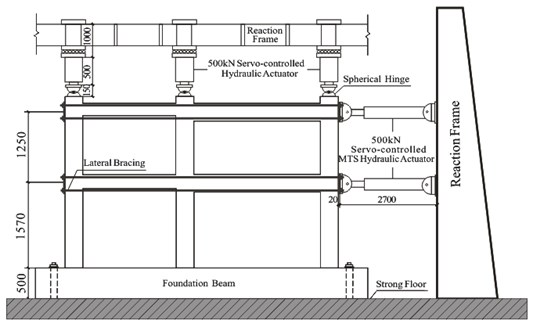
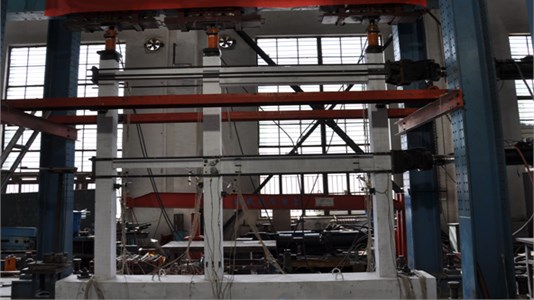
Initially, constant axial compressive loads of 253 kN were applied on the top of three frame columns by servo-controlled hydraulic actuators to simulate the gravity load of the upper frame (Fig. 3).
Fig. 3Test setup and instrumentation
a)
b)
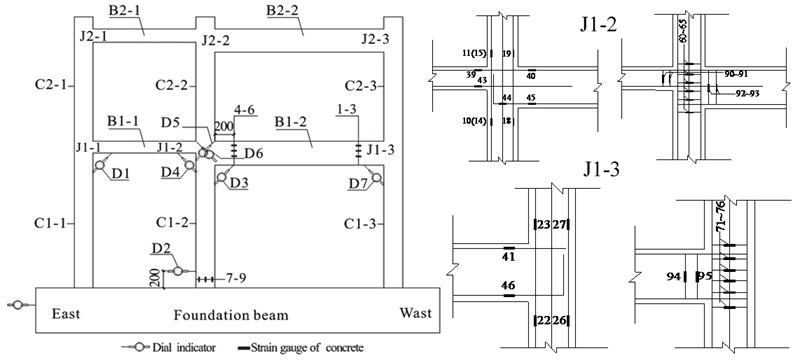
The axial compressive ratio remained constant at 0.2 throughout the test and was monitored using the built-in load cell of the actuator. To ensure relatively friction-free movement, rollers were attached to the top of the frame columns. Thereafter, the constant axial load was maintained and the lateral forces were applied on the first and second floor beam ends by two servo-controlled 500 kN MTS hydraulic actuators. Lateral bracing was provided in the direction of the applied load. To simulate the inverted triangular distribution of the lateral force, the loading ratio of 1:0.55 was adopted. The load-controlled method was chosen as the initial loading method, as shown in Fig. 4. When the first crack occurred on the concrete surface, the loading method was changed to displacement-controlled. To reflect the cumulative damage, each level of the story drift ratio was repeated three times. The imposed lateral forces and displacements were measured with the built-in load cell and displacement transducer of the actuator. Two steel beams were attached to the testing frame on either side of the specimen, parallel to the direction of loading, to prevent any out-of-plane displacement during testing. Additional dial indicators were used to measure the special sectional rotation angles, as shown in Fig. 5. Several strain gauges were affixed on the reinforcement steel bars and LWAC surfaces at selected locations of the first floor columns and first floor beams. However, the crack patterns were monitored at all locations throughout the testing.
Fig. 4Loading history
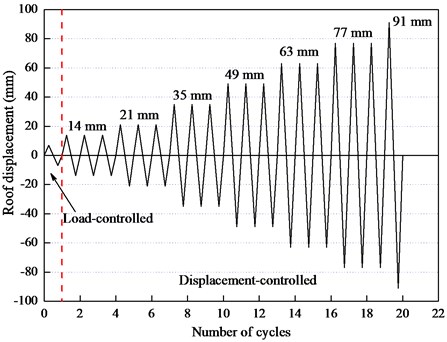
Fig. 5Dial indicator and strain gauge configuration
3. Results and discussion
3.1. General observation and failure modes
During the test, the LWAC frame experienced four phases, including cracking, yielding, peak load and ultimate under quasi-static cyclical loading. The cracking features at each loading stage were summarized as follows:
3.1.1. Cracking phase
At the base shear force P of ±38.7 kN, several minor flexural cracks were initially observed at the mid-span of each floor beam with a width of 0.02-0.04 mm. When the base shear increased to ±54.13 kN, the flexural cracks formed within the 1st floor columns at the base with a maximum width of 0.06 mm. Although the crack width developed slowly during the subsequent displacement-controlled loading stage, the amount of cracks continually increased. Minor cracks occurred at the core zone of the interior joint J1-2 with a width of 0.04 mm until the roof displacement was equal to ±21 mm. The amount of cracks near the base of the 1st floor columns propagated rapidly with the maximum width opened to approximately 0.1 mm.
3.1.2. Yielding phase
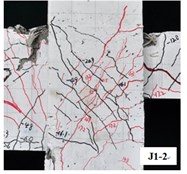
The beginning of the yielding phase was defined as the occurrence of the hysteretic curve inflection point. After the cracking of sub-components, the crack widths near the 1st floor beam and column ends gradually developed and extended to 1.8 mm and 0.16 mm, respectively, as the roof displacement and loading cycles increased. The LWAC frame exhibited elastic-plastic deflection behavior accompanied by slight stiffness degradation. The amount of cracks within the core zone of the 1st floor interior joint (J1-2) rapidly increased and the main diagonal cracks running through the joint core along the diagonal direction were formed with widths approximately equal to 0.1 mm.
3.1.3. Ultimate phase
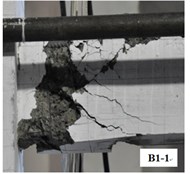
At the roof displacement of ±35 mm, the left end of the 1st floor beam (B1-1) showed distributed cracks of up to 3 mm in width and significant spalling of the concrete cover. Many coarse lightweight aggregates were cut off, accompanied by a loud cracking sound. Large cracks measuring approximately 6 mm opened between the bottom of the column and the footing–presumably due to yield penetration of the longitudinal bars in the column footing. The cracks within the core region of the 1st floor interior joint grew to widths of 0.24 mm and were accompanied by the formation of X-shaped major diagonal cracks. As the roof displacement increased to ±49 mm, the left end of the 1st floor beam B1-1 experienced severe damage accompanied by the longitudinal and transverse reinforcements becoming exposed. Meanwhile, the widths of cracks appeared near the right end of the 1st floor beam B1-2 increased to 1.2 mm with the peeling of the concrete cover. Both the amounts and widths of the cracks formed at the region of columns and joints exhibited rapid development and the LWAC frame reached the maximum load-carrying capacity.
3.1.4. Failure phase
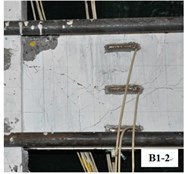
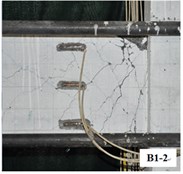
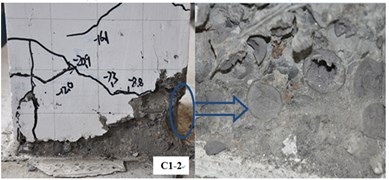
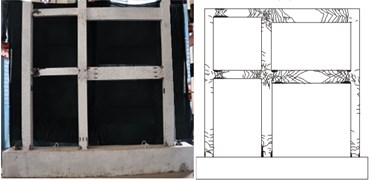
When the roof displacement reached ±63 mm, the right end of beam B1-1 and the both ends of beam B1-2 were severely damaged, indicating the formation of plastic hinges (Figs. 6(a)-6(c)). The crack widths at the column base extended to 2 mm, and the concrete cover began spalling off. At a roof displacement of 77 mm, the crack widths near the interior column base measured up to 3 mm accompanied by the significant crushing of concrete and the buckling of longitudinal reinforcements. There was severe hanging at the column bases (Fig. 6(e)). After the load-carrying capacity of the LWAC frame dropped to 85 % of the peak load, the LWAC still experienced three loading cycles at a roof displacement of 91 mm and the tests were terminated. The final failure mode of the overall frame model is shown in Fig. 6.
Fig. 6Typical conditions of beams, beam-column connections and base columns
a)
b)
c)
d)
e)
f)
3.2. Plastic hinge mechanism
Table 4 summarizes the test results and the formation process of the plastic hinges, and Fig. 7 depicts the detailed location of the frame plastic hinge. The first plastic hinge was initially formed at the east beam end of the first floor when the frame’s lateral displacement reached 35 mm. After the specimen reached the peak load point, the plastic hinges on the beams of the first and second floors successively developed when the frame lateral displacement increased to 63 mm. This finding indicated that the failure of the model frame belonged to the beam-hinge failure mechanism.
Fig. 7Location and sequence of plastic hinge
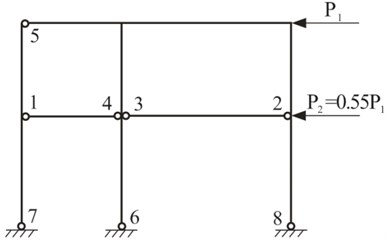
Table 4Formation process of plastic hinge
Lateral displacement on the top of the column Δ (mm) | Base shear force P (kN) | Location of plastic hinge | ||
Push | Pull | Push | Pull | |
35 | –35 | 133.5 | –132.1 | 1 |
49 | –49 | 142.2 | –141.3 | Peak load point |
63 | –63 | 139.3 | –139.0 | 2, 3, 4, 5 |
77 | –77 | 122.8 | –115.5 | 6, 7, 8 |
However, although the design of the model frame followed the criterion of “strong-column weak-beam and strong-joint weak-member”, the formation of the plastic hinge on the bottom end of the first floor columns was inevitable when the frame lateral displacement reached 77 mm. In addition, due to the effect of the axial load, the developments of column plastic hinges were faster than that of beam plastic hinges and finally resulted in the crushing of concrete at the bottom end of the frame columns, as shown in Fig. 6(f).
3.3. Hysteretic behavior
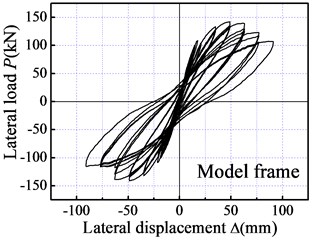
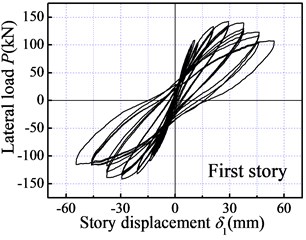
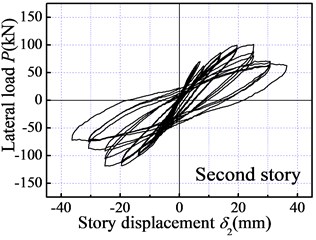
Fig. 8 illustrates the hysteretic curves of each story and overall frame. The following can be concluded from the figures:
1) The fatter hysteretic loop observed from the LWAC frame indicates high energy dissipation and verifies the rationality of “strong column and weak beam” (SCWB) design criteria.
2) At a roof displacement of 21 mm, the load-carrying capacity of the specimen is approximately linear with displacement. The LWAC frame exhibits elastic behavior accompanied by reduced residual deformation after unloading. With the increasing of roof displacement and cycle number, the cracks occurred extensively and developed at the column and beam ends. The hysteretic loops gradually approached the horizontal axis accompanied by an increase in the residual deformation, which indicated an evident stiffness degradation of the model frame, as seen in Fig. 8.
3) For the three loading cycles under the same roof drift, the maximum load of the first loading cycle was obviously higher than the value of the other two cycles, which presents a slightly strengthened degradation feature. After the roof drift exceeded 2 %, the load-carrying capacity of LWAC frame slightly decreased with an increase in the roof displacement and cycle number, showing favorable displacement ductility.
Fig. 8Hysteretic curves of test specimen
a)
b)
c)
3.4. Skeleton curve
Table 5 shows the test results and displacement ductility of the model frame. Four feature points (marked as A to D in Fig. 9) were chosen from the skeleton curves under both pushing and pulling actions to investigate the load-carrying capacity and deformation capability of the LWAC frame. Point A represented the crack load point (Pcr) when the first crack appeared on the concrete surface. Point B represented the yield load point (Py) determined by the yield moment method [9]. Point C corresponds to the peak load point (Pmax) and point D was located at the ultimate load point (Pu) corresponding to 85 % of the peak load value. In addition, Δcr, Δy, Δm and Δu are the corresponding roof displacements when the base shears achieved Pcr,Py,Pmax and Pu, respectively. The following conclusions can be drawn from Table 5 and Fig. 9. The mean value was adopted to process the following analysis by averaging the absolute values extracted from both pushing and pulling actions.
Note: δ1 and δ2 are the story displacements of the first and second floor, respectively; μΔ is the ratio of Δ/h; μδ1 is the ratio of δ1/h; μδ2 is the ratio of δ2/h.
Table 5Test results and displacement ductility
Feature point | P (kN) | Model frame | First floor | Second floor | |||||||
Δ (mm) | Δ/h (%) | μΔ | δ1 (mm) | δ1/h (%) | μδ1 | δ2 (mm) | δ2/h (%) | μδ2 | |||
Cracking point | Push | 38.7 | 4.40 | 0.16 | 2.58 | 0.16 | 1.84 | 0.15 | |||
Pull | –38.7 | –4.90 | 0.17 | –3.08 | 0.20 | –1.83 | 0.15 | ||||
Yielding point | Push | 114.0 | 21.52 | 0.76 | 1 | 12.90 | 0.82 | 1 | 8.62 | 0.69 | 1 |
Pull | –111.6 | –23.42 | 0.83 | 1 | –14.10 | 0.90 | 1 | –9.32 | 0.75 | 1 | |
Peak load point | Push | 142.2 | 49.00 | 1.72 | 2.26 | 29.40 | 1.89 | 2.30 | 19.60 | 1.56 | 2.27 |
Pull | –141.3 | –49.00 | 1.72 | 2.07 | –29.40 | 1.89 | 2.09 | –19.63 | 1.56 | 2.09 | |
Ultimate point | Push | 122.8 | 77.00 | 2.78 | 3.64 | 46.20 | 2.94 | 3.59 | 30.80 | 2.44 | 3.54 |
Pull | –115.5 | –77.00 | 2.78 | 3.33 | –46.20 | 2.94 | 3.26 | –30.80 | 2.44 | 3.27 | |
Fig. 9Skeleton curve of frame
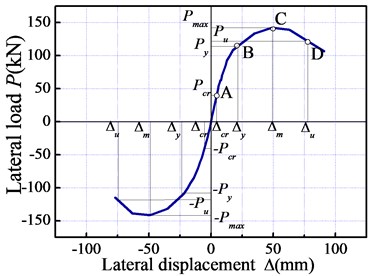
The ratio Py/Pcr of 2.92 indicates that the test LWAC frame had a large safety margin after the cracking phase, while the ratio Pmax/Py of 1.26 shows a poor residual load-carrying capacity of the tested LWAC frame after the yield load point. However, the large value of the roof displacement ratio Δy/Δcr implies significant safety assurance of the structure from the cracking phase to the yielding phase. The roof displacement ratio Δmax/Δy of 2.19 demonstrates outstanding deformation capability of the LWAC frame from the yielding phase to the peak load phase. The roof drifts of 0.17 % at the cracking phase and 2.69 % at the ultimate phase reveal that the test LWAC frame can meet the seismic performance expectations implied by the modern building code. Ultimately, the maximum roof displacement of 77 mm observed in the final loading cycle caused the cuting off of lightweight aggregates and the significant crushing of concrete at the column bases. Due to the large lateral displacement and the increasing number of loading cycles, a sudden strength drop was observed for the model frame. Nevertheless, the overall displacement ductility factor Δu/Δy of 3.49 for the LWAC frame is comparable to that of NWC frames.
3.5. Stiffness degradation
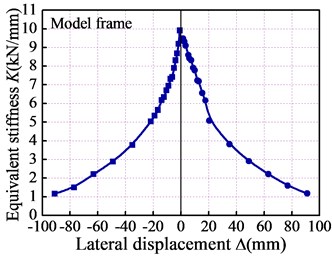
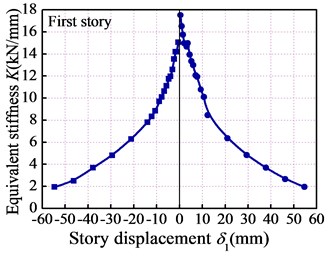
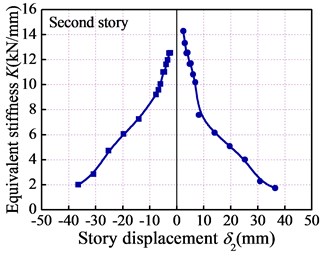
The equivalent stiffness coefficient K (K=P/Δ) was introduced to quantify the regularity of the stiffness degradation of the LWAC frame, as shown in Fig. 10. The following are several features for the stiffness degradation of each story and overall frame model: (1) the LWAC frame experienced evident stiffness degradation during the test. The stiffness of the overall frame at the yield load point was approximately 60 % of that at the crack load point, while the stiffness at the peak load point dropped 30 % after the yielding of the overall frame. This indicates that the stiffness degradation of this LWAC frame mainly occurred and developed before the yielding phase. (2) After the yield load point, the stiffness degradation rate of the LWAC frame gradually slowed, due in large part to the fact that the major cracks were generally formed and extended before the yield load point and without the formation of new cracks after that point. (3) The cracking stiffness under the pushing action was slightly larger than that under the pulling action. This can be explained by the fact that the initial push loading resulted in a certain unrecoverable damage to the LWAC frame, which has a negative effect on the frame stiffness under the pulling action.
Fig. 10Stiffness degradation curves
a)
b)
c)
3.6. Energy dissipation capacity
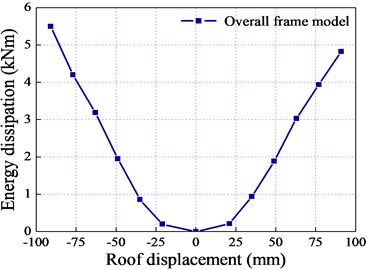
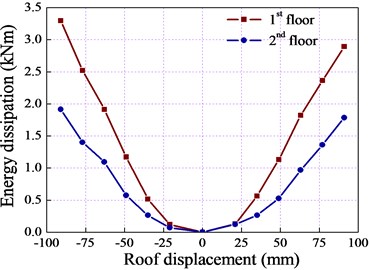
Energy dissipation at each cycle is calculated from the enclosed area within the load-displacement loop at this cycle. In addition, the energy dissipation coefficient E was introduced to objectively reflect the real energy dissipation capacity of the LWAC frame and defined as the ratio of the total energy to elastic energy at one hysteresis loop (Fig. 11). The mean value was adopted to calculate the dissipated energy by averaging the areas of three cycles under the same roof drift ratio. Table 6 lists the calculation results and Fig. 12 shows the energy dissipation of the 1st, 2nd floor and overall frame model against roof displacement:
Fig. 11Definition of energy dissipation coefficient
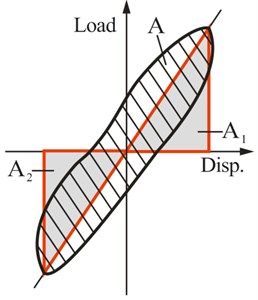
Table 6Energy consumption index of frame
Roof displacement Δ (mm) | Overall frame model | 1st floor | 2nd floor | |||
Energy dissipation (kN·m) | E | Energy dissipation (kN·m) | E1 | Energy dissipation (kN·m) | E2 | |
21.52 | 0.212 | 0.200 | 0.128 | 0.201 | 0.122 | 0.347 |
–23.42 | 0.200 | 0.120 | 0.070 | |||
35 | 0.940 | 0.388 | 0.564 | 0.387 | 0.263 | 0.402 |
-35 | 0.861 | 0.516 | 0.263 | |||
49 | 1.886 | 0.554 | 1.131 | 0.555 | 0.525 | 0.510 |
–49 | 1.953 | 1.171 | 0.574 | |||
63 | 3.029 | 0.722 | 1.818 | 0.731 | 0.967 | 0.767 |
–63 | 3.190 | 1.914 | 1.094 | |||
77 | 3.936 | 0.929 | 2.361 | 0.928 | 1.361 | 1.325 |
–77 | 4.201 | 2.520 | 1.400 | |||
91 | 4.819 | 1.016 | 2.891 | 1.046 | 1.785 | 1.571 |
–91 | 5.493 | 3.296 | 1.915 | |||
Note: E, E1 and E2 are the energy dissipation coefficient of overall frame model, first floor and second floor, respectively | ||||||
Fig. 12Energy dissipation for model frame
a)
b)
As shown in Table 6, the energy dissipated by the LWAC frame at the peak load point (Δ= 49 mm) was approximately 9.32 times greater than that at the yield load point (Δ= 21 mm), indicating that the structure dissipated less energy before the yielding phase. With an increase in the roof displacement and cycle number, the LWAC frame gradually exhibited elastic-plastic behavior. Although the load-carrying capacity of the LWAC frame grew slowly and even fell due to the continuous development of linear elements and joint damage, the energy dissipation capability of the specimen was considerably improved and presented a linear relationship with the roof displacement. In addition, the energy dissipation mechanism of each story was entirely consistent with that of the overall frame model, as shown in Fig. 12. The energy dissipation coefficient of the LWAC frame at the yield load point was 0.544, which is slightly lower than the value expected for a NWC frame, indicating that generally speaking, the LWAC frame possessed good energy dissipation capability.
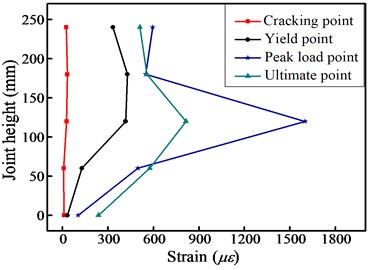
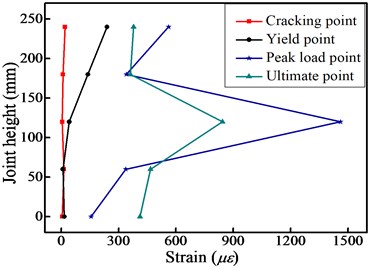
3.7. Strain distribution along interior joint height
Fig. 13 compares the strain distributions at each feature point along with the interior joint height for a selected joint (J1-2). As seen in the figure, the stirrup strains in the middle height of the interior joint core were larger than at other locations. This can be explained by the fact that the width of the diagonal crack ends was restrained against further widening under the action of two opposite direction bending moments. Thus, the cracks in the middle height region of the joint core were wider than the cracks at other regions. In addition, not all joint stirrups yielded at the failure load point, verifying that this LWAC frame meets the requirement of “strong-joint and weak-member” design criteria.
Fig. 13Stirrup strain history along the interior joint height
a) Pushing action
b) Pulling action
4. Conclusions
This paper focused on determining the seismic behavior of LWAC frames by subjecting a one-fifth scale two-story, two-bay test specimen to quasi-static cyclical loading that gave an indication of its ductility in a seismic event. The loading process, failure modes, plastic hinge mechanism, load-deformation response, skeleton curves, stiffness degradation and energy dissipation capability were fully discussed, and the following conclusions can be drawn:
1) LWAC frame experienced four phases, including cracking, yielding, peak load and ultimate during the test, and the final failure mode of the LWAC frame is characterized by the crushing of concrete and the buckling of longitudinal bars near the column base. The predominant failure mechanisms consist of beam hinge mechanism and column hinge mechanism. During the test, each beam-column joint maintained elastic deflection behavior, verifying that this LWAC frame meets the requirement of “strong-column and weak-beam, strong-joint and weak-member” design criteria.
2) The one-fifth scale LWAC frame test described herein fully validates the reliability of this innovative system. The fatter hysteretic loop and the displacement ductility factor Δu/Δy of 3.49 observed from the LWAC frame indicate excellent energy dissipation and reliable displacement ductility capability, which are comparable to that of NWC frames. Overall, the roof drifts of 0.17 % at the cracking phase and 2.69 % at the ultimate phase demonstrate that the LWAC frame can perform very well at meeting and exceeding the seismic performance expectations implied by modern building codes. The next research will be focused on the 3D and multi-story LWAC frame as well as the LWAC buildings installed with various dampers to further investigate the seismic behavior of this innovative system.
References
-
Bogas J. A., Gomes A. Compressive behavior and failure modes of structural lightweight aggregate concrete-Characterization and strength prediction. Materials and Design, Vol. 46, Issue 4, 2013, p. 832-841.
-
Kayali O. Fly ash lightweight aggregates in high performance concrete. Construction and Building Materials, Vol. 22, Issue 12, 2008, p. 2393-2399.
-
Gesoğlu M., Özturan T., Güneyisi E. Shrinkage cracking of lightweight concrete made with cold-bonded fly ash aggregates. Cement and Concrete Research, Vol. 34, Issue 7, 2004, p. 1121-1130.
-
Gao Y., Zou C. Experimental study on segregation resistance of nanoSiO2 fly ash lightweight aggregate concrete. Construction and Building Materials, Vol. 93, Issue 9, 2015, p. 64-69.
-
Kowalsky M. J., Priestly M. J. N., Seible F. Shear and flexural behavior of lightweight concrete bridge columns in seismic regions. ACI Structural Journal, Vol. 96, Issue 1, 1999, p. 136-148.
-
Rabbat B. G., Daniel J. I., Weinmann T. L., et al. Seismic behavior of lightweight and normal weight concrete columns. ACI Journal Proceedings, Vol. 83, Issue 1, 1986, p. 69-79.
-
Hendrix S. E., Kowalsky M. J. Seismic shear behavior of lightweight aggregate concrete square columns. ACI Structural Journal, Vol. 107, Issue 6, 2010, p. 680-688.
-
Decker C. L., Issa M. A., Meyer K. F. Seismic investigation of interior reinforced concrete sand-lightweight concrete beam-column joints. ACI Structural Journal, Vol. 112, Issue 3, 2015, p. 287-279.
-
Zhu B. L. Seismic Test of Building Structures. Earthquake Press, Beijing, 2003.
About this article
This work was supported by the Research Fund for the National Natural Science Foundation of China (No. 51578072), the Science and Technology Foundation for Innovation Project of Shaanxi Province (No. 2015KTZDSF03-04), the Natural Science Foundation of Shaanxi Province (No. 2016JM5070), and the Foundation of Chang’an University (No. 310828163410, No. 310828161006, No. 310828175020).

