Abstract
Shear lag effect of continuous curved box girder with three spans under seismic excitation is studied in this paper. Firstly, spatial shell finite element model is founded by ANSYS, and EL-centro seismic wave is chosen as seismic excitation. Secondly, the shear lag effect at different cross sections are investigated with dynamic time-history analysis, the results show that under seismic excitation there is prominent shear lag effect in continuous curved box girder, the maximum shear lag coefficient is 3.02, shear lag effect is severe, shear lag effect at mid-span cross sections are prominent than support cross sections, and inside peak shear lag coefficients are generally greater than outside. Finally, the numeric results are compared with the experimental results from a vibration table testing, which shows great consistencies.
1. Introduction
Thin-walled curved box girders are widely used in urban overpass, viaduct and long-span bridge structures for their own advantages. For thin-walled box girder, bending normal stress is non-uniform distributed along flange width direction because of its shear deformation, this phenomena, known as shear lag effect [1], it is an important factor that influence safety and durability of bridge structures. It was indicated by many researchers that shear lag will not only cause local stress concentration and cracks [2, 3] but also impairs the bending stiffness of the beam, which leads to the increasing of vertical deflection [4], the primary beam theory can’t meet the demands of engineering design. In recent years, many scholars have studied the shear lag effect of curved box girder under dynamic loads, Hugo C investigated vibration characteristics of a curved box girder bridges under vehicle loads by long-term field test [5], Wang bao Zhou deduced governed differential equations and corresponding boundary conditions of steel-concrete composite continuous box girder, and put forward a calculating method for its vibration characteristics [6], it can be seen that these researches are limit to study the influence of shear lag and shear deformation on free vibration characteristics, while there seems to be few researches on its dynamic response. In view of this, finite element method is used in present work, shear lag effect of a continuous curved box girder with three spans is studied by dynamic time history analysis.
2. Continuous curved box girder model
2.1. Calculating parameters
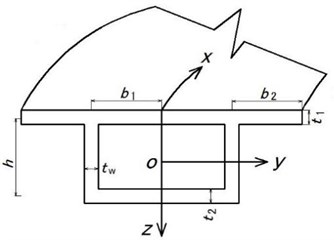
The material properties and structural dimensions of curved box girder are shown in the literature [7], Fig. 1 shows the cross-section type, mass density 1180 kg/m3, structural parameters: 8 mm, 100 mm, 100 mm, curvature radius 2 m, curvature angle 30°. The material parameters are as following: Young’s modulus 3000 MPa, Poisson’s ratio 0.385.
Fig. 1Cross section type
2.2. Finite element model
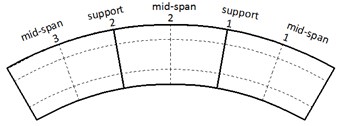
In this paper, 3D finite element method using 4-nodes shell elements is adopted in the foundation of the finite element model of the continuous curved box girder with three spans. The finite element model of curved box girder is shown as Fig. 2, there are 1152 elements and 1176 nodes, as for the boundary conditions, , , and , are restricted at the junction between web and bottom flange in one side, while , and are restricted in two middle sides and the other side, Fig. 3 shows plate form of continuous curved box girder.
Fig. 2Finite element model

Fig. 3Plate form of continuous curved box girder
2.3. Seismic excitation
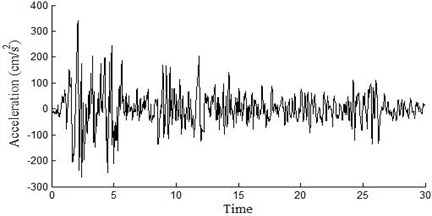
EL-centro Seismic wave (north-south component), recorded in second site, is chosen as seismic excitation in this paper, the peak value and acceleration are revised by basic earthquake protection intensity shown as Eq. (1), Fig. 4 shows the EL-centro seismic wave:
where is the acceleration of original seismic wave at time , is the corresponding peak value, is the revised acceleration, and is the maximum ground horizontal acceleration.
Considering the main reasons of shear lag are vertical bending deformation and plane shear deformation, the peak acceleration in different directions are set up as 1 (longitudinal direction) and 0.65 (vertical direction).
Fig. 4EL-centro seismic wave
3. Shear lag effect analysis
The shear lag coefficient is shown as Eq. (4) [1]:
where is the real stress value, is the stress calculated by primary beam theory.
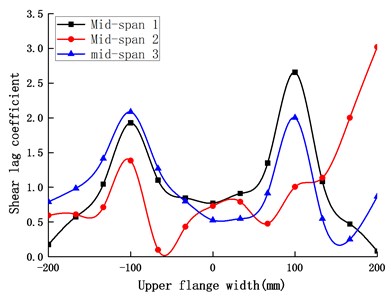
Fig. 5 shows the shear lag coefficient at the mid-span cross sections, on upper flange, it present prominent shear lag effect at the mid-span 1 cross section and mid-span 3 cross section, the shear lag coefficients reach their peak at the ribs and decrease along two sides, the maximum is 2.656, shear lag is severe and cannot be neglected; while for mid-span 2 cross section, the shear lag coefficients are generally less than 1, it presents negative shear lag effect. On bottom flange, shear lag coefficients both increase from outside to inside at the mid-span 1 cross section and mid-span 2 cross section, the maximum are respectively 1.528 and 1.537.
Shear lag coefficient at the support cross sections are shown as Fig. 6, just like mid-span 1 cross section and mid-span 3 cross section, there is also prominent shear lag effect on upper flange, the inside peak shear lag coefficient is great than outside, which means the outside upper flange is easier to be damaged under seismic action. For bottom flange, there is no certain rule.
Fig. 5Shear lag coefficient at the mid-spans
a) Upper flange
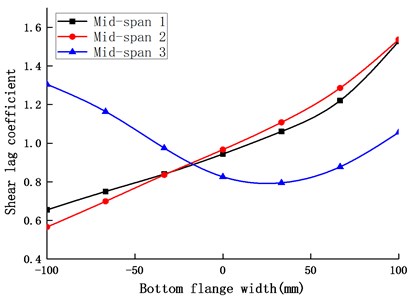
b) Bottom flange
Fig. 6Shear lag coefficient at the supports
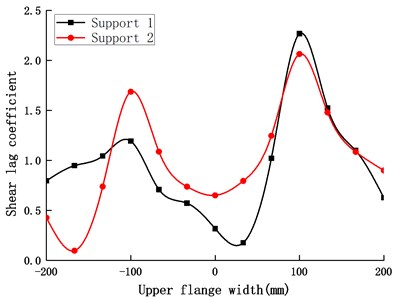
a) Upper flange
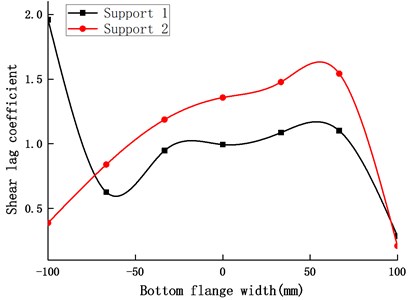
b) Bottom flange
Shear lag effect reflects the non-uniform of stress distribution, in order to compare degree of stress concentration between mid-span cross sections and support cross sections, the peak shear lag effect coefficients of upper flange are analyzed, the result is shown as Table 1.
From the Table 1, it can be seen that for continuous curved box girder, shear lag effects at the mid-span cross sections are prominrnt than support cross sections, so full attentions should be paid in engineering design.
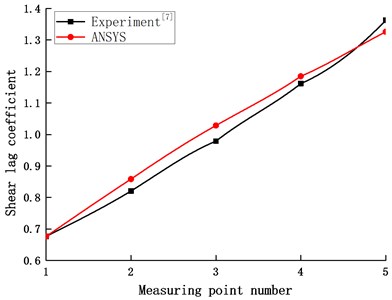
In order to verify the correctness and reliability of finite element model, the continuous curved box girder is changed to cantilever curved box girder so as to compare the results acquired with the shaking table testing [7], the shear lag coefficients at mid-span is shown as Fig. 7, the numerical analysis of ANSYS agrees well with that of experiment shown as Fig. 7.
Table 1Peak shear lag coefficients of upper flange at different cross section
Cross section | Peak value | |
Outside | Inside | |
Mid-span 1 | 1.928 | 2.656 |
Mid-span 2 | 1.385 | 3.020 |
Mid-span3 | 2.085 | 2.002 |
Support 1 | 1.193 | 2.267 |
Support 2 | 1.687 | 2.064 |
Fig. 7Comparison of experiment and numeric results
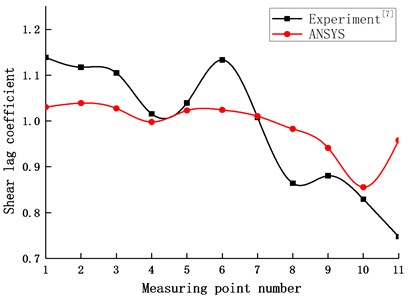
a) Upper flange
b) Bottom flange
4. Conclusions
The following conclusions are acquired:
1) There is a prominent shear lag effect in the single-box single-cell continuous curved box girder under seismic excitation, this stress concentration phenomenon cannot be neglected.
2) Shear lag effect at mid-span cross sections are more prominent than support cross section.
3) Inside peak shear lag coefficients are greater than outside, which means for continuous curved box girder, inside is easier to be damaged than outside under seismic excitation.
4) The analysis results in this paper agree well with experiment, which can verify the validity of finite element model.
References
-
Xiang Haifan, Fan Lichu Advanced Theory of Bridge Structures. Second Edition, China Communication Press, Beijing, 2008, (in Chinese).
-
Sun Lu, Wang Wenlei, Wu Guoqi, Li Yaoxiong Analyses of the causes for crack on the end side of box girder for railway passenger dedicated line and its construction control. Journal of Railway Engineering Society, Vol. 10, 2007, p. 46-51, (in Chinese).
-
Qiao Peng, Zhou Xuhong, Di Jin Shear lag effect analysis of flat steel curved box girder. Journal of Traffic and Transportation Engineering, Vol. 14, Issue 4, 2014, p. 36-44, (in Chinese).
-
Zhang Yuanhai, Li Lin, Lin Lixia, Sun Xuexian Beam-segment finite element analysis on shear lag effect of thin-walled box girder adopting additional deflection as generalized displacement. China Civil Engineering Journal, Vol. 46, Issue 10, 2013, p. 100-107, (in Chinese).
-
Gomeza Hugo C., Fanning Paul J., Fenga Maria Q., Lee Sungchil Testing and long-term monitoring of a curved concrete box girder bridge. Engineering Structures, Vol. 33, Issue 10, 2011, p. 2861-2869.
-
Wang Bao Zhou, Li Zhong Jiang, Zhi Wu Yu Analysis of free vibration characteristic of steel-concrete composite box-girder considering shear lag and slip. Journal of Central South University, Vol. 20, Issue 9, 2013, p. 2570-2577.
-
Lu H. L., Peng T. F., Huang M. S., Zhu S. B. Experimental study on shear lag of curved box girder under earthquake excitation. Vibroengineering Procedia, Vol. 5, 2015, p. 417-422.
About this article
The present work is supported by the National Science Fund of China (No. 51378404) and Innovation Fund of Wuhan Institute of Technology (CX2016036), these supports are sincerely acknowledged.
