Abstract
Paper describes a simulation of an elastic wave in homogenous isotropic waveguide with generic cross-section using semi-analytical finite element (SAFE) formulation. The wave is considered a travelling displacement field in the waveguide as a result to forcing excitation and is expressed via modes’ superposition. The solutions for modes are obtained solving SAFE governing eigen problem. Attenuation of the medium in SAFE framework differently from prior researchers is simulated via Rayleigh damping. It is shown, that severe damping is not properly supported by the SAFE formulation and revision for properly accepting linear viscosity is needed.
1. Introduction
The guided elastic waves are widely used in non-destructive long-range inspection for the elongated structures (waveguides). Simulation of propagating waves in the rods of the carbon fiber reinforced plastics (CFRP) waveguide enabled to detect the delamination regions in the samples [1], to test the structural integrity of pipes and rails [2], to measure the density of fluids [3], etc.
For characterization of guided waves the dispersion curves are used, which display the relationships of wave velocities against frequencies. Simultaneously, each mode shape of the propagating wave has a characteristic distribution of oscillatory displacements over the cross-section of a waveguide. The dispersion curves also provide information about phase and group velocities of the waves at particular frequency. This information provides the basis for the design of angle- and comb-type transducers used for ultrasonic inspection [4].
The first theoretical approach to guided waves dates back to Pochhammer and Chree who were the first researchers, who obtained the solution in the form of dispersion curves of the rod waveguides [5, 6]. The dispersion curves of homogenous and isotropic plates can be analytically derived from Rayleigh – Lamb equation [7]. Laminated composite structures of complex geometry require numerical calculation techniques such as the finite element method (FEM). Many authors, among them Gavric [8], Hladky-Hennion [9], Damljanovic and Weaver [10], Zienkiewicz [11] have researched on FEM in application for the propagating waves in waveguides. An advantageous computational technique for investigating waves in the infinite-length waveguides is the semi analytical finite element method (SAFEM). SAFE computational costs are much lower when compared with the FEM implementation of the similar computational model. SAFE formulation involves two- dimensional discretization of the cross-section of the waveguide. Complex exponential functions ensure the harmonic propagating wave solutions along the waveguide. The SAFE approach was first used by Lagasse and Aalami [12, 13] and further developed by Viola et al. [14], Hayashi et al. [4] and Ahmad [15]. Along with obtaining the dispersion curves, the extensions of SAFE approach may simulate the forced response of the waveguide excited by the piezoelectric transducer at one end [2].
As a rule, in most investigations SAFE provided the dispersive solutions of waves in undamped waveguides of arbitrary cross-sections. The approach works for weekly linearly damped waves as well. The propagating waves in viscoelastic isotropic and orthotropic plates were extensively studied by Scalea [16]. Two different models of linear viscoelasticity, hysteretic and Kelvin-Voigt, were incorporated in SAFE in order to extract viscoelastic dispersion solutions. Time dependent response to force excitation in isotropic viscoelastic waveguide was presented by Marzani and Bartoli [17].
In this work, we analyzed the free and forced propagating wave response of the waveguide subjected to Rayleigh damping by employing SAFE method. The focus was to analyze the behavior of the solutions as the damping is increased, as well as, to verify the obtained solutions against the ones simulated by full 3D FEM model. The forced response was presented as the superposition of the modes obtained SAFEM.
2. Governing equation of simulation
The detailed mathematical framework of SAFE is presented by following Gavric and Viola [8, 14]. Consider a 3D waveguide, which is uniform and infinite in 0Z direction with stress-free surface. The vectors of displacements u, Voigt’s stresses σ and strains ε at each point of the cross-section are presented as:
The generalized Hook’s law is used for determining the 3D volumetric stress-strain relation as:
where D is the stiffness tensor.
The small strain against displacement relation reads as:
where:
In SAFE formulation the displacement field along the waveguide is assumed as harmonic propagating wave described analytically by complex exponential function ei(kz-ωt), where ω [rad/s], k [rad/m] are the angular frequency of the wave and the wavenumber correspondingly. The cross-section of the waveguide is discretized into 2D first-order Serendipity finite elements (FE).
Approximate the displacement field within the FE as:
=[∑4a=1Na(x,y)vxa∑4a=1Na(x,y)vya∑4a=1Na(x,y)vza]eˉUeei(kz-ωt)=N(x,y)ˉUeei(kz-ωt),
where ˉUe is the nodal displacements vector, containing displacements of each node in the directions of the three axes, N(x,y) is the matrix of approximation functions; a is the node number within the FE; vx, vy, vz are the nodal displacements of ath node in 0X, 0Y, 0Z directions correspondingly, and i stands for imaginary units.
By substituting Eq. (4) into Eq. (2), the strain-displacement relation reads as:
where:
Applying Hamilton’s virtual work principle for a single FE yields:
T denotes matrix conjugate transpose and δ stands for a virtual quantity. The terms in Eq. (7) can be expanded to:
The complex wavenumber k=Re(k)+Im(k)⋅i describes the spatial configuration of the wave propagating along the waveguide. Im(k) means the exponent of wave decay in space. In practical applications the attenuation is preferably measured in Np/m (Nepers per meter, 1Np = 8.6859 dB), that is, 1/Im(k) is a distance over which the amplitude of travelling wave decreases by 1/e. As Eq. (8) and (9) are complex quantities, the conjugate transposes of matrices are used, where the transposition converts the complex numbers to their conjugates, as:
=∫S∫zδ(ˉUTe(BT1-ik*BT2)e-Im(k)ze-i(Re(k)z-ωt))
×D(B1+ikB2)ˉUee-Im(k)ei(Re(k)z-ωt)dzdS=∫VeδεTeDεdVe
=∫S∫zδ(ˉUTe(BT1-ik*BT2)e-i(k*z-ωt))D(B1+ikB2)ˉUeei(kz-ωt)dzdS
=e-2Im(k)z-2Im(k)δˉUTe∫S[BT1DB1-ik*BT2DB1+ikBT1DB2+k*kBT2DB1]dSˉUe,
×ˉUee-Im(k)ei(Re(k)z-ωt)dzdSe=-e-2Im(k)z-2Im(k)ω2δˉUTe∫S(N(x,y))TρeN(x,y)dSˉUe,
where k* is the complex conjugate of k. By substituting Eq. (10) and (11) into Eq. (7) we obtain the finite element equation of the FE of the waveguide cross-section as:
The FE matrices read as:
K2e=∫x∫yBT2DB2dxdy,K3e=∫x∫yBT2DB2dxdy,
where ρe is the mass density, Me is the mass matrix, K1e is stiffness matrix related with planar deformations of the cross-section, K3e is symmetric stiffness matrix related with out-of-plane deformations, K2e is the skew symmetric stiffness matrix, which couples planar and out-of-plane effects.
The integrals in Eq. (12) are computed by using the Gaussian quadrature rule. Since term e-2Im(k)zδˉUe/-2Im(k) can be arbitrary (infinite length in OZ direction), thus SAFE eigenvalue equation for FE becomes:
As external excitation in terms of cross-section tractions is given, SAFE equation reads as:
where ˉFe is a nodal vector of external forces acting upon FE throughout all the length of the waveguide given as a propagating excitation wave.
As SAFE matrices and vectors are assembled to SAFE structural matrix and vector, the structural SAFE equation is obtained as:
where ˉU is global vector of unknown nodal displacements over the cross-section.
In case ˉF=0 the homogeneous version of Eq. (15) is obtained as
which is treated as eigenproblem with ω or k treated as the unknowns.
3. Dispersion solutions for eigenvalue problem
3.1. Dispersion curves
The solution of complex eigenvalue problem (Eq. (15a)) at numerous ω values within the selected range provides a number of propagating wave modes. The modes are presented in terms of k, U pairs of the wavenumber and oscillatory displacements shape over the cross section. The number of obtained modes at each ω value depends on the refinement of the FE mesh over the cross-section of the waveguide. Each modal displacement shape defines the type of the wave. The relationship of the wavenumbers of the same type of the wave against the frequency values is referred to as dispersion relationship (dispersion curve) of the particular type of the wave. Dispersion relationships of real waveguides are all non-linear.
Wavenumbers k may be real, complex or pure imaginary values. Real values k represent propagating waves. In such case k*=k, therefore Eq. (15a) can be simplified as:
Complex wavenumbers k represent damped waves. Complex wavenumbers are obtained from Eq. (16), however, they are mathematically correct only in case Re(k)≫Im(k) , until relation k*≈k may be assumed as approximately valid. In a general case the matrix expression in Eq. (16) has to be adjusted by taking into account real and imaginary parts of k*, thus generating a non-linear eigenvalue problem.
Pure imaginary k values (k*=-k), or Re(k)≪Im(k), represent end-mode solutions as “non-propagating waves”. In such case Eq. (16) reads as:
In this paper we are using eigenvalue problem formulation Eq. (17) for obtaining solutions, which are able to approximately the weakly-evanescent guided waves.
Equation Eq. (15a) is a quadratic eigenvalue problem with respect to k. It may be transformed into the first order problem as:
where:
The homogeneous version of equation Eq. (19) reads as:
where for each given real ω value 2×Total Degrees of freedom = 2N eigenvalues k may be obtained.
Simultaneously, we formulate the left eigenvalue problem as:
though vector W1×2N has no immediate physical meaning.
Further we use notations for first halves of vectors V, W as vN×1 and wN×1, where Vj=[vjkvj] and Wj=[wjkjwj].
The eigen-wavenumber (EWN) values are obtained from Eq. (16) in pairs. Solutions with positive and negative Re(k) parts represent propagating wave modes in forward and backward 0Z directions correspondingly. Complex solutions ±(Re(k)+Im(k)⋅i) represent evanescent waves with the amplitude decaying along 0Z. The solutions ±(Re(k)-Im(k)⋅i) have no physical meaning [14]. Pairs of pure imaginary solutions with positive and negative Im(k) values represent non-propagating end-modes. The immediate practical value has the propagating and evanescent wave solutions.
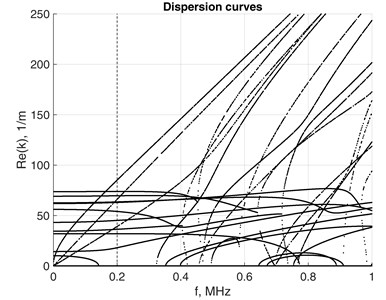
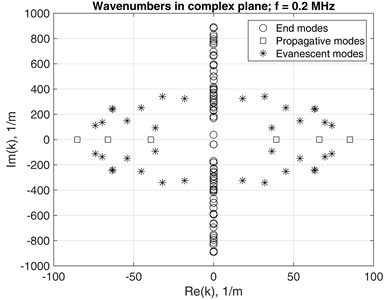
For model verification purposes, dispersions curves of a steel waveguide with rectangular cross-section 0.00508×0.00508 m were calculated. The material properties were: mass density ρ= 7850 kg/m3, Young’s modulus E= 2·1011 Pa and Poisson’s ratio ν= 0.3. The FE mesh was 4×4 over the cross-section of the waveguide. Fig. 1(a) show k(f) solutions presented as dispersion curves for forward direction travelling waves, where f=ω/(2π) is frequency in cycles per second. The results agreed reasonably well with those published by Hayashi and were backed up by experimental data in [4]. Fig. 1(b) shows the classified EWN for forward and backward travelling waves at f= 0.2 MHz in the complex plane, where symmetry in-between wavenumbers are evident. Four forward -propagating modes were obtained as two identical pairs because of the square shape of the waveguide.
Fig. 1a) k(f) solutions with 0.2 MHz dotted line mark; b) Eigen wavenumbers in complex number plane at f= 0.2 MHz
a)
b)
For representation purposes the set numerous obtained EWN was classified in order to distinguish the propagating, evanescent and end-mode waves form each other. As the EWN are always calculated with certain numerical error, the symmetry of the values over the complex plane implies that arithmetic averages of real and imaginary parts should be calculated. Several similarity measures are used in order to determine the type of symmetry of the obtained EWN.
3.2. Phase and group velocities
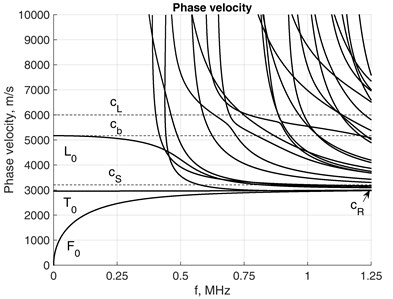
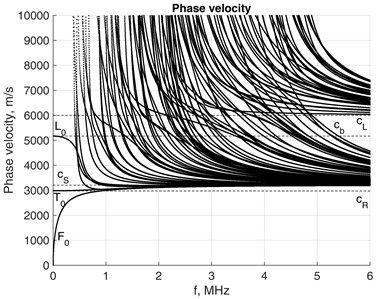
Along with the dispersion relations, phase velocity cph=ω/Re(k) is another way for expressing relations between the wavelength, which is the inverse of real part of k, and frequency. Fig. 2(a) and (b) show the phase velocities of propagative modes of the same waveguide presented by 10×10 and 6×6 FEs over the cross-section. Theoretical values of longitudinal cL, shear cS and bar cb=√E/ρ (speed of sound for pressure wave) velocities are presented by dashed lines. Phase velocities of fundamental flexural F0 and longitudinal L0 modes approach Rayleigh wave velocity cR≈0.862+1.14ν1+νcS as the frequency increases. Velocity cb coincides with the velocity of L0 mode at zero frequency. Phase velocities of higher order modes velocities approach cL at higher frequencies, Fig. 2(b). Phase velocity of the fundamental torsional mode T0, which in case of plates and cylindrical bars coincides with cS and is nondispersive, reaches value of ctorsional≈0.92cS [4]. However, over higher frequency range it does not approach the horizontal line of cS any more, thus implying low dispersion, Fig. 2(b). The phase velocities of L0, F0 tend towards cS due to their numerical errors.
Fig. 2Phase velocity of square bar with mesh of a) 10×10 and b) 6×6 on cross-section
a)
b)
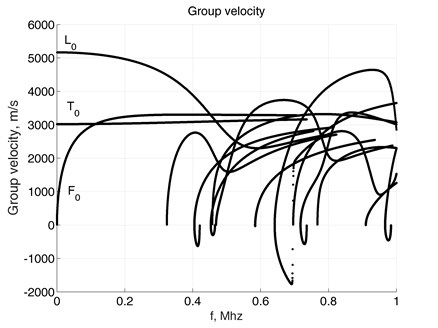
The group velocity represents the velocity at which the mechanical energy travels in lossless waveguide and is defined as cgr=∂ω/∂k. Tracking separate mode over frequency axis might be a challenging task, since many modes with close wavenumbers exist, it is evident in Fig. 1(a). Therefore, usage of direct numerical differentiation ω+Δω/k+Δk might produce misleading results by losing observed mode.
For given ω the group velocity of jth mode could be derived from homogenous equation Eq. (15a) by taking the derivative with respect to wavenumber as:
Pre-multiplying Eq. (19) by the left eigenvector w gives:
Eventually:
Fig. 3 shows the results obtained by applying Eq. (21) for the waveguide with 4×4 FEs mesh. It may be observed that that modes with negative group velocities exist, which indicate that the mechanical energy of travels in direction opposite to that of phase velocity at particular frequency ranges. Unlike in plates and cylindrical bars, the group velocity of T0 mode also has low dispersion.
Fig. 3Group velocity
4. Handling force response
The jth mode kj and Vj satisfies the equation:
where the right eigenvector Vj has the clear physical interpretation as the displacement profile of the propagating wave over the cross-section of the waveguide.
The eigensolution km and Wm is obtained as a solution of the left eigenproblem as:
Pre-multiplying of Eq. (22) by Wm and post-multiplying Eq. (23) by Vj yields following relations:
This expands to:
Which is equivalent to left and right eigenvector orthogonality relations:
Any vector of length l can be casted in basis of l independent vectors. In case of external loading presented in Eq. (18) as P, the response is presented as the weighted superposition of eigenvectors:
And Eq. (18) can now be presented as:
Pre-multiplying of Eq. (28) by left eigenvector Wm yields:
Because of orthogonality of the eigenvectors, the scalar weight of mth eigenvector reads as:
And finally, the nodal displacement vector is:
The force is considered to be applied at particular point z0 on the 0Z axis over the cross-section of the waveguide as nodal amplitudes vector ˉF. Weight of the mth mode contribution to overall solution can now reads as:
Substitution of Eq. (32) to Eq. (31) yields:
Since U(z) is a Fourier transform with respect to wavenumber k, the application of Cauchy residue theorem ([18]) leads to:
Displacements expressed by relation Eq. (34) at points z>z0 are expressed via superposition of N modes propagating forwards. At points z<z0 in relation Eq. (34) the backwards propagating modes are engaged. Relation Eq. (34) can also be considered as a response to general excitation, while both types of modes (propagating and evanescent) are engaged. Finally, displacement vector, as response to a harmonic load with a particular angular frequency ω, is obtained as:
It is worth noting that calculation of left eigenvectors for lossless waveguides is not necessary. They can be substituted by the right ones as both A and B are Hermitian matrices (AT=A and BT=B) because of the symmetry of matrices K1, K3, M and skew-symmetry of matrix K2. Under such conditions Eq. (23) may be re-casted as:
For propagating modes corresponding to real valued EWN left eigenvectors can be obtained as W=VT, sincek*=k. In case of complex EWN Re(k)+Im(k)⋅i and 0+Im(k)⋅i the left eigenvectors are conjugate transposes of the right ones as Re(k)-Im(k)⋅i and 0-Im(k)⋅i respectively. Graphical point of feasibility for mentioned substitutions is clearly depicted in Fig. 1(b). In the presence of damping the technique for overcoming the necessity of left eigenvector calculation has been proposed by Gavric [8] and Hladky – Hennion [9] and by Viola [14]. They demonstrated that in SAFE formulations the left eigenvectors can be always obtained from the right ones as:
In case of the general time law, the excitation can be presented as a superposition of numerous Fourier components. In such case the response to each single harmonic component is obtained as described in this section. The overall response equals the sum of time relationships corresponding to all single-frequency responses.
5. Experimental exploration
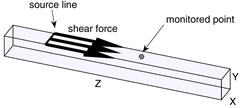
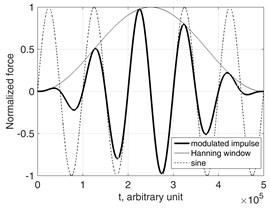
Consider aluminum waveguide of mass density ρ= 2700 kg/m3, Young’s modulus E=7·109 Pa and Poisson’s ratioν= 0.33. The cross-section of the waveguide was 0.001×0.0011 m, which slightly different from a square in order to avoid multiple EWN was considered in simulation. Consider the external loading as shearing force applied along a source (Fig. 4(a)). The time law is given as Hanning-windowed 5 cycle sinus burst centered at 250 kHz (Fig. 4(b)).
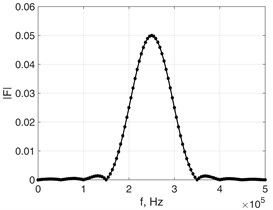
Fig. 4(c) displays the frequency spectrum of the modulated loading impulse. It is obtained by applying the fast Fourier transform (FFT) to the time relationship shown in Fig. 4(b), which is followed by zero padding 50 times the duration of impulse. The threshold for the meaningful harmonic components is assumed as 0.05 %. FFT sampling frequency was 250 GHz. The sum of displacement vectors of all harmonic components of the response in accordance with relation Eq. (35) provides the overall response to the loading impulse.
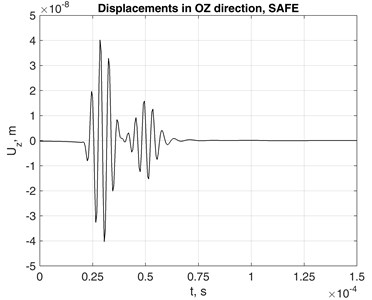
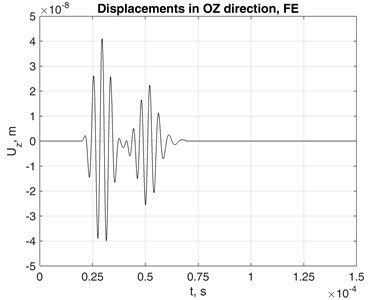
Fig. 5(a) presents the resulting displacements in OZ direction registered at the monitored point at 0.1 m from the source line. Certain wrap-around effects may be observed, such as the displacements in OZ direction at the time moment just before the arrival of the impulse. Most probably they appear because of the artificial periodicity of the impulse due to finite duration of the time relationship processed by FFT. Similar discrepancies are visible near to the incoming slope of the impulse in OZ direction, Fig. 6. Such effects can be reduced by increasing the FFT sampling frequency and the length of zero padding.
Fig. 4a) Schematic representation of excitation; b) excitation’s modulation; c) excitation’s frequency spectrum
a)
b)
c)
Fig. 5Displacements of monitored point (z= 0.1 m distance from source in the waveguide) in 0Zdirection obtained using a) SAFEM and b) FEM
a)
b)
Fig. 6Nodal response in OZ direction to a) general and b) propagative modes excitations at distances of 0.0001 m 0.0002 m and 0.0004 m from the source in OZ axis

a) General excitation in lossless waveguide

b) Propagative modes excitation in lossless waveguide
Results of explicit simulation by means of the 3D FE model subjected to the same excitation scenario are shown in Fig. 5(b). The 3D mesh density was 4×4×100 elements up to the monitored point in OX, OY and OZ directions. Reasonable agreement of the results provided by both models was demonstrated.
Fig. 6 shows nodal responses obtained by using all modes contributions (Fig. 6(a)) and propagative-only modes’ contributions (Fig. 6(b)) to the response at points near to the source line. The results imply that evanescent and end-modes’ contribution to response decays rapidly and could be neglected in the far-field response analysis. Similar findings were reported by Weaver and Damljanovic [10].
6. Rayleigh damping
The Rayleigh damping is one of the models of internal losses appearing during the wave propagation. It enables to analyze the effects of viscosity of the waveguide material. As the practical value of the analysis, the characterization of the material properties on the basis of wave propagation features, should be mentioned.
In case of Rayleigh damping the structural dynamic equation is supplemented by the damping term as:
where C=αM+βK is the damping matrix presented as weighted sum of mass and stiffness matrices. In SAFE formulation, the damping term appears as:
=ˉFei(kz-ωt),
where:
In this way complex mass and stiffness matrices are introduced similarly to Kelvin-Voigt attenuation model, which involves the frequency-dependent complex stiffness matrix. In practice, the Rayleigh damping coefficients for a particular structure are determined experimentally [19]. By the computational experiments presented here we investigate how the dispersion curves of different wave modes depend on values α and β . The results are presented in Fig. 7, where the cross-section mesh of the waveguide was 4×4. In the damped case all the EWN are complex, so the obtained modes are all evanescent. The phase velocities are obtained by using the real parts of EWN as cph=ω/Re(k).
The presence of damping severely modifies the appearance of phase velocities relationships. Due to non-zero α and β the branches of fundamental modes tend to bend-away from the Rayleigh’s wave’s velocities relationship Fig. 7(a). Simultaneously, the attenuation of higher modes is less affected as the frequency increases, Fig. 7(b).
Fig. 8 shows how the phase velocities of fundamental modes are affected by severe damping. The scenario of heaviest simulated damping clearly demonstrates the behavior, which may be hardly explicable. This may serve as indication that assumptions on which Eq. (17) was based probably lack a solid background, though they were used by many researchers before for analysis of slightly damped structures. Thus implies the need for further research in order to revise the solutions of Eq. (15a) by fully considering the non-linear eigenvalue problem.
Fig. 7α and β values impact to phase velocity a) and attenuation b) of waveguide with 4×4 mesh on the cross-section.

a)

b)
Fig. 8Damping impact to phase velocity of fundamental modes in the waveguide with 4×4 mesh on the cross-section
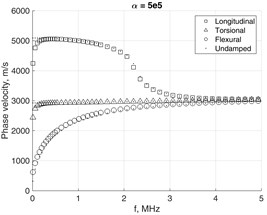
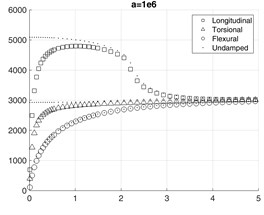
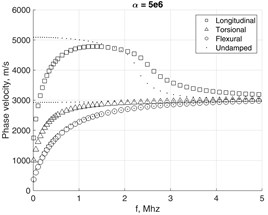
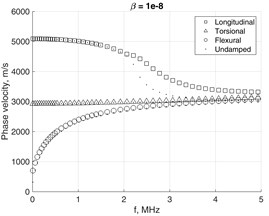
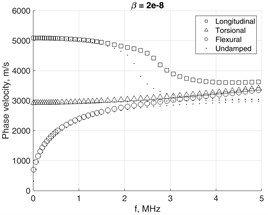
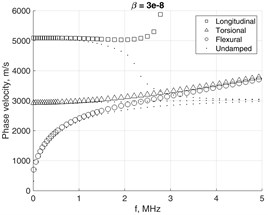
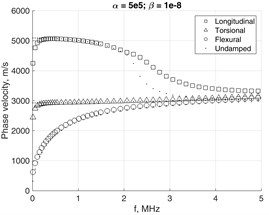
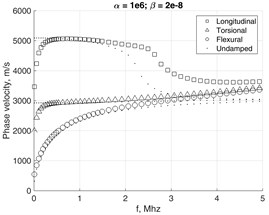
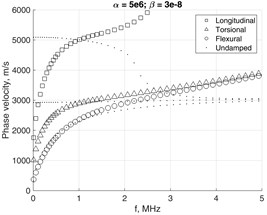
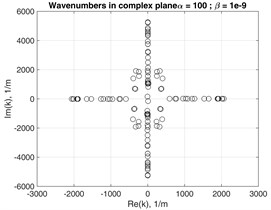
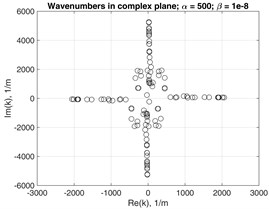
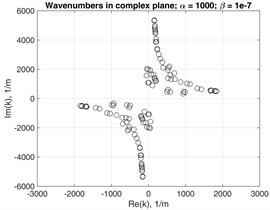
Fig. 9 shows the appearance of EWN values on the complex plane in case of different severity of Rayleigh damping at selected frequency f= 1 MHz. As damping increases, the EWN do not retain symmetries with respect to OX and OY axes any more.
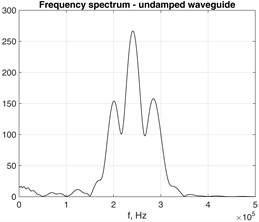
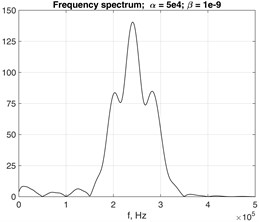
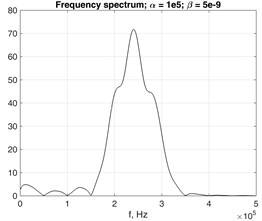
Fig. 10 presents the response frequency spectra at the monitored point in case of damped and undamped waveguides with 4×4 FE cross-section. As the damping increases, the number of dominant modes directly influencing the displacement field at the observed point decreases.
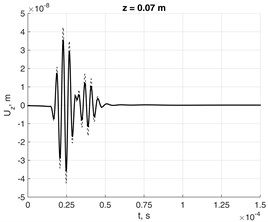
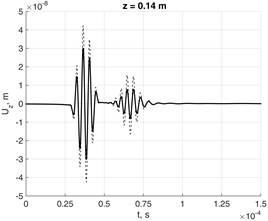
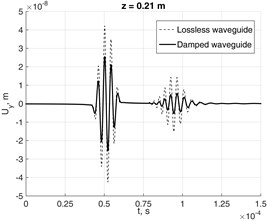
Fig. 11 demonstrates the dispersion effect, which is caused by different phase velocities of the modes excited by the loading in lossless and damped (α= 500 and β= 10-8) aluminum waveguide.
Fig. 9Wavenumbers in complex plane at f=1 MHz with damping coefficients: a) α= 100 and β= 10-9; b) α= 500 and β= 10-8; c) α= 1000 and β= 10-7
a)
b)
c)
Fig. 10Frequency spectrums of the time transient response in 0Z direction of the observed point at the distance of z= 0.1 m from the forcing source in a) undamped and b) damped, c) waveguide
a)
b)
c)
Fig. 11Nodal response to force in lossless and damped waveguides at distances a) z= 0.07 m, b) z= 0.14 m and c) z=0.21 m in 0Z direction from source
a)
b)
c)
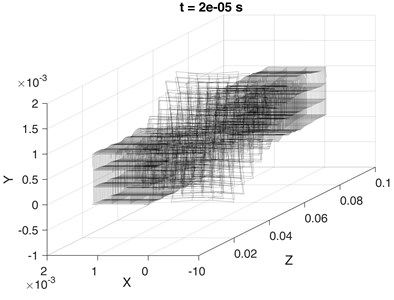
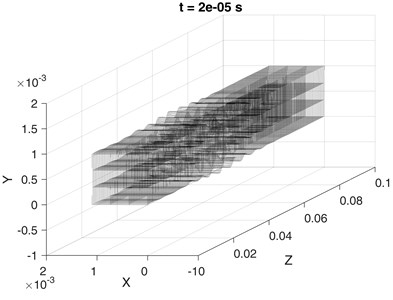
The 3D view of the waveguide structure deformed by the wave is presented in Fig. 12. The displacement field is shown at time t= 20 μs in case of lossless and damped (α= 500 and β= 10-7) aluminum waveguide. Separate layers over the cross-section have been drawn. High sampling frequency has been used in order to avoid aliasing in animation.
Fig. 123D animation representing excitation in a) lossless and b) damped (α= 500 and β= 10-7) aluminum waveguide with 3×3 mesh on cross-section at t= 20 μs
a)
b)
7. Conclusions
The analysis of propagating waves in waveguides by SAFE method enables to obtain the travelling-wave responses in infinite or almost-infinite waveguide structures. The approach enabled to obtain the wave modes, as well as, the forced responses of the waveguides to harmonic and general excitations at much lower cost than the direct FEM simulation of a waveguide as solid 3D structure. The new aspect of this work is that the waves have been analyzed at significant level of Rayleigh damping. The influences of damping on dispersion and phase-velocity curves have been investigated.
An important accent is that the linear eigenvalue problem as the model for wave modes investigation is only very approximate in case of severe damping. The presented SAFE framework includes assumptions that allow to simplify the governing equation, which are conventionally accepted by many researchers. However, we have found evidences, that the governing equation does not properly support severe to moderate damping. The reason is that even in case the physical and geometrical behaviors of the waveguide are linear, the eigenvalue problem equation has to be considered as dependent on the eigenvalue and therefore as non-linear one. The detailed analysis remains for future investigations in order to extend the SAFE framework in order to match the general linear damping model.
Moreover, an important application may find the SAFE models, which include the possibilities of simulating the impact of complex waveguide-surrounding media on the modal properties of the waveguide.
References
-
Kazys R., et al. Application of ultrasonic guided waves for NDE of composite structures. Proceedings of the National Seminar and Exhibition on Non-Destructive Evaluation, 2009, p. 236-239.
-
Loveday P. W., Long C. S. Time domain simulation of piezoelectric excitation of guided waves in rails using waveguide finite elements. The 14th International Symposium on: Smart Structures and Materials and Nondestructive Evaluation and Health Monitoring, International Society for Optics and Photonics, 2007. p. 65290V.
-
Fan Z., et al. Torsional waves propagation along a waveguide of arbitrary cross section immersed in a perfect fluid. The Journal of the Acoustical Society of America, Vol. 124, Issue 4, 2008, p. 2002-2010.
-
HayashiT., Song W. J., Rose J. L. Guided wave dispersion curves for a bar with an arbitrary cross-section, a rod and rail example. Ultrasonics, Vol. 41, Issue 3, 2003, p. 175-183.
-
Pochhammer Lt. Ueber die fortpflanzungsgeschwindigkeiten kleiner schwingungen in einem unbegrenzten isotropen kreiscylinder. Journal für die Reine und Angewandte Mathematik, Vol. 81, 1876, p. 324-336.
-
Chree C. The equations of an isotropic elastic solid in polar and cylindrical co-ordinates their solution and application. Transactions of the Cambridge Philosophical, Society, Vol. 1889, 14, p. 250-369.
-
Victorov I. A. Rayleigh and Lamb Waves. Plenum Press, New York, 1967.
-
Gavric L. Computation of propagative waves in free rail using a finite element technique. Journal of Sound and Vibration, Vol. 187, Issue 3, 1995, p. 531-543.
-
Hladky-HennionA. C. Finite element analysis of the propagation of acoustic waves in waveguides. Journal of Sound and Vibration, Vol. 194, Issue 2, 1996, p. 119-136.
-
Damljanovic V., Weaver R. L. Forced response of a cylindrical waveguide with simulation of the wavenumber extraction problem. The Journal of the Acoustical Society of America, Vol. 115, Issue 4, 2004, p. 1582-1591.
-
Zienkiewicz O. C., Taylor R. L. The Finite Element Method: Solid Mechanics. Butterworth-Heinemann, 2000.
-
Lagasse P. E. Higher‐order finite‐element analysis of topographic guides supporting elastic surface waves. The Journal of the Acoustical Society of America, Vol. 53, Issue 4, 1973, p. 1116-1122.
-
Aalami B. Waves in prismatic guides of arbitrary cross section. Journal of Applied Mechanics, Vol. 40, Issue 4, 1973, p. 1067-1072.
-
Viola E., Marzani A., Bartoli I. Semi-analytical Formulation for Guided Wave Propagation. Mechanical Vibration: Where do we Stand? Springer, Vienna, 2007, p. 105-121.
-
Ahmad Z. A. B., Gabbert U. Simulation of Lamb wave reflections at plate edges using the semi-analytical finite element method. Ultrasonics, Vol. 52, Issue 7, 2012, p. 815-820.
-
Bartoli I., et al. Modeling wave propagation in damped waveguides of arbitrary cross-section. Journal of Sound and Vibration, Vol. 295, Issue 3, 2006, p. 685-707.
-
Marzani A., Bartoli I. High frequency waves propagating in octagonal bars: a low cost computation algorithm. Algorithms, Vol. 2, Issue 1, 2009, p. 227-246.
-
Renno J. M., Mace B. R. On the forced response of waveguides using the wave and finite element method. Journal of Sound and Vibration, Vol. 329, Issue 26, 2010, p. 5474-5488.
-
Vasudeva S., et al. Estimation of elastic and damping characteristics of viscoelastically constrained carbon strands. Structural Dynamics and Materials Conference (SDM), 2006.

