Abstract
The problem of fatigue life prediction is still a scientific problem, which solution is necessary for industry, particularly for those branches in which failures threaten serious economic, environmental losses and human life. Petrochemical industry including transmission infrastructure – pipelines is example of such industry. Pipelines are exposed to damage due to various reasons, including vibration. Especially at risk are so called small bore connections (SBC) – a kind of branched connection on mainline piping. The paper presents the results of researches related to the development of a method for predicting a fatigue damage of SBC model. The method is based on measurements of current diagnostic signals (vibrations), without taking into consideration the history of previous loads or frequency analysis of extortions. Some experiments were carried out on originally designed and built the inertial fatigue machine. The experiment showed that it is possible to predict the fatigue strength of the specimen during the operation by observing certain combinations of vibration parameters.
1. Introduction
In commercial applications, inaccurate assessments of the current technical state and predicted future capability of mechanical systems can result in decisions that may underutilize remaining capability assets or potentially overtax assets that are on the verge of failure [1]. Accurate prediction of fatigue life of machines, equipment and structures is therefore critical for the safe production, both in economic terms and, above all, in human life, health and environmental safety [2, 3]. However, this prediction is extremely difficult. Fatigue evaluation under service loading is affected by uncertainties, and proper statistical tools should be used to manage a large amount of data [4]. In the literature, a lot of methods used for fatigue life prediction can be found – but mainly at the design stage. Three commonly used methods for fatigue life prediction: the stress – life method, strain-life method and linear elastic fracture mechanics are described in details in [5]. A time-based method that analyzes the fatigue crack growth behavior under variable amplitude loading caused by vibration is proposed in [6, 7]. An assessment methodology based on vibration tests and finite element analysis (FEA) to predict the fatigue life of electronic components under random vibration loading is given in [8, 9]. [10] presents a model-based method that predicts remaining useful life of a gear with a fatigue crack. The method consists of an embedded model to identify gear meshing stiffness measured from gear torsional vibration. In [11], a novel index was proposed to evaluate an effect for stress interaction by using entropy concept and fatigue life prediction. [12] explores the strengths and weaknesses of the main prognostics model classes to establish what makes them better suited to certain applications and how each have been applied to engineering prognostics. [13] gives an example of the use of neural networks in predicting a fatigue life of composite materials. [14] discusses a stiffness-based prognostic model for bearing systems based on vibration response analysis and damage mechanics. The utilization of frequency-domain methods: Wirsching-Light, Gao-Moan, Dirlik Zhao-Baker, Tovo-Benasciutti and Petrucci-Zuccarello for a vibration-fatigue-life estimation are presented in [15].
On design stage, it is difficult to correctly assume all operating parameters and loads of the device. This can lead to operational conditions into unexpected downtimes, failures or even disasters.
Therefore, the possibility of detecting the dangers associated with the fatigue is extremely important in operating conditions. The effective detection must be done early enough, that machine or the entire production process can be safely switched off, even if the degradation is already irreversible.
Pipelines are considered to be the most economic mode of transportation of gas/liquid in large quantities. Its functioning is similar to blood vessels serving to bring life-necessities: water, oil, gas. The functioning of the pipelines must have no risks-economic (interruption of the operation), environmental or related to the safety of people and pipeline integrity so design, monitoring and management become crucial [16, 17]. The same source specifies the causes of threats to the pipeline integrity like material and construction defects, mechanical damage, maintenance or third-party excavation, incorrect operation, corrosion, creep and cracking mechanisms, device failures and malfunctions, earthquakes and weather related damages.
Gas pipeline systems are subjected to fluctuating loads among others from turbulence/pressure pulsation and mechanical vibration from the adjacent machinery. Such vibration can potentially lead to fatigue failures, particularly in small bore attachments to the main pipe, like instrument fittings. The consequences of such failures depend on the installation but usually it is an unacceptable hazard [18].
Vibration related to fatigue accounts for a significant proportion of all pipework failures in process plants and pipeline facilities. A small bore pipework is particularly at risk [19].
A small bore connection (SBC) (Fig. 1(a) and 1(b)) is defined as a branched connection on mainline piping that is NPS 2” (DN 50) and smaller, including connections that have a branch pipe to mainline pipe ratio (“branch ratio”) of less than 10 %, and excluding connections that have a branch ratio greater than 25 % [20].
Fig. 1a) Small Bore Connection SBC – idea [20], b) small bore connections SBC (white arrows, manometers); source – own elaboration
![a) Small Bore Connection SBC – idea [20], b) small bore connections SBC (white arrows, manometers); source – own elaboration](https://static-01.extrica.com/articles/18046/18046-img1.jpg)
a)
![a) Small Bore Connection SBC – idea [20], b) small bore connections SBC (white arrows, manometers); source – own elaboration](https://static-01.extrica.com/articles/18046/18046-img2.jpg)
b)
Small bore connections (SBCs) are a major source of failure on piping systems but are infrequently evaluated during the design phase of a project or during the field commissioning phase. Piping vibration and fatigue can account for up to 20 % of hydrocarbon releases, and a large portion of those occurs due to failure of small bore connections [21]. The same source offers a review method of process pipe work vibration. The method is based on a risk assessment and provides both qualitative and quantitative screening techniques.
Gas pipeline systems incorporate numerous welded small bore connections such as instrument connections or stabbings, vent and drain points and bypasses around full bore valves. These are susceptible to fatigue failure due to vibration excited both through the structure and by gas pressure fluctuations. In order to minimize the probability of such failures, it is essential to have a reliable and rapid means of assessing connections that may be at risk. Methods have been developed for the rapid measurement of stresses in connections based on accelerometers and also on a frictional strain gauge [22].
[23] describes the issues of small-bore connection on Refinery CCR Platformer Net Gas Compressors where a series of failures is observed on small bore connection and associated tubing. Vibration/pulsation was the major contributing factor to various failures. It was found that small bore connections for PT, volume bottle drains, TI/TW were vibrating with a high vibration speed and amplitude.
Shell has incorporated the acceptance criteria given in [21] into the design philosophy and adopted them in vibration induced fatigue best practice as a RBI (risk based inspection) module. Practical application of these guidelines in assessing in service pipework susceptibility to vibration induced fatigue using a screening methodology was proposed. In tandem, a web-based software called Pipework LOF was developed incorporating these assessment procedures [24]. Literature [25-27] confirms that there is a correlation between the state of fatigue of technical object and the value of vibration and generally importance of state assessment. Generally, therefore, pipe vibrations are an important engineering problem but there are also reports [28] about the inverse problem – fluid flow control by forced vibrations of the pipe itself or the development of new types of liquid material dosing equipment.
The paper presents the results of researches related to the prediction of fatigue damage moment of a SBC model. The method is based on measurements of current diagnostic signals (vibrations), without taking into account the history of previous loads of technical object and without frequency analysis of extortions.
2. Test stand description
The research was carried out on the inertial fatigue machine (an essential part of the machine is shown in Fig. 2) designed and built on in the Faculty of Technical Sciences of Warmia and Masuria University. The machine performs bending fatigue tests of flat specimens (element 2 in Fig. 2) at adjustable from 0 to 50 Hz frequencies with controlled stepwise amplitude excitations equal to 1, 2 or 3 mm. The specimens have a notch (point 3 in Fig. 2) to force the initiation of fatigue failure in a certain (notch location) position. There are various mechanisms of initiation and development of a fatigue damage according to the type of material, its shape, surface condition, technology of production, existence of areas of stress concentration (e.g. notches) and loads of course. The propagation of such damages causes changes in the elastic and damping properties of material and its speed determine the value of fatigue strength (number of fatigue cycles). The effects of these fatigue damages, however, are always the same regardless of the material or type of loads – changes in the damping – elastic characteristics and as consequence – changes in the amplitude of vibration. Therefore, to accelerate the course of the experiment, it was decided to use flat-notched specimens. In addition, thus obtained test results were more reproducible due to the relatively easy repeatability of all the properties of such prepared samples.
Fig. 2View of testing stand (1 – weight, 2 – specimen, 3 – notch, 4 – upper eddy current sensor, 5 – lower eddy current sensor, 6 – spindle)
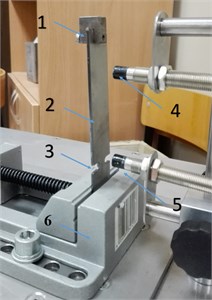
The specimen is fixed in the machine reciprocating spindle (element 6 in Fig. 2) and subjected to forced vibrations of the pre-determined amplitude and frequency. Different variables characterizing the process of vibration from the beginning of the experiment to specimen failure are continuously recorded by using a multichannel measurement system:
• amplitude of relative vibration (displacement) of the upper part of the specimen – eddy current sensor (element 4 in Fig. 2),
• amplitude of relative vibration (displacement) of the lower part of the specimen – eddy current sensor (element 5 in Fig. 2),
• absolute amplitude (acceleration) of the spindle - piezoelectric sensor,
• phase of vibration – reflective sensor,
• numbers of cycles to failure – optical sensor.
Vibration amplitude of the specimen upper part can be changed without changing parameters of fatigue machine (amplitude and frequency of extortion) by attaching to it the additional weights (element 1 in Fig. 2).
3. Test procedure and results
The experiment was conducted on five identical specimens made of steel S 235. In order to increase the forces of inertia and acceleration of the test procedure, a 50 g weight was mounted to the end of the specimen. Each specimen was subjected to forced vibrations of the same frequency and amplitude, until its destruction. During the experiments the number of cycles to failure and the selected vibration parameters given below were measured:
• the amplitude (displacement) of the relative specimen vibration in the vicinity of a notch, Al,
• the amplitude (displacement) of relative vibration near the end of the specimen, below the weight, Au,
• phase of vibrations p.
The experiment was conducted at excitations frequency f=20 Hz (resonance frequency of the specimen, specified in the preliminary researches) and the spindle amplitude Sa= 2 mm. The choice of frequency and amplitude was made on the basis of preliminary experiments results to ensure the destruction of the specimen in a relatively short time. Table 1 shows the specimens fatigue strength (number of cycles and time to destruction) results.
Table 1Specimens fatigue strength results
Specimen number | Number of cycles to destruction | Time to failure [s] |
1 | 100000 | 5000 |
2 | 98000 | 4900 |
3 | 103000 | 5150 |
4 | 95000 | 4750 |
5 | 109000 | 5450 |
Statistical studies (not reported in this study) showed no statistically significant differences in the values of the number of cycles and time to destroy specimens.
Sampling frequency fs was equal to 512 Hz for each specimen, single measurement included measurements of upper and lower sensor instantaneous amplitude of relative vibration as well as phase of vibration. Obtained results were presented in a form of multidimensional array M, whose elements are given by formula Mrm=[Alrm,Aurm,prm], where:
• Alrm, Aurm – (recorded) instantaneous amplitudes of lower and upper measurement point in measurement series r, measurement m,
• prm – (recorded) instantaneous phase in series r, measurement m,
• r – measurement series number, r=〈1,b〉 where b=2500 (average amount of series in 5 experiments),
• m – instantaneous measurement number in measurement series r, m=〈1,n〉, n=1024 except last measurement series b, where value of n depends on the moment of specimen destruction.
The following values were calculated on the base of mentioned above measurements:
• AlRMSr, AuRMSr – RMS values of amplitudes of lower and upper measurement point in series r,
• pRMSr – RMS values of phase in series r,
• Almaxr, Alminr, Aumaxr, Auminr – (determined) maximal and minimal values of amplitude of lower and upper measurement point in series r,
• pmaxr, pminr– (determined) maximal and minimal values of phase in series r.
Examples of the results of measurements and calculations for a series r= 1500 (as example) are given in Table 2 and in Fig. 3. 5000 seconds to destroy mean that total number of measurements in experiment r×m= 256000000, grouped in b=2 500 series (one series r lasts for 2 seconds).
Table 2Examples of results of measurements and calculations for a series of r= 1500
Measurement number m in series r=1500 | Lower sensor | Upper sensor | Phase [o] |
Instantaneous amplitude Al1500m [mm] | Instantaneous amplitude Au1500m [mm] | ||
1 | 2.42 | 3.85 | 1.43 |
2 | 2.35 | 3.8 | 1.45 |
… | … | … | … |
1 023 | 1.33 | 3.22 | 1.89 |
1 024 | 1.26 | 3.18 | 1.92 |
ARMS1500 [mm] | 3.1 | 4.05 | Prms1500= 20.85 |
Amin1500 [mm] | 0.37 | 2.49 | Pmin1500= –44.47 |
Amax1500 [mm] | 4.37 | 4.82 | Pmax1500= 41.98 |
Fig. 3Examples of results of instantaneous amplitude measurements for a series r= 1500
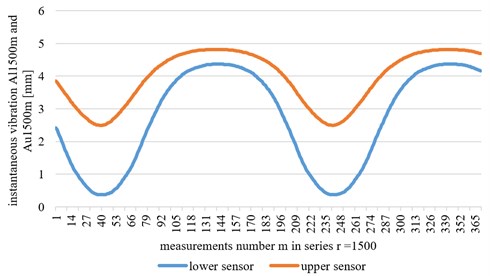
Fig. 4Changes of RMS value of vibration during experiment for lower and upper sensor
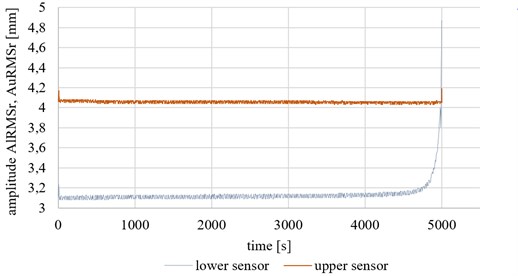
Fig. 4 presents changes of the RMS value of the vibration during the experiment for lower AlRMSrandupper AuRMSrsensor. Fig. 5 shows changes of phase p of the vibration for the upper measuring point, pRMS. for better clarity, the ordinate has been graduated in units of time, not series numbers.
Fig. 5Changes of vibration phase p for upper measuring point
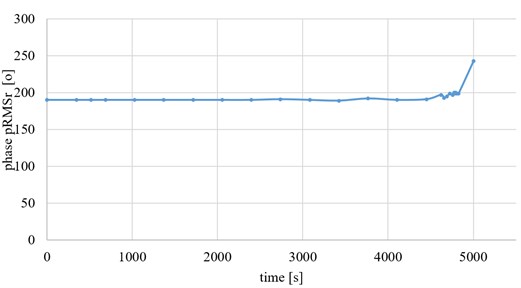
Approximately 500 seconds before the destruction of the specimen a slight increase can be noted in vibration AuRMSr recorded by the upper sensor as well as a slight increase in the value of pRMSr. These increases are slight that it would be difficult to implement the industrial applications for durability prediction.
It was noted, however, one can observe the changes in the behavior of the specimen much earlier by analyzing shapes which mapping the values are registered in a measurement channel as a function of the value recorded in another channel.
Assuming that displacement (amplitude) of the lower measuring point Alrm is a certain function α of time, frequency and amplitude of extortion force (refer to Eq. (1)), displacement of upper point Aurm are a certain function β of elasticity, damping and mass of specimen, the displacement of the lower measuring point and the distance between measuring points (refer to Eq. (2)), Aurm can be described as certain function γ of Alrm given by Eq. (3):
where f is the excitation frequency [Hz], Sa is spindle amplitude [mm], t is time [s], k is the damping coefficient of specimen [1/s], c is elasticity coefficient of specimen [N/m], m is the mass of specimen [kg], l is the distance between lower and upper sensor [m].
Fig. 6Plot of relative vibrations recorded by upper sensor as function of vibration values recorded by lower sensor
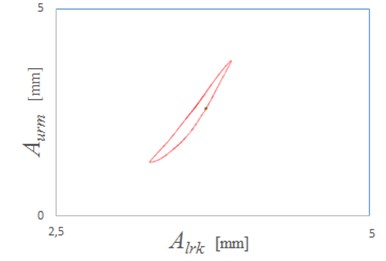
Example of function γ in shape of plot of relative vibrations recorded by the upper sensor Aurm as a function of vibration values recorded by the lower sensor Alrk is presented in Fig. 6. Fig. 7 shows sequence of such plots in different phases of experiment. Each plot represents two-seconds snapshot (one singe series r) from experiment.
Fig. 7Sequence of plots in different phases of experiment
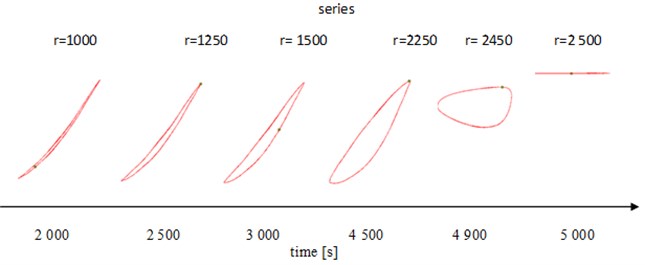
To about 2000 seconds of the experiment (i.e., about 3000 seconds before the destruction of the specimen, the shape remains unchanged – see the first shape (series r=1000)). from this point, there are significant changes in both shape and size of subsequent pictures. the practical use of this phenomenon, due to the number of SBCs in pipeline installations, requires the usage of relatively expensive and complex solutions in the field of pattern recognition. Thus, other measures of recorded signals (peak to peak) were selected. It was assumed, that:
The Fig. 8 and 9 show the changes of Aur and Alr values during experiment.
Fig. 8Changes in ranges (difference between maximum and minimum instantaneous vibration values in given series) for upper measuring point
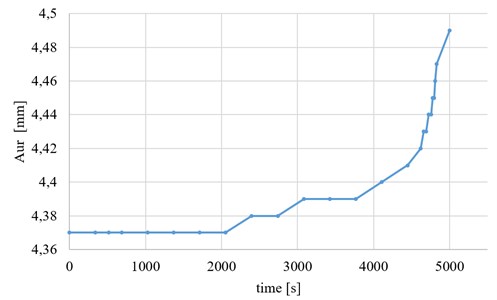
While the changes of Alr values are negligible, the changes of Aur allow a relatively early prediction and monitoring changes in specimen fatigue as well as changes of shapes in Fig. 7.
There is however a problem of identifying changes in the vibration resulting not from a change of the elastic – damping properties of the specimen, but from changes of the extortion (change of technical state of the equipment in the system, changes of process parameters, etc.).
Changes of the parameters (amplitude, frequency) of extortion cause changes in the amplitude and frequency of specimen response, both at the top and bottom part. to distinguish these changes and eliminate their influence on the accuracy of fatigue life prediction, variable Ar given by Eq. (5) was implemented:
Fig. 10 shows changes of Ar value during experiment. It can be seen from this diagram, that visible change starts later, at about 3000 second (2000 seconds to destruction) of experiment. Even so, it eliminates the effect of changes of recorded vibration resulting from other than elastic – damping properties changes (fatigue). It was further confirmed by the additional experiment in which the amplitude of vibration excitation was changed from initial 2 mm to 1 mm and 3 mm in next step and the course of changes in Ar value was still similar.
Fig. 9Changes in ranges (difference between the maximum and minimum instantaneous vibration values in given series) for lower measuring point
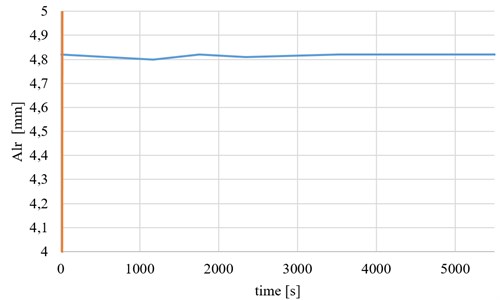
Fig. 10Changes of the Ar values during experiment
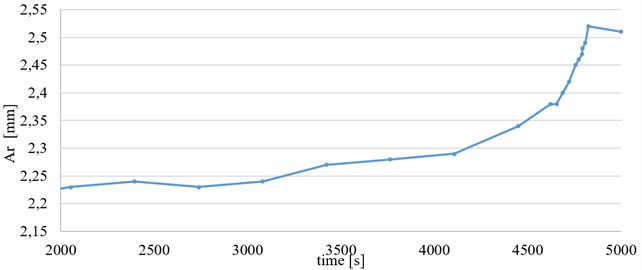
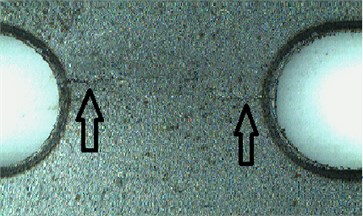
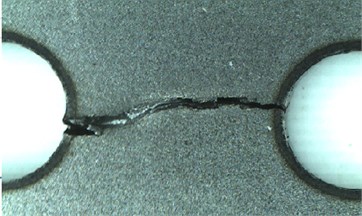
Fig. 11View of specimens cracks after a) 4000 seconds and b) 4800 seconds of experiment
a)
b)
Further experiments were conducted, where specimens were subjected to the same, initial extortion but the experiments were stopped after about 4000 seconds (r= 1250) and about 4800 seconds (r= 2400). After each experiment, the specimen was removed from the machine and subjected to visual examination. Photos of the surrounding area of notches (at 10x magnification) are shown in Fig. 11. in Fig. 11(a), the initiation of a fatigue crack in specimen can be seen as well as the full rupture in Fig. 11(b) (but still without breaking the continuity of the specimen). a comparison of the results of strength tests specimens are not subjected to experiment and specimens for which the experiment was stopped at about 4000 and 4800seconds shows a decrease in bending strength respectively by about 25 % and 90 % of the initial strength.
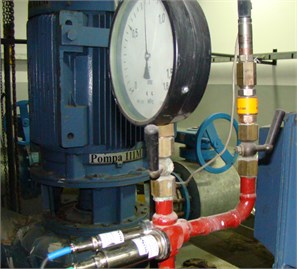
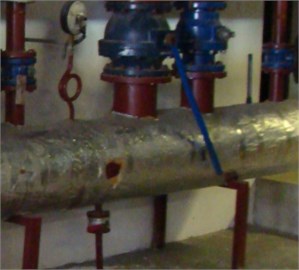
Fig. 12Measuring points a) SBC placed close to working in systems pump, b) SBC located on transmission part of pipework
a)
b)
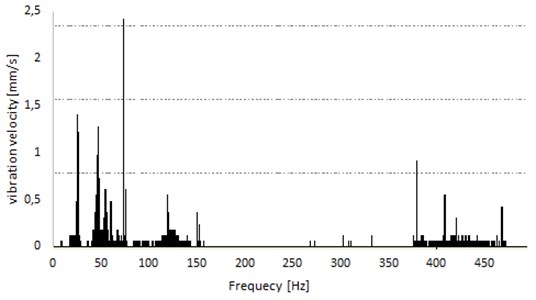
Fig. 13Spectra of signal recorded on measuring point from Fig. 12(a)
.
Fig. 14Spectra of signal recorded on measuring point from Fig. 12(b)
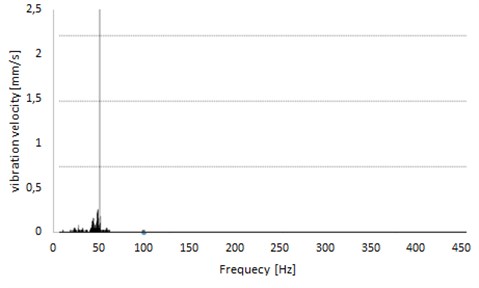
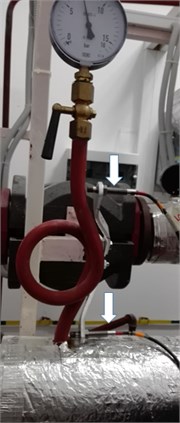
In order to evaluate the possibility of implementing the method for practical applications, an analysis of vibration signals was made from measuring points located at two SBCs in the functioning near the heating plant. These measuring points were placed both close to working in the systems machines like pumps and compressors (Fig. 12(a)) and located at the transmission part of piping (Fig. 12(b)). the aim of this analysis was to evaluate the vibration signals in terms of their repeatability. the spectra examples of recorded signals are presented in Fig. 13 and 14 the analysis of both signals showed that the waveforms of recorded vibrations are not repeatable at measurement points located near the working machines, and they are repeatable for points located further. Repeatability was evaluated by comparing the RMS and average values of time – domain waveforms at different times of heating plant operation. for points further afield, these differences did not exceed the accuracy of the measuring instrument. Lack of repeatability of the vibration signal in the vicinity of operating pumps is most likely caused by turbulent flow of the transported medium, which further becomes laminar. the characteristic component of 50 Hz in the spectrum corresponds to the rotational frequency of nearest pump. the practical application method was therefore decided to be carried out in the first step for the SBC, which operates under stable and repeatable conditions. a photograph of the measurement system is shown in Fig. 15 a small bore connection – connection of a pressure gauge on the water main pipeline is monitored by a system – consists of two relative vibration sensors (the upper sensor measures the vibration of tube manometer, just below gauge; the lower one – above the connection of main pipe with tube) and a processor system for signal recording and analyzing.
Fig. 15Measurement system practical implementation
4. Conclusions
The possibility of predicting fatigue life of technical facilities during the operation is scientific problem, which solution is important in almost all the industries. Especially it is important in areas where a failure can result in consequences for the human health and safety and the environment, such as in the petrochemical industry.
The experiment showed that it is possible to predict the fatigue strength of a specimen during the operation by observing the vibration symptoms like vibration amplitudes and phases and certain combinations of different measures of these parameters.
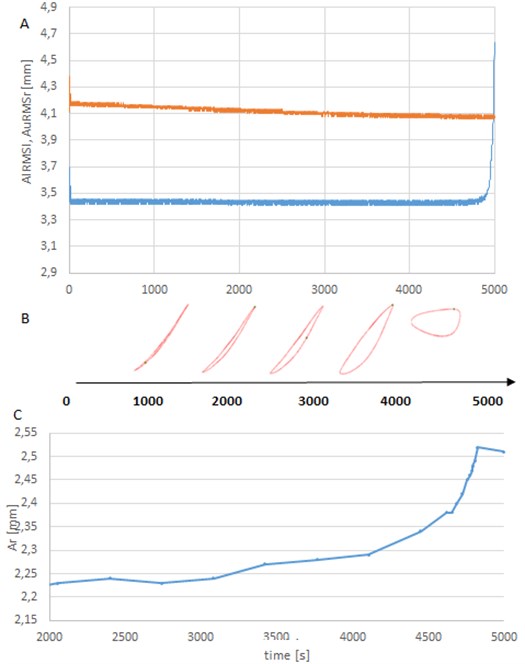
Fig. 16 compiles with visually changes of certain measurements (recorded, determined and calculated) of a vibration signal: simple – recorded amplitudes AlRMSr, AuRMSr for upper and lower sensor (Fig. 16(a)) and more complex – shapes in form of equation Aurm=γ(Alrm) (Fig. 16(b)) and ranges Ar (Fig. 16(c)) during experiment. Charts start with 2,000 seconds of the experiment because up to this point all measures have been unchanged.
It is visible, that using simple measures like amplitude (Fig. 16(a)), it is possible to predict a fatigue failure - in this experiment conditions – app. 500 seconds (8 minutes) before damage. Measurement of specimen strength properties (see Fig. 11) in this moment showed a loss of about 20 % of initial properties. the moment can be moved up even to half an hour before destruction using more sophisticated measures like these presented in Fig. 16(b) and (c). This time may be critical to the safety of people and environment and allows safely stopping the production process. Also, repairs and other corrective actions will be necessary on a smaller scale than if there has been a total failure.
Fig. 16Various measures of vibration signal in terms of their correlation with fatigue strength of specimen; a) AlRMSr, AuRMSr, b) Aurm=γAlrm and c) Ar
In this article, it is considered that such a practically useful measure of vibration signal can be the measure Ar – difference between peak to peak values in series recorded by the upper and lower sensors (Eq. 5). This measure changes its value with the change of the elastic and damping parameters of specimen (fatigue) but also is “insensitive” to changes in the vibration resulting from changes in the extortion mechanism (like technical state or process parameters). Practical implementation is now tested in a local power plant (Fig. 15). the system – as expected – is insensitive to changes in the operating parameters of the installation (related to operation of pumps in the system, changes in flow, pressure) but until now changes associated with fatigue of SBC have not been registered.
The proposed method can be a tool in the hands of maintenance services, but it is not its purpose to allow for long-term planning of maintenance or repairs activities. the method makes it possible to predict failure at a time when yet there is no direct threat to the implemented process, human health or environment and safe shutdown of the affected installation.
References
-
Kacprzynski G. J., Sarlashkar A., Roemer M. J., Hess A., Hardman B. Predicting remaining life by fusing the physics of failure modeling with diagnostics. Prognosis Materials Research Summary, Vol. 56, Issue 3, 2004, p. 29-35.
-
Jasiulewicz-Kaczmarek M. Role of Ergonomics in Implementation of the Social Aspect of Sustainability, Illustrated with the Example of Maintenance. Occupational Safety and Hygiene. CRC Press, Taylor and Francis, London, 2013, p. 47-52.
-
Jasiulewicz-Kaczmarek M., Drożyner P. Role of Maintenance in Reducing Negative Business Impact on Environment. Sustainability Appraisal: Quantitative Methods and Mathematical Techniques for Environmental Performance Evaluation, EcoProduction, Springer-Verlag Berlin Heidelberg, 2013, p. 142-166.
-
Tovo R. On the fatigue reliability evaluation of structural components under service loading. International Journal of Fatigue, Vol. 23, Issue 7, 2001, p. 587-598.
-
Lee Yung Li, Hathaway Jwo Mr Richard, Barkey Mark Fatigue Testing and Analysis. Theory and Practice, Elsevier, 2005.
-
Zhang W., Yong Ming Investigation of incremental fatigue crack growth mechanisms using in situ SEM testing. International Journal of Fatigue, Vol. 42, 2012, p. 14-23.
-
Rychlik A. Method for evaluating technical condition of wheel rims in slow moving vehicles based on modal parameters. Diagnostyka. Vol. 17, Issue 2, 2016, p. 65-70.
-
Yu Da, Al-Yafawi Abdullah, Nguyen Tung T., Park Seungbae, Chung Soonwan High-cycle fatigue life prediction for Pb-free BGA under random vibration loading. Microelectronics Reliability, Vol. 51, Issue 3, 2011, p. 649-656.
-
Katunin A. Application of time-frequency distributions in diagnostic signal processing problems: a case study. Diagnostyka, Vol. 17, Issue 2, 2016, p. 95-103.
-
Li James C., Lee Hyungdae Gear fatigue crack prognosis using embedded model, gear dynamic model and fracture mechanics. Mechanical Systems and Signal Processing, Vol. 19, Issue 4, 2005, p. 836-846.
-
Kim Junghoon, Yi Jio, Kim Jihwan, Zi Goangseup, Kong Jung Sik Fatigue life prediction methodology using entropy index of stress interaction and crack severity index of effective stress. International Journal of Damage Mechanics, Vol. 22, Issue 3, 2013, p. 375-392.
-
Sikorska J. Z., Hodkiewicz M., Ma L. Prognostic modelling options for remaining useful life estimation by industry. Mechanical Systems and Signal Processing, Vol. 25, Issue 5, 2011, p. 1803-1836.
-
Uygur A., Cicek E., Oklu R. T., Kara S., Aridimir S. Fatigue life predictions of metal matrix composites using artificial neural networks. Archives of Metallurgy and Materials, Vol. 59, Issue 1, 2014, p. 97-103.
-
Qiu J., Seth B., Liang, S. Y., Zhang C. Damage mechanics approach for bearing lifetime prognostics. Mechanical Systems and Signal Processing, Vol. 16, Issue 5, 2002, p. 817-829.
-
Mrsnik Matjaz, Slavic Janko, Boltežar Miha Frequency-domain methods for a vibration-fatigue-life estimation - Application to real data. International Journal of Fatigue, Vol. 47, p. 8-17, 2013.
-
Kishawy H. A., Hossam Gabbar A., Hossam A. Review of pipeline integrity management practices. International Journal of Pressure Vessels and Piping, Vol. 87, Issue 7, 2010, p. 373-380.
-
Moczulski W., Wyczółkowski R., Dąbrowski A. Integrated system of control and management of exploitation of water supply system. Diagnostyka, Vol. 17, Issue 1, 2016, p. 65-74.
-
Wintle John Pressure Systems Casebook: Causes and Avoidance of Failures and Defects. John Wiley and Sons, 2004.
-
Miles Toby, Andrews Bob Managing the risk of vibration related failures on facility pipework. 7th International Pipeline Conference, American Society of Mechanical Engineers, 2008, p. 385-393.
-
Harper Chris, Eng P. Integrity evaluation of small bore connections (branch connections). 9th Conference of the EFRC, 2014.
-
Guidelines for Avoidance of Vibration Induced Fatigue Failure in Process Pipework, 2nd Edition. Energy Institute, 2008.
-
Miles Toby, et al. Vibration assessment of connections to pipeline systems and the relation between vibration and process conditions. 22nd World Gas Conference, Tokyo, 2003.
-
Upreti K. C., Banerjee Dwaipayan Preventing from small bore piping/tubing failures in reciprocating compressors. ASME Turbo Expo 2013: Turbine Technical Conference and Exposition, American Society of Mechanical Engineers, 2013.
-
Lee G. Y. H. Web based software for quick screening of pipework vibration threats in LNG plants. ASME 2015 Pressure Vessels and Piping Conference, American Society of Mechanical Engineers, 2015.
-
Burdzik R., Węgrzyn T., Konieczny Ł., Lisiecki A. Research on influence of fatigue metal damage of the inner race of bearing on vibration in different frequencies. Archives of Metallurgy and Materials, Vol. 59, Issue 4, 2014, p. 1275-1281.
-
Warczek J., Młyńczak J., Burdzik R., Koniecznył Simulation of a visco-elastic damper based on the model of the vehicle shock absorber. Journal of Vibroengineering, Vol. 17, Issue 4, 2015, p. 2040-2048.
-
Kuminek T., Aniołek K., Młyńczak J. A numerical analysis of the contact stress distribution and physical modelling of abrasive wear in the tram wheel-frog system. WEAR, Vol. 328, 2015, p. 177-185.
-
Ragulskis M., Fedaravicius A. A., Ragulskis K. Harmonic balance method for FEM analysis of fluid flow in a vibrating pipe. Communications in Numerical Methods in Engineering, Vol. 22, Issue 5, 2006, p. 347-356.

