Abstract
The purpose of this study is to optimize the design of piezoelectric unimorph cantilevers, for ultra-thin keyboard design, so that the first resonant frequency is located in the sensitive frequency range and the first resonant amplitude is above the perception threshold of human hands for vibratory stimulus. The piezoelectric unimorphs used in this study have unequal active and passive areas. Simulations and experiments were first compared to find the effects of the dimensions on the first resonant frequency and displacement frequency response without collisions. A finite element model with collisions based on the verified boundary conditions was then built. Both the experiment data and simulation data was combined to build a regression model to predict the first resonant frequency with collisions for ultra-thin keyboard design. This study can help designers quickly design a vibrotactile device, in the early design stage.
1. Introduction
With the advances of technology, more devices provide tactile feedback to deliver more sensory information to meet various user needs. Vibration is one of the most common tactile signals. Vibrotactile feedback should consider the sensitive frequency range of human hands. In human glabrous skin, there are four receptors to detect external mechanical stimuli. These receptors have different sensitive frequencies and receptive fields [1]. Prior research showed that these receptors have sensitive vibration frequencies ranging from 1 Hz to 500 Hz. In addition, human fingers are most sensitive to frequencies around 200 Hz [2-5], and human hands can feel vibratory stimulus with an amplitude as low as 0.2 μm [6].
Piezoelectric actuators can provide different vibration waveforms. Therefore, several applications used piezoelectric actuators to create realistic tactile feedback [7, 8]. In order to fully utilize the vibratory nature of piezoelectric actuators, the effects of the dimensions of a piezoelectric unimorph cantilever on the resonant frequencies need to be studied [9].
Bailey and Ubbard [10] first used Euler-Bernoulli beam theory to derive a motion equation for a piezoelectric unimorph cantilever beam without collisions. Based on Euler-Bernoulli beam theory, Bilgen et al. [11] and Erturk and Inman [12] considered viscous damping and Kelvin-Voigt damping to obtain a new motion equation. The difference between a cantilever beam and a cantilever plate is their widths. If the length to width ratio is greater than 2, Euler-Bernoulli beam theory can accurately predict the resonant frequencies within ±2.5 % [13]. Although Euler-Bernoulli beam theory can accurately predict the resonant frequencies, it is only applicable to the beams with large length/width ratio [11]. In addition, Euler-Bernoulli beam theory can only be applied to piezoelectric unimorphs with equal active and passive areas.
Kim et al. [14] built a finite element (FE) model to discuss the electrical conductivity and susceptance of a piezoelectric unimorph cantilever plate under a voltage load. Li et al. [15] found an optimal thickness ratio to maximize the static displacement under an applied voltage. Shu et al. [16] derived a dynamic model, by the weak form of FEM, to find an optimal thickness ratio to maximize the dynamic response under drive currents.
Although many studies discussed the performance of a piezoelectric unimorph cantilever under base excitation [17-19]. Most of them considered equal active and passive areas without collisions. Very little research discussed the performance of an unequal-active-and-passive-area piezoelectric unimorph cantilever with collisions. This study discusses the dimension effects of an unequal-active-and-passive-area piezoelectric unimorph cantilever on the first resonant frequency and the displacement frequency response for the design of a vibrotactile ultra-thin keyboard. The vibration frequency of the keyboard is controlled within the human sensitive vibration frequency range, and the displacement frequency response is controlled larger than the perception threshold of human hands. This paper is organized as follows. Section 2 discusses the effects of dimensions, without collisions. Section 3 discusses the design optimization of piezoelectric unimorph cantilevers, with collisions. Section 4 offers conclusions.
2. Dimension effects without collisions
In this study, the piezoceramic was glued at the center of the cantilevers. The coupling between parameters was ignored, and the glue thickness between active and passive areas was fixed.
2.1. Experiment
The active layer of the piezoelectric unimorph was made from PZT (lead zirconate titanate) ceramic piezoelectric material, manufactured by sintering. Table 1 shows the material properties of the piezoceramic, in which c11, c12, c13, c33, c44, and c66 were the parameters in the elastic constant matrix, d31, d33, and d15 were the piezoelectric strain constants, and ε33 was the relative permittivity. Based on the deformation characteristics of PZT, some parameters can be simplified and reduced to 0. Therefore, the parameters which were not shown in Table 1 were all zero. The passive layer was made from copper and zinc alloy CuZn37, and its elastic constant was 110 GPa, density was 8550 kg/m3, and the Poisson ratio was 0.3. The piezoceramic active layer and brass passive layer were bonded by an electrically conductive adhesive (Henkel LOCTITE® 336TM). The thickness of the conductive adhesive was 0.02 mm, its Shore Hardness after cured was 45, and its density after cured was 1060 kg/m3.
Table 1Material properties of the PZT piezoceramic
c11 | 70.00 GPa | Density | 7800 kg/m3 |
c12 | 39.78 GPa | d31 | –2.00e-10 m/V |
c13 | –40.79 GPa | d33 | 4.50e-10 m/V |
c33 | 62.45 GPa | d15 | 6.00e-10 m/V |
c44 | 13.09 GPa | ε33 | 2000 |
c66 | 15.11 GPa |
Fig. 1Piezoelectric unimorph clamped by a fixture
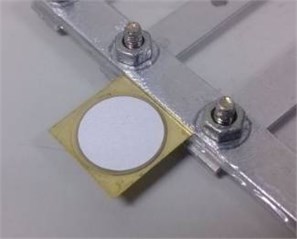
Fig. 2Experiment setting for piezoelectric unimorph cantilevers without collisions
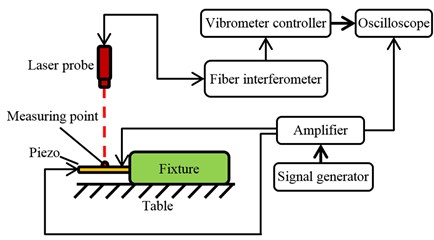
Table 2 shows the dimensions of all the samples used in the experiment. Samples No. 1 to 9 had equal active and passive areas. Samples No. 10 to 16 had unequal active and passive areas. The piezoelectric unimorphs were clamped under a fixed-free boundary condition by an aluminum fixture, without collisions, as shown in Fig. 1. The piezoelectric unimorph cantilevers were excited by a ±15 sinusoidal voltage signal. The Polytec OFV3000 vibrometer controller and Polytec OFV502 fiber interferometer were used to measure the displacement at the center of the cantilevers. The experiment setting, without collisions, is shown in Fig. 2.
Table 2The dimensions of the samples (unit: mm)
Sample No. | Brass | Piezoceramic | ||||
L | W | T | L | W | T | |
1 | 13 | 14 | 0.05 | 13 | 14 | 0.05 |
2 | 12 | 14 | 0.05 | 12 | 14 | 0.05 |
3 | 10 | 14 | 0.05 | 10 | 14 | 0.05 |
4 | 8 | 10 | 0.05 | 8 | 10 | 0.1 |
5 | 8 | 10 | 0.1 | 8 | 10 | 0.05 |
6 | 8 | 10 | 0.1 | 8 | 10 | 0.15 |
7 | 8 | 10 | 0.15 | 8 | 10 | 0.1 |
8 | 8 | 6 | 0.1 | 8 | 6 | 0.05 |
9 | 8 | 2 | 0.1 | 8 | 2 | 0.05 |
10 | 16 | 16 | 0.05 | 14.8 | 14.8 | 0.05 |
11 | 16 | 16 | 0.05 | Ø14.8 | 0.05 | |
12 | 16 | 16 | 0.1 | Ø 14.8 | 0.05 | |
13 | 12 | 12 | 0.05 | Ø 10.8 | 0.05 | |
14 | 12 | 12 | 0.15 | Ø 10.8 | 0.15 | |
15 | 8 | 8 | 0.05 | Ø 7 | 0.05 | |
16 | 8 | 8 | 0.1 | Ø 7 | 0.1 | |
2.2. Finite element model
2.2.1. Boundary condition
The finite element package ANSYS was used to conduct the numerical simulations of the piezoelectric unimorph cantilevers. The FE model consisted of three layers, including the PZT ceramic layer (50 μm thick), the conductive adhesive layer (20 μm thick), and the brass substrate layer (50 μm thick). A three-dimensional 20-node coupled-field solid element, SOLID226, was used to model the PZT layer, and a three-dimensional 20-node structural solid element, SOLID186, was used to model the brass and adhesive layers. A uniform hexagonal mesh was created with a minimum element size of 25 μm, and the reduced integration method was used. Numerical results were insensitive to further refinement of the mesh. The material properties of the PZT shown in Table 1 were used in the simulations.
Since the physical piezoelectric unimorphs were clamped in a fixture at its end side, there were two possible boundary conditions in the FE simulation, as shown in Fig. 3. Boundary condition (a) simulates the piezoelectric unimorphs fixed at the upper edge and the lower edge of the end side. Boundary condition (b) simulates the piezoelectric unimorph fixed at the entire end side.
Fig. 3Two possible boundary conditions for the FE simulation

a)

b)
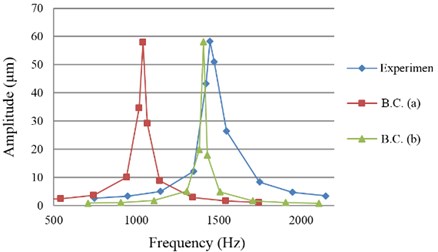
Both boundary conditions were tested to see which one is closer to the experiment. Fig. 4 shows one example. The results showed that the first resonant frequencies for boundary condition (b) were closer to the experiment. Thus, boundary condition (b) was chosen to build the FE models in this study.
Fig. 4The results of boundary condition (a) and boundary condition (b) on Sample 7
2.2.2. FE model verification
The results of the FE simulations for samples No. 1 to 9 were compared with the results of Euler-Bernoulli beam theory and experiment as shown in Fig. 5. The theoretical results were obtained from the equations derived by Erturk and Inman [12].
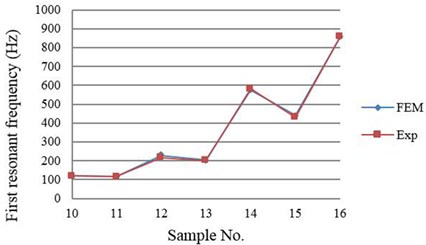
However, since Euler-Bernoulli beam theory is only applicable to piezoelectric unimorph cantilevers with equal active and passive areas, the results of the FE simulations for samples No. 10 to 16 were only compared with the results of experiment as shown in Fig. 6.
Fig. 5 shows the average error of the first resonant frequency between simulation and experiment was 5.83 % for samples No. 1 to 9. Fig. 6 shows the average error of the first resonant frequency between simulation and experiment was 5.46 % for samples No. 10 to 16. Fig. 5 shows that the experiment and FE simulation results were very close. However, the results of Euler-Bernoulli beam theory were different. It is because some parameters in Euler-Bernoulli beam theory were simplified and the strains in the thickness direction and in the width direction were ignored. In addition, the conductive adhesive layer was also ignored in the theory.
Fig. 5First resonant frequency obtained from theory, FE simulation, and experiment for equal-area samples (No. 1 to 9)
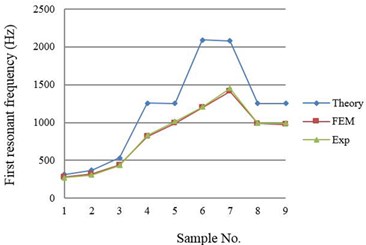
Fig. 6First resonant frequency obtained from FE simulation and experiment for unequal-area samples (No. 10 to 16)
2.3. Result comparisons
For piezoelectric unimorphs with unequal active and passive areas, the area of piezoceramic did not significantly affect the first resonant frequency. However, the area of piezoceramic significantly affects the first resonant amplitude. Larger piezoceramic has larger first resonant amplitude.
Piezoceramic thickness does not significantly affect the first resonant frequency when thickness ratio (Q=hs/hp, where hs was brass thickness and hp was piezoceramic thickness) is greater than certain value (Q= 0.4 when brass thickness is fixed at 0.05 mm). However, piezoceramic thickness affects the first resonant amplitude significantly. Thinner piezoceramic thickness has larger first resonant amplitude.
The length of brass significantly affects the first resonant frequency and first resonant amplitude. Longer brass length has lower first resonant frequency but larger first resonant amplitude. The width of brass does not significantly affect the first resonant frequency. However, the width of brass significantly affects the first resonant amplitude. Wider brass has smaller first resonant amplitude.
Brass thickness affects the first resonant frequency significantly. Thicker brass layer has higher first resonant frequency. Brass thickness also affects the first resonant amplitude significantly. However, there is a certain thickness ratio for a maximum displacement value (0.4 when piezoceramic thickness is fixed at 0.05 mm).
3. Dimension effects with collisions
This study used piezoelectric unimorphs with unequal active and passive areas to create a single-point vibration keyboard, i.e., each key vibrates independently. In addition, the first resonant frequency of each key should be between 100 Hz and 300 Hz, and the amplitude of each key should be larger than 0.2 µm.
Fig. 7Piezo supported by a square frame
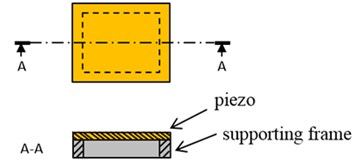
If a finger presses on a piezoelectric unimorph cantilever without being supported, it would inhibit and reduce the haptic effects. Therefore, in this study, each piezoelectric unimorph was supported by a square frame, as shown in Fig. 7. However, when the piezoelectric unimorph vibrated, it would collide with the supporting frames.
Experiments and FE simulations can only obtain discrete and limited results. It is better for designers to have a continuous model to predict the performance of their designs for arbitrary dimensions. Since it is costly to manufacture a wide variety of piezoelectric unimorphs, and it is time consuming to run a collision simulation, in this study, the experiment data and simulation data was combined to obtain a regression model for predicting the first resonant frequency of the piezoelectric unimorph cantilevers with collisions.
3.1. Collision experiment
The experiment setting for measuring the first resonant frequency was similar to Fig. 2, except that each piezoelectric unimorph was supported by a square frame. The piezoelectric unimorphs were excited by a ±15 sinusoidal voltage signal. Twenty-seven piezoelectric unimorphs with different sizes were measured, as shown in Table 3.
Fig. 8 shows the first resonant frequency obtained from the collision experiment. The result has a similar trend as that of without collisions: thicker brass thickness has higher first resonant frequency, but piezoceramic thickness does not significantly affect the first resonant frequency.
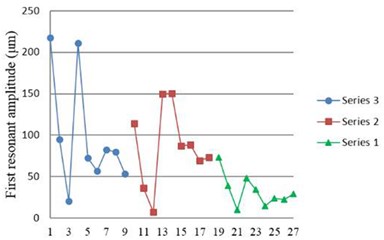
Fig. 9 shows the first resonant amplitude obtained from the collision experiment. The result also has a similar trend as that of without collisions: thinner piezoceramic thickness has higher first resonant amplitude.
Table 3Experiment samples (unit: mm)
No. | Brass | PZT | Brass thickness | PZT thickness |
1.1 | 8×8 | φ7 | 0.05 | 0.05 |
1.2 | 8×8 | φ7 | 0.05 | 0.1 |
1.3 | 8×8 | φ7 | 0.05 | 0.15 |
1.4 | 8×8 | φ7 | 0.1 | 0.05 |
1.5 | 8×8 | φ7 | 0.1 | 0.1 |
1.6 | 8×8 | φ7 | 0.1 | 0.15 |
1.7 | 8×8 | φ7 | 0.15 | 0.05 |
1.8 | 8×8 | φ7 | 0.15 | 0.1 |
1.9 | 8×8 | φ7 | 0.15 | 0.15 |
2.1 | 12×12 | φ10.8 | 0.05 | 0.05 |
2.2 | 12×12 | φ10.8 | 0.05 | 0.1 |
2.3 | 12×12 | φ10.8 | 0.05 | 0.15 |
2.4 | 12×12 | φ10.8 | 0.1 | 0.05 |
2.5 | 12×12 | φ10.8 | 0.1 | 0.1 |
2.6 | 12×12 | φ10.8 | 0.1 | 0.15 |
2.7 | 12×12 | φ10.8 | 0.15 | 0.05 |
2.8 | 12×12 | φ10.8 | 0.15 | 0.1 |
2.9 | 12×12 | φ10.8 | 0.15 | 0.15 |
3.1 | 16×16 | φ14.8 | 0.05 | 0.05 |
3.2 | 16×16 | φ14.8 | 0.05 | 0.1 |
3.3 | 16×16 | φ14.8 | 0.05 | 0.15 |
3.4 | 16×16 | φ14.8 | 0.1 | 0.05 |
3.5 | 16×16 | φ14.8 | 0.1 | 0.1 |
3.6 | 16×16 | φ14.8 | 0.1 | 0.15 |
3.7 | 16×16 | φ14.8 | 0.15 | 0.05 |
3.8 | 16×16 | φ14.8 | 0.15 | 0.1 |
3.9 | 16×16 | φ14.8 | 0.15 | 0.15 |
Fig. 8First resonant frequency obtained from experiment
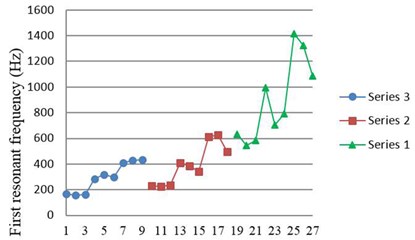
Fig. 9First resonant amplitude obtained from experiment
3.2. Collision simulation
The complex collision elements were represented by the COMBIN40 elements in ANSYS to describe the collisions between two objects. The elements were composed of one closable plane and one separable plane. The initial gap was zero, but it allowed separation. The contact stiffness was 1 N/m, which was calibrated according to the experimental results. The sliding force (FSLIDE) and mass (M) in the COMBIN40 elements were not used in this study. The verified boundary conditions in Fig. 3(b) were used. The collision model in Fig. 10 was used since it had the closest match compared to the experiment. Five COMBIN40 elements on both sides near the clamping end were used.
Table 4Simulation samples (unit: mm)
No. | Brass length | Brass width | PZT length | PZT width |
1 | 16 | 16 | φ14.8 | |
2 | 16 | 16 | φ10.8 | |
3 | 16 | 16 | φ7 | |
4 | 16 | 12 | φ10.8 | |
5 | 16 | 12 | φ7 | |
6 | 16 | 8 | φ7 | |
7 | 12 | 16 | φ10.8 | |
8 | 12 | 16 | φ7 | |
9 | 12 | 12 | φ10.8 | |
10 | 12 | 12 | φ7 | |
11 | 12 | 8 | φ7 | |
12 | 16 | 16 | 14.8 | 14.8 |
13 | 16 | 16 | 14.8 | 10.8 |
14 | 16 | 16 | 14.8 | 7 |
15 | 16 | 16 | 10.8 | 14.8 |
16 | 16 | 16 | 10.8 | 10.8 |
17 | 16 | 16 | 10.8 | 7 |
18 | 16 | 16 | 7 | 14.8 |
19 | 16 | 16 | 7 | 10.8 |
20 | 16 | 16 | 7 | 7 |
21 | 16 | 12 | 14.8 | 10.8 |
22 | 16 | 12 | 14.8 | 7 |
23 | 16 | 12 | 10.8 | 10.8 |
24 | 16 | 12 | 10.8 | 7 |
25 | 16 | 12 | 7 | 10.8 |
26 | 16 | 12 | 7 | 7 |
27 | 16 | 8 | 14.8 | 7 |
28 | 16 | 8 | 10.8 | 7 |
29 | 16 | 8 | 7 | 7 |
30 | 12 | 16 | 10.8 | 14.8 |
31 | 12 | 16 | 10.8 | 10.8 |
32 | 12 | 16 | 10.8 | 7 |
33 | 12 | 16 | 7 | 10.8 |
34 | 12 | 16 | 7 | 7 |
35 | 12 | 12 | 10.8 | 10.8 |
36 | 12 | 12 | 10.8 | 7 |
37 | 12 | 12 | 7 | 10.8 |
38 | 12 | 12 | 7 | 7 |
39 | 12 | 8 | 10.8 | 7 |
40 | 12 | 8 | 7 | 7 |
Based on the design constraints and the manufacturing limitation, brass thickness and PZT thickness were fixed at 0.05 mm in the keyboard design. Therefore, in the collision simulation, brass thickness and PZT thickness were fixed at 0.05 mm. Forty piezoelectric unimorphs with different sizes were simulated, as shown in Table 4.
Fig. 11 shows the first resonant frequency obtained from the collision simulation. The result has a similar trend as that of without collisions: longer brass length has lower first resonant frequency.
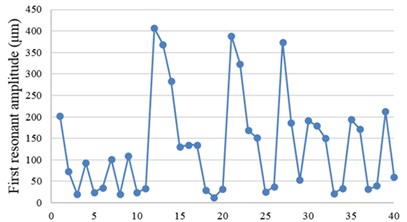
Fig. 12 shows the first resonant amplitude obtained from the collision simulation. The result also has a similar trend as that of without collisions: larger piezoceramic has larger first resonant amplitude. However, for rectangular piezoceramic with the same area, larger length has larger first resonant amplitude.
Fig. 10A FE collision model
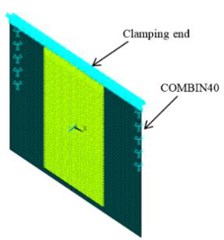
Fig. 11First resonant frequency
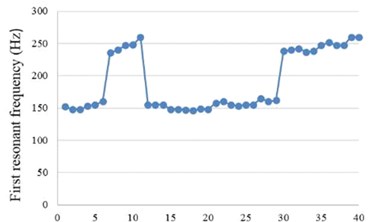
Fig. 12First resonant amplitude
3.3. Regression model
Combining the experiment data (PZT dimensions, brass dimensions, and the corresponding first resonant frequencies) and simulation data (PZT dimensions, brass dimensions, and the corresponding first resonant frequencies), using JMP (a statistical analysis tool), a regression model for predicting the first resonant frequency with collisions was built, as shown in Fig. 13. The definitions of the variables in the regression model are as follows: PZTmass is the mass of the PZT; BrassThick is the thickness of the brass; I_Brass is the moment of inertia of the brass; L is the length of the brass; m is the mass of the PZT plus the mass of the brass.
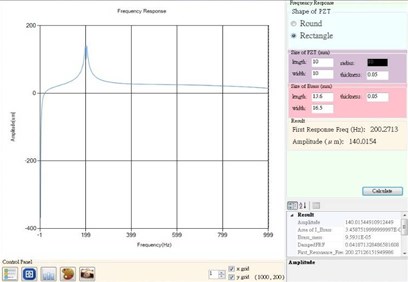
The R2 value is 0.9876, which means that the regression model fits the data quite well. Fig. 14 shows a graphical user interface implemented using the regression model and Visual C #. Using the tool, designers only need to input PZT dimensions and brass dimensions, the program can quickly predict the first resonant frequency of their designs, in the early design stage.
Fig. 13The regression model for predicting the first resonant frequency
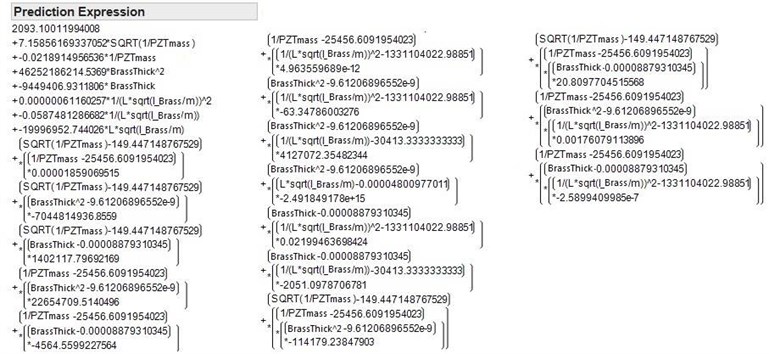
Fig. 14A graphical user interface
3.4. Keyboard design
Fig. 15 shows a final keyboard design. The dimensions of each key type are shown in Table 5. The predicted and measured first resonance frequencies are compared. The experiment setup was the same as in Fig. 2. A±19 sinusoidal voltage signal was used to drive the keys. The displacements of the centers of the keys were measured, for every 25 Hz between 50 Hz and 300 Hz, to find the first resonant frequencies.
Fig. 15A final keyboard rototype
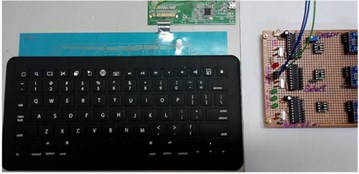
Table 5The dimensions of each key type (unit: mm)
No. | Key Type | Brass | PZT ceramic | ||||
Length | Width | Thickness | Length | Width | Thickness | ||
1 | Function | 13.60 | 13.83 | 0.05 | 10 | 10 | 0.05 |
2 | `, -, = | 13.60 | 11.30 | 0.05 | 10 | 10 | 0.05 |
3 | Normal | 13.60 | 16.50 | 0.05 | 10 | 10 | 0.05 |
4 | Delete | 13.60 | 23.60 | 0.05 | 10 | 10 | 0.05 |
5 | Tab | 13.60 | 12.60 | 0.05 | 10 | 10 | 0.05 |
6 | [, ] | 13.60 | 14.00 | 0.05 | 10 | 10 | 0.05 |
7 | Caps lock | 13.60 | 17.30 | 0.05 | 10 | 10 | 0.05 |
8 | :, “ | 13.60 | 15.53 | 0.05 | 10 | 10 | 0.05 |
9 | Enter | 13.60 | 26.64 | 0.05 | 10 | 10 | 0.05 |
10 | Shift | 13.60 | 33.30 | 0.05 | 10 | 10 | 0.05 |
11 | Control-l, alt, cmd | 16.90 | 17.30 | 0.05 | 10 | 10 | 0.05 |
12 | Fn, control-r | 16.90 | 14.00 | 0.05 | 10 | 10 | 0.05 |
13 | Space | 16.90 | 40.30 | 0.05 | 10 | 10 | 0.05 |
14 | Arrow | 16.90 | 13.10 | 0.05 | 10 | 10 | 0.05 |
The regression model was used to predict the first resonant frequencies. Table 6 shows the predicted and measured first resonance frequencies for all key types. The average error of the predicted first resonance frequencies was 15.08 %, and the standard deviation was 10.01 %. The results showed that the regression model could well predict the first resonant frequencies. Table 6 also shows that the measured first resonant displacements were all larger than 0.2 µm.
Table 6Predicted and measured first resonance frequencies and measured displacements
No. | Key Type | First resonance frequencies | Measured displacement (µm) | ||
Predicted (Hz) | Measured (Hz) | Error (%) | |||
1 | Function | 204.39 | 266.25 | 23.23 | 34.112 |
2 | `, -, = | 208.27 | 330.5 | 36.98 | 20.704 |
3 | Normal | 200.27 | 190.25 | 5.63 | 56.700 |
4 | Delete | 193.67 | 285.75 | 32.23 | 37.440 |
5 | Tab | 205.78 | 194.25 | 5.93 | 22.736 |
6 | [, ] | 203.93 | 233 | 12.48 | 31.936 |
7 | Caps lock | 200.06 | 185 | 8.14 | 36.992 |
8 | :, “ | 201.46 | 224.25 | 10.16 | 25.408 |
9 | Enter | 191.27 | 229.5 | 16.66 | 50.688 |
10 | Shift | 187.41 | 232.75 | 19.48 | 22.176 |
11 | Control-l, alt, cmd | 133.29 | 124.5 | 7.06 | 18.048 |
12 | Fn, control | 127.66 | 112.5 | 13.48 | 61.440 |
13 | Space | 115.52 | 136.75 | 15.52 | 22.144 |
14 | Arrow | 135.09 | 129.75 | 4.12 | 25.664 |
4. Conclusions
This study discussed the effects of the dimensions of the active and passive layers of a piezoelectric unimorph cantilever on the first resonant frequency, with and without collisions. Under the condition of without collisions, the results showed that the average error of the first resonant frequency between simulation and experiment was smaller than 5.46 %. Shorter brass or thicker brass have higher first resonant frequency. Larger piezoceramic area, thinner piezoceramic, longer brass, or narrower brass have larger first resonant amplitude.
A finite element model with collisions based on the verified boundary conditions was built. A regression model for predicting the first resonant frequencies with collisions was created. The average error for predicting the first resonance frequencies was 15.08 %. Based on the regression model, an ultra-thin piezoelectric keyboard was created, and the measured first resonant frequencies of all keys were within 100 Hz and 300 Hz, and the first resonant amplitudes were all larger than 0.2 µm.
The results of this study can help designers quickly design a piezoelectric haptic device with desired resonant frequencies, in the early design stage. The piezoceramic used in this study was manufactured by powder sintering. In the future, piezoceramic crystal can be used to increase the prediction accuracy. In addition, the current study only focuses on the dimension effects on the first resonant frequency and first resonant amplitude. In the future, dimension effects on the acceleration and the actuating force of the piezoelectric unimorphs will be discussed.
References
-
Johansson R. S., Vallbo Å. B. Tactile sensory coding in the glabrous skin of the human hand. Trends in Neurosciences, Vol. 6, 1983, p. 27-32.
-
Kruger L., Friedman M., Carterette E. Pain and Touch. Academic Press, California, 1996.
-
Burdea G. C. Force and Touch Feedback for Virtual Reality. Wiley-Interscience, New York, 1996.
-
Johnson K. O. The roles and functions of cutaneous mechanoreceptors. Current Opinion in Neurobiology, Vol. 11, 2001, p. 455-461.
-
Kyung K.-U., Son S.-W., Kwon D.-S., Kim M.-S. Design of an integrated tactile display system. IEEE International Conference on Robotics and Automation, Vol. 1, 2004, p. 776-781.
-
Poupyrev I., Maruyama S., Rekimoto J. Ambient touch: designing tactile interfaces for handheld devices. Proceedings of the 15th Annual ACM Symposium on User Interface Software and Technology, Paris, France, 2002.
-
Summers I. R., Chanter C. M. A broadband tactile array on the fingertip. Journal of the Acoustical Society of America, Vol. 112, 2002, p. 2118-2126.
-
Baylan B., Aridogan U., Basdogan C. Finite element modeling of a vibrating touch screen actuated by piezo patches for haptic feedback. Haptics: Perception, Devices, Mobility, and Communication. Springer, Berlin Heidelberg, 2012.
-
Yi J. W., Shih W. Y., Shih W.-H. Effect of length, width, and mode on the mass detection sensitivity of piezoelectric unimorph cantilevers. Journal of Applied Physics, Vol. 91, 2002, p. 1680-1686.
-
Bailey T., Ubbard J. E. Distributed piezoelectric-polymer active vibration control of a cantilever beam. Journal of Guidance, Control, and Dynamics, Vol. 8, 1985, p. 605-611.
-
Bilgen O., Karami M. A., Inman D. J., Friswell M. I. The actuation characterization of cantilevered unimorph beams with single crystal piezoelectric materials. Smart Materials and Structures, Vol. 20, 2011, p. 055024.
-
Erturk A., Inman D. J. On mechanical modeling of cantilevered piezoelectric vibration energy harvesters. Journal of Intelligent Material Systems and Structures, Vol. 19, 2008, p. 1311-1325.
-
Villanueva L. G., Karabalin R. B., Matheny M. H., Chi D., Sader J. E., Roukes M. L. Nonlinearity in nanomechanical cantilevers. Physical Review B, Vol. 87, 2013, p. 024304.
-
Kim J., Varadan V. V., Varadan V. K., Bao X.-Q. Finite-element modeling of a smart cantilever plate and comparison with experiments. Smart Materials and Structures, Vol. 5, Issue 165, 1996, p. 165-170.
-
Li X., Shih W. Y., Aksay I. A., Shih W.-H. Electromechanical behavior of PZT-brass unimorphs. Journal of the American Ceramic Society, Vol. 82, 1999, p. 1733-1740.
-
Shu L., D. M. J., E. P. G., Chen D., Lu Q. Optimization and dynamic modeling of galfenol unimorphs. Journal of Intelligent Material Systems and Structures, Vol. 22, 2011, p. 781-793.
-
Elvin N. G., Elvin A. A. A coupled finite element-circuit simulation model for analyzing piezoelectric energy generators. Journal of Intelligent Material Systems and Structures, Vol. 20, 2009, p. 587-595.
-
Littrell R., Grosh K. Modeling and characterization of cantilever-based MEMS piezoelectric sensors and actuators. Journal of Microelectromechanical Systems, Vol. 21, 2012, p. 406-413.
-
Wang Qingping, Pei Xuebing, Wang Qi, Jiang Shenglin Finite element analysis of a unimorph cantilever for piezoelectric energy harvesting. International Journal of Applied Electromagnetics and Mechanics, Vol. 40, Issue 4, 2012, p. 341-351.
About this article
The authors would like to thank the Ministry of Science and Technology of Taiwan for providing support for this research under Contract MOST 104-2221-E-002-066-MY2.
