Abstract
Haptic interaction plays an important role in virtual reality and human-computer interaction paradigms. However, most haptic devices only create kinesthetic feedback or simple unrealistic tactile feedback. This study presents theory and practice for creating realistic tactile feedback. The approach is based upon skin sensing capabilities, tactile perception principles, and tactile stimulation techniques. The approach uses a vibration sensor, controller, and actuator to create a tactile haptic device. The device is portable, small, light, and cost-effective. This study uses the device to create realistic tactile sensations from actual surface features, and measures the effects of tactile haptic feedback on user surface texture perception. Verification test results show that the device can create realistic tactile feedback that matches actual surface features well. User test results show that users can match actuator vibrations for 40-grit and 180-grit surface textures to actual 40-grit and 180-grit surface textures 99.3 % of the time.
1. Introduction
Teleoperators and virtual environments are important in science, engineering, and education. Teleoperators and virtual environments give users the ability to interact with real or virtual objects across space, time, and size limitations.
Haptic feedback improves grasping, manipulation, learning, and user response [1, 2]. Haptic feedback improves realism, and realism improves user performance. However, most haptic devices only create kinesthetic (weight, inertia, viscous damping, or spring force) feedback or simple unrealistic tactile (position, shape, flexibility, surface texture) feedback [3].
The goal of this study is to create a realistic tactile haptic device for teleoperators and virtual environments. The device must be portable, small, light, and cost-effective. The device must also be natural, intuitive, and easy to use.
1.1. Tactile haptic devices – grounded devices
Massie [4] created the first grounded tactile haptic device. The device uses mechanical linkages and DC motors to create kinesthetic feedback. The device also uses mechanical linkages and DC motors to create simple static or low-frequency tactile (position, shape, or flexibility) feedback. The device is fixed to a stationary base. The overall size, weight, and cost of the device are 168×203×120 mm, 4 pounds, and approximately USD $1,000. Users interact with the device by moving a stylus.
Asamura et al. [5] created a grounded tactile haptic display. The device uses a finger pad with electro-magnetic pin arrays to create simple high-frequency tactile (vibration) feedback. The device is fixed to a stationary base. The overall size, weight, and cost of the device are not reported. The size of the display is approximately 10×10×10 mm. Users interact with the device by attaching their hand to the display.
Hayward and Cruz-Hernandez [6] created a grounded tactile haptic display. The device uses a finger-pad with piezo-electric actuators to create simple high-frequency tactile (friction) feedback. The device is fixed to a stationary base. The overall size, weight, and cost of the device are not reported. The size of the display is 12×12×1 mm. Users interact with the device by touching the display.
Makino et al. [7] created a grounded tactile haptic display. The device uses a palm-sized display with pneumatic actuators to create simple high-resolution static tactile (position and shape) feedback. The device is attached to a stationary base. The overall size, weight, and cost of the device are not reported. The size of the display is 20×20 mm. Users interact with the device by placing their hand on the display.
Kammermeier et al. [3] created a grounded kinesthetic, thermal, and tactile haptic display. The device uses DC motors, Peltier devices, and vibration motors to create simple kinesthetic (force), thermal (temperature), and simple tactile (vibration) feedback. The device is fixed to a stationary base. The overall size, weight, and cost of the device are not reported. The size of the fingertip display elements is 15×15×2 mm. Users interact with the device by attaching their hand to the display.
Dosher and Hannaford [8] created a grounded tactile haptic display. The device uses mechanical linkages and flat coil actuators to create simple static tactile (friction) feedback. The device is fixed to a stationary base. The overall size of the device is 200×200 mm. The overall weight and cost of the device are not reported. The size of display is 5×5 mm. Users interact with the device by attaching their finger to the display.
Hashimoto et al. [9] created a grounded tactile haptic display. The device uses sensors, microprocessors, and speakers to create more realistic low-frequency tactile (position) feedback. The device is fixed to a stationary base. The overall size of the device is 110×107×95 mm. The overall weight and cost of the device are not reported. Users interact with the device by placing their palm on the display.
1.2. Tactile haptic devices – ungrounded devices
Murray et al. [10] created an ungrounded vibro-tactile glove. The device uses small voice coil actuators to create simple high-frequency (force) feedback. The device is portable. The overall size, weight, and cost of the device are not reported. The size and weight of the actuators are 20 mm (diameter) × 4 mm (thickness) and 1.7 g. Users interact with the device by wearing the glove.
Pabon et al. [11] created an ungrounded tactile haptic glove. The device uses optical sensors and disk vibration motors to create more realistic high-frequency tactile (flexibility) feedback. The overall weight and cost of the device are not reported. The sizes of the sensors and actuators are 2.4×2.4×L mm (L is the length of a finger joint) and 5×8×21 mm. Users interact with the device by wearing the glove.
Romano et al. [12] created an ungrounded tactile haptic glove. The device uses optical sensors and disk vibration motors to create more realistic high-frequency tactile (surface texture) feedback. The device is portable. The overall size, weight, and cost of the device are not reported. The sizes of the actuators are 10 mm (diameter) and 12 mm (diameter). Users interact with the device by wearing the glove.
Ryu et al. [13] compared tactile haptic displays for cell phones. The devices use disk vibration motors or voice coil actuators to create simple high-frequency tactile feedback. The devices are portable. The overall sizes, weights, and costs of the devices are not reported. The sizes of the disk vibration motors are 10 mm (diameter) and 32 mm (diameter). The weights of the voice coil actuators are 10 g (with adapters). Users interact with the devices by holding the devices.
2. Tactile perception capabilities
A realistic tactile haptic device creates tactile feedback that matches users’ tactile perception capabilities. Tactile perception is achieved by passive and active touching [14-16]. Passive touching is touching without voluntary motion. Active touching is touching with voluntary motion. A realistic tactile haptic device must give users the ability to detect properties (position, shape, flexibility, surface texture) by passive or active touching.
2.1. Tactile sensing capabilities
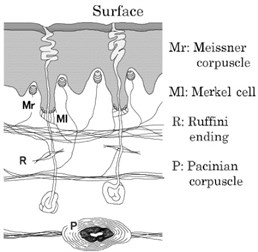
Tactile sensing is achieved by tactile receptors [17] (see Fig. 1). Ml receptors detect small-scale static forces. R receptors detect small-scale high-frequency (100-500 Hz) friction forces. Mr receptors detect small-scale low-frequency (2-40 Hz) vibrations. P receptors detect small-scale high-frequency (40-500 Hz) vibrations. P receptors detect small-scale high-frequency (200 Hz) vibrations most easily. A realistic tactile haptic device must give users the ability to detect static forces, dynamic (100-500 Hz) friction forces, and dynamic (2-500 Hz) vibrations by passive and active touching.
Fig. 1Tactile receptors
2.2. Tactile feedback techniques
Okamura et al. [18] used stylus sensors to measure actual sandpaper and patterned-surface surface textures. The device converts measured surface textures into vibration (amplitude, frequency) parameters. The device does not create tactile (surface texture) feedback. The study showed that different sandpaper and patterned-surface surface textures have different characteristic frequencies.
Tanaka et al. [19] used PVDF (polyvinylidene fluoride) film sensors to measure actual fabric surface textures. The device converts actual surface textures into vibration (amplitude, frequency) parameters. The device does not create tactile (surface texture) feedback. The study showed that different fabric surface textures have different characteristic frequencies.
Kyung et al. [20] used a tactile haptic display to create fixed-amplitude fixed-frequency vibrations. The device uses user tests and regression analysis to match vibrations to actual sandpaper surface textures. The device does not create realistic tactile (surface texture) feedback from actual surface textures. The study showed that tactile (surface texture) perception is related to vibration amplitude and frequency.
Ikei [21] used amplitude modulation (AM), additive synthesis (AS), and pin arrays to create fixed-amplitude mixed frequency (50 Hz, 250 Hz) vibrations. The device does not create realistic tactile (surface texture) feedback from actual surface textures. The study showed that tactile perception is related to vibration frequency.
Romano et al. [12] used optical sensors and disk vibration motors to create variable-amplitude variable-frequency vibrations. The device uses optical sensors to detect hand motions. The device uses disk vibration motors to create different variable-amplitude variable-frequency vibrations for different hand motion speeds. The device does not create realistic tactile (surface texture) feedback from actual surface textures. The study showed that disk vibration motors can be used to create different variable-amplitude variable-frequency vibrations.
Kammermeier et al. [3] used DC motors, Peltier devices, and vibration motors to create forces, temperatures, and vibrations. The device creates different fixed-amplitude fixed-frequency vibrations for different sliding motions. The device creates different damped-amplitude fixed-frequency vibrations for different tapping motions. The device does not create realistic tactile feedback from actual surface features. The study showed that DC motors, Peltier devices, and virations motors can be used to create forces, temperatures, and vibrations.
Garcia-Hernandez et al. [22] used passive pin arrays to create static surface texture patterns. The device does not create realistic tactile (surface texture) feedback from actual surface textures. The study showed that passive pin arrays can be used to create static tactile (surface texture) feedback. The study showed that static tactile (surface texture) perception is related to passive pin array size and pin spacing.
3. Device design
3.1. Device model
This study creates a device (sensor, controller, actuator, sensor installation effect) model for a realistic tactile haptic device (see Fig. 2). The device model needs to create realistic tactile feedback that matches actual surface features well. The device model also needs to create realistic tactile feedback, in real-time.
Fig. 2Device model

The device model uses a vibration sensor to create sensor signal X1 from a physical vibration V, from actual surface features:
where TS is the transfer function model of the vibration sensor. I1 is a transfer function model that represents sensor installation on the actual surface. The device model includes I1 because sensor installation may affect X1, when V and TS do not change.
The device model uses a controller to create controller signal Y1 from sensor signal X1. The device model uses an actuator to create controller vibration Y1TA from controller signal Y1. The device model uses a vibration sensor to create sensor signal X2 from actuator vibration Y1TA:
where TA is the transfer function model of the actuator, and I2 is a transfer function model that represents sensor installation on the actuator.
To create realistic tactile feedback that matches actual surface features exactly, actuator vibration Y1TA must match physical vibration V exactly, and sensor signal X1 must match sensor signal X2 exactly. When Y1TA=V and X1=X2, Eq. (1)-(2) can be used to find V:
Eq. (4) shows that actuator vibration Y1TA matches physical vibration V exactly when X1=X2 and I1=I2. To create realistic tactile feedback that matches actual surface features well, the device uses sensor(s) that are similar, and the device installs the sensor(s) in the same way on the actual surface and the actuator. When Y1TA=V, X1=X2, and I1=I2, Eqs. (1) and (4) can be used to find Y1:
Eq. (6) shows that controller signal Y1 can be generated by multiplying sensor signal X1 by the controller transfer function model Y1=X1(TATSI2)-1.
To create realistic tactile feedback that matches actual surface features well, the controller transfer function model needs to be found. The sensor, actuator, and sensor installation effect transfer function models can be used to find the controller transfer function model.
Trained neural networks (NNs) can be used to model specific human reasoning or human signals. This study uses a trained NN controller to model tactile signals. To train the NN controller, training signal Y1 can be used to create actuator vibration Y1TA, sensor signal X2 can be measured, X2, and Y1 can be sampled to create input and output training vectors, and the training vectors can be used to train the NN controller:
where i= 1, 2, …, n, for n training vector data points.
After training, the NN controller creates a controller signal (Y1)i from (X1)i needed to create an actuator vibration Y1TA that matches vibration V, from actual surface features. As a result, the device model creates realistic tactile feedback that matches actual surface features well. The details of the NN training are given in sections 3.3 and 3.4.
3.2. Device hardware
This study creates a prototype device. The device uses a sensor, NN controller, and actuator to create realistic tactile (surface texture) feedback from actual surface textures.
The prototype device uses a Measurement Specialties LDT0 piezo-polymer film sensor and a Fly-Tek micro-speaker actuator. The sensor can detect small-scale (10-180 Hz) vibrations. The micro-speaker can create small-scale (50-20000 Hz) vibrations. The micro-speaker has an independent frequency and amplitude response.
The sensor and micro-speaker are portable (see Fig. 3). The sensor and micro-speaker are small, light, and cost-effective. The size of the sensor is 13 mm×25 mm. The size of the micro-speaker is 40 mm (diameter). The weights of the components are approximately 10 to 20 g. The costs of the sensor and micro-speaker are approximately USD $4. The sensor and micro-speaker are natural, intuitive, and easy to use. The micro-speaker can generate vibrations on a user’s fingertip.
Fig. 3Supervised NN training process [23]
![Supervised NN training process [23]](https://static-01.extrica.com/articles/15317/15317-img3.jpg)
3.3. NN training process
The prototype device used a trained NN controller. To train the NN controller, a supervised NN training process was used to send input training vectors to the NN controller, calculate errors between NN controller output vectors and output training vectors and modify the NN controller to minimize errors (see Fig. 3) [23]. The trained NN controller duplicated the unknown controller transfer function that converted input training vectors to output training vectors.
The supervised NN training process consisted of five steps:
1. Collect training data.
The path from input, through the unknown function, to output.
2. Normalize the training data.
3. Use normalized input vectors and the NN to compute predicted output vectors.
The path from input, through the NN, to predicted output.
4. Calculate errors between output vectors and predicted output vectors.
5. If the errors are large, update the NN, go to Step 3.
If the errors are small, stop the training process.
The prototype device used a multi-layer perceptron (MLP) NN controller. The MLP NN controller had an input layer, a hidden layer, and an output layer. To reduce complexity, the output data points were divided into 25 equally spaced divisions and each division contained 10 data points. The MLP NN controller used twenty-five NNs to transform input signal vectors into output signal vectors. Each input layer had 250 neurons, each hidden layer had 10 neurons, and each output layer had 10 neurons, and all of the neurons were fully connected.
The output of a neuron was a function of the weighted sum of the net input of the neuron, i.e., Y=f(ν), and it was in the range of [–1, 1]. The initial weights and biases were set to random values between [–1, 1]. The activation function f(ν) suggested by Akkila et al. [24] was used:
All activation function gain values G were set to 0.3. The learning rate of the training process was set to 0.9. The training process used back propagation, steepest descent approximations, and over-fitting controls to calculate NN errors and modify neuron weights. The training process stopped when it reached 400 epochs or the total error was less than 0.1.
3.4. NN training data collection
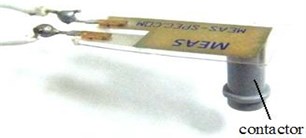
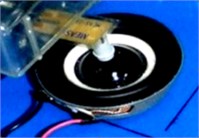
To create training data for the NN controller, a 0.2 gram plastic contactor was attached to the sensor. Adding mass to the sensor increases sensitivity and reduces maximum frequency. Reducing the free-length of the sensor increases maximum frequency. To reduce free-length, the sensor was mounted on an acrylic box. The sensor was installed on the actuator (see Fig. 4).
A function generator was used to create 281 sine, square, triangle, and ramp training signals, with 0.68, 1.68, and 2.68 V amplitudes and 10-250 Hz frequencies. A DC power supply and an intermittent connection were used to create 25 noise training signals, with 0.4, 0.7, 1.0, 1.3, and 1.5 V amplitudes. An oscilloscope was used to measure training signals (Y1) and corresponding sensor signals (X2). Fig. 5 shows one square wave signal vector set.
Fig. 4Sensor, contactor, and micro-speaker
Totally, 306 signal vector sets were tested. Each signal was measured for 250 msec with a sampling rate of 10 kHz. Each training and sensor signal vector was divided into two parts and re-sampled, to create 612 vector sets. Each input and output vector contained 500 data points.
A data expansion method was used to increase the performance of the NN training. A sliding window was used to choose 250 points from each input and output vector. Each time, the sliding window moved 50 points. As a result, there were 612×6 = 3672 vector sets, from 612 signal vector sets, derived from 306 signal vector sets. Each vector set contained 250 input data points and 250 output data points.
Fig. 51.68 V, 50 Hz square wave signal vector set
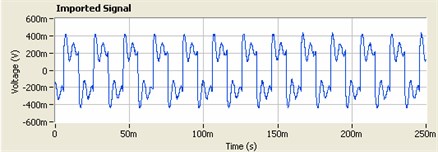
a) Training (output) signal vector
b) Sensor (input) signal vector
Before training, the NN training vectors were normalized, to avoid NN saturation. All of the training vectors were derived from similar, related signal vectors. Therefore, a global normalization approach was used. The minimum and maximum training vector values were –1.92 V and 1.54 V. Therefore, a global minimum value (–2 V), global maximum value (2 V), and a scaling factor (0.9) were used to normalize all training vector values to [–0.9, 0.9], to avoid NN saturation:
where Xnorm is a normalized training vector value, and X is an original training vector value.
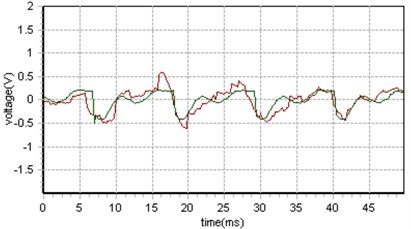
Fig. 6 shows one square wave training signal and one controller output signal, in volts. The green signals are training signals; the red signals are controller output signals. After training, total root mean square error (TRMSE), after being transformed by inverse global normalization, for all 25 NNs was 0.201 V, approximately 5 %.
Fig. 6Training results for square wave signals
4. Verification testing
To complete verification testing, the prototype device was used to create realistic vibrations from actual surface textures. The device sensor was used to measure vibrations from three sandpaper disks. Each disk had a different grit value. The sensor was placed above the plate. Each disk was fixed to a rotating plate. Fig. 7 shows the setup used to measure vibrations.
Fig. 7Setup used to measure vibrations
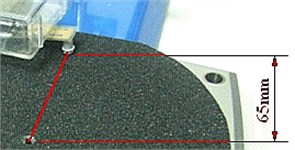
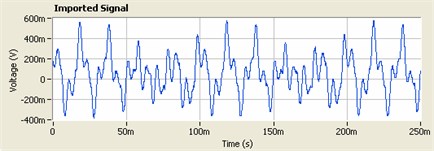
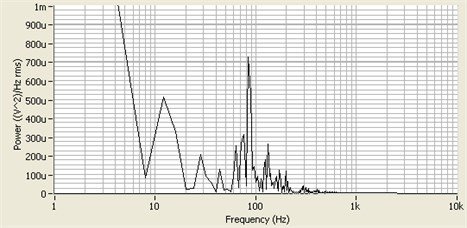
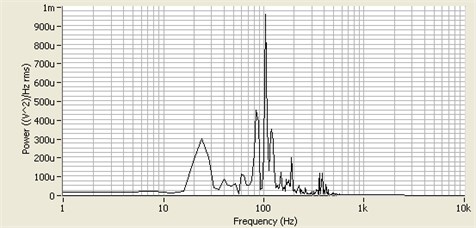
The sensor contactor touched each disk at a point 65 mm from the center of the plate. The plate rotated at approximately π/12 rad/s, which moved the disk past the contactor at 17 mm/s. The setup dimensions and speeds were chosen to create 100-200 Hz vibrations. Fig. 8 shows measured vibrations from 40-grit sandpaper disk. Fig. 9 shows the measured frequency spectrum for the 40-grit disk.
The measured amplitudes for the 40-grit, 80-grit, and 180-grit disks were 400 mV, 300 mV, and 200 mV. The results showed that the measured amplitudes were less for the fine surface textures. The measured center frequencies for the 40-grit, 80-grit, and 180-grit disks were 80 Hz, 150 Hz, and 200 Hz. The results showed that the measured center frequencies were greater for the fine surface textures.
Fig. 8Measured vibrations from 40-grit sandpaper disk

Fig. 9Measured frequency spectrum from 40-grit sandpaper disk
The measured surface textures were used to create sensor signal vectors, the sensor signal vectors and the NN controller were used to create NN controller signal vectors. NN controller signal vectors, an arbitrary waveform generator, and the micro-speaker were used to create micro-speaker vibrations. Fig. 10 shows the measured micro-speaker vibrations for the 40-grit sandpaper disk. Fig. 11 shows the measured frequency spectrum for the micro-speaker.
The measured amplitudes for the 40-grit, 80-grit, and 180-grit micro-speaker vibrations were 400 mV, 300 mV, and 200 mV. The measured center frequencies for the 40-grit, 80-grit, and 180-grit micro-speaker vibrations were 100 Hz, 150 Hz, and 200 Hz.
The results show that micro-speaker vibration amplitudes matched measured surface texture vibration amplitudes well, in the time domain, micro-speaker vibration frequencies matched measured surface texture vibration frequencies well, in the frequency domain, and the device creates realistic vibrations from actual surface textures.
Fig. 10Micro-speaker vibrations for the 40-grit sandpaper disk

Fig. 11Measured frequency spectrum for the micro speaker
5. Feedback effects
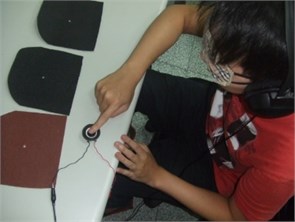
To complete user testing, the device was used to create realistic tactile (surface texture) feedback from actual surface textures. Twenty-three subjects (19 males, 4 females) used the realistic tactile haptic device to complete three user tests (a tactile perception test, a tactile matching test, and a tactile differentiation test) and a feedback session. The subject ages ranged from 23-31 years. None of the subjects had previous experience with tactile haptic devices.
For the three user tests, the subjects touched sandpaper disks and micro-speakers, the subjects wore eye coverings, to eliminate visual feedback, and the subjects wore headphones and listened to white noise, to eliminate audio feedback (see Fig. 12).
Fig. 12User tests
5.1. Tactile perception test
The purpose of the tactile perception test was to verify that the subjects could detect surface textures. The subjects touched three randomly ordered sandpaper disks (40-grit, 80-grit, 180-grit) with active touch, identified the order of the three randomly ordered sandpaper disks (from left to right), and rated the three randomly ordered sandpaper disks as (most different, different, similar, most similar).
All of the subjects completed the tactile perception test, all of the subjects identified the order of the sandpaper disks, most of the subjects rated the 40-grit disk most different, and most of the subjects rated the (80-grit, 180-grit) disks most similar. The results showed that the subjects could detect the 40-grit, 80-grit, and 180-grit surface textures.
5.2. Tactile matching test
The purpose of the tactile matching test was to verify that the subjects could detect micro-speaker vibrations, and verify that the subjects could match real surface textures to micro-speaker vibrations.
The subjects touched three randomly ordered sandpaper disks (40-grit, 80-grit, 180-grit) with active touch, touched three randomly ordered micro-speaker vibrations with passive touch, matched the randomly ordered sandpaper disks to the randomly ordered micro-speaker vibrations, and repeated the procedure six times (twice for each sandpaper disk).
All of the subjects completed the tactile matching test, there were significant differences in the subject responses for the different randomly ordered micro-speaker vibrations, (p-value < 0.0001), and there were no significant differences in the subject responses for the different subjects (p-value = 0.9431).
The subjects matched the randomly ordered (40-grit, 80-grit, 180-grit) sandpaper disks to the randomly ordered micro-speaker vibrations for the (40-grit, 80-grit, 180-grit) sandpaper disks (78.3 %, 67.4 %, 50.0 %) of the time, (135.1 %, 102.4 %, 50.2 %) improvements over guessing, (p-values < 0.0001, p-values < 0.0001, p-values < 0.0001).
The subjects matched the randomly ordered (40-80 grit, 80-180 grit) sandpaper disks to the randomly ordered micro-speaker vibrations for the (40-80 grit, 80-180 grit) sandpaper disks (91.3 %, 74.6 %) of the time, (60.8 %, 0.0 %) improvements over guessing (p-values < 0.0001, p-values = 0.1882).
The subjects matched the randomly ordered (40-grit and 180-grit) sandpaper disks to the randomly ordered micro-speaker vibrations for the (40-grit and 180-grit) sandpaper disks (99.3 %) of the time, a (96.8 %) improvement over guessing (p-value < 0.0001).
The results showed that the device creates realistic surface texture feedback for (40-80 grit) surface textures, and future work is needed to create more realistic surface texture feedback for (80-180 grit) surface textures.
5.3. Tactile identification test
The purpose of the tactile identification test was to verify that the subjects could detect vibrations that do match real surface textures, and verify that the subjects could detect vibrations that do not match real surface textures.
The subjects touched three randomly ordered sandpaper disks (40-grit, 80-grit, 180-grit) with active touch, touched five randomly ordered micro-speaker vibrations (40-grit, 80-grit, 180-grit, (2 V, 100 Hz) sine wave, (1 V, 100 Hz) square wave) with passive touch, identified the randomly ordered micro-speaker vibrations that matched the randomly ordered sandpaper disks, identified the randomly ordered micro-speaker vibrations that did not match the randomly ordered sandpaper disks, and repeated the procedure five times (three times for the randomly ordered micro-speaker vibrations that matched the randomly ordered sandpaper disks, one time for the sine wave vibration that did not match the randomly ordered sandpaper disks, one time for the square wave vibration that did not match the randomly ordered sandpaper disks).
To keep a balanced design, data was collected for 21 subjects, there were significant differences in the subject responses for the randomly ordered micro-speaker vibrations, (p-value < 0.0001), and there were no significant differences in the subject responses for the different subjects (p-value = 0.7951).
The subjects identified the randomly ordered micro-speaker vibrations that (did and did not) match the randomly ordered sandpaper disks 59.0 % of the time, a 136.0 % improvement over guessing, (p-value < 0.0001).
The subjects identified the randomly ordered micro-speaker vibrations that did match the randomly ordered sandpaper disks 61.9 % of the time, a 147.6 % improvement over guessing, (p-value < 0.0001).
The subjects identified the randomly ordered sine wave vibrations that did not match the randomly ordered sandpaper disks 76.2 % of the time, a 204.8 % improvement over guessing, (p-value < 0.0001).
The subjects identified the randomly ordered square wave vibrations that did not match the randomly ordered sandpaper disks 33.3 % of the time; the result was not a significant improvement over guessing (p-value = 0.4385).
There were no significant differences between the subject responses and the randomly ordered micro-speaker vibrations, for the randomly ordered micro-speaker vibrations that did match the randomly ordered sandpaper disks, (p-value = 0.7607).
There were no significant differences between the subject responses and the randomly ordered micro-speaker vibrations, for the randomly ordered sine wave vibrations that did not match the randomly ordered sandpaper disks, (p-value = 0.0708).
There were significant differences between the subject responses and the randomly ordered micro-speaker vibrations, for the randomly ordered square wave vibrations that did not match the randomly ordered sandpaper disks, (p-value = 0.0106).
The results showed that realistic touch does matter. The results showed that realistic tactile haptic feedback improves user surface texture perception.
5.4. Feedback session
The purpose of the feedback session was to identify subject feedback, recommendations, and needs for future work. The results showed that most of the subjects felt that the realistic tactile haptic device was natural, intuitive, and easy to use, most of the subjects felt that their finger became less sensitive as the tests progressed, and most of the subjects felt that reduced sensitivity may have affected their answers as the tests progressed.
The results showed that the number of errors decreased (0.05 errors per trial), during the tactile matching test, (p-value = 0.0472). The results showed that the number of errors did not change, during the tactile identification test, (p-value = 0.8897). Therefore, the results showed that reduced sensitivity did not affect their answers as the tests progressed.
One subject felt that the realistic tactile haptic device needed a fixture, to position their hand when they touched the micro-speaker, and the subject felt that a fixture could help them detect vibrations better. Some of the subjects felt that the realistic tactile haptic device needed to create friction effects.
6. Conclusions
This study creates a realistic tactile haptic device, uses the device to create realistic tactile haptic feedback, and measures the effects of realistic tactile haptic feedback on user surface texture perception. The device considers sensor, actuator, and sensor installation effects. The device gives users the ability to detect features, properties, and vibrations by touching.
To complete verification testing, the device sensor was used to measure vibrations from three sandpaper disks. Sensor signal vectors and the NN controller were used to create NN controller signal vectors. NN controller signal vectors, a waveform generator, and a micro-speaker were used to create micro-speaker vibrations.
Verification test results show that the device can create realistic tactile feedback from actual surface features. The device can create realistic tactile feedback that matches actual surface features well. The device can also create realistic tactile feedback, in real-time. The device is portable, small, light, and cost-effective.
Study results show that realistic tactile haptic feedback improves user surface texture perception. Users can detect 40-grit, 80-grit, and 180-grit surface textures. Users can detect micro-speaker vibrations for 40-grit, 80-grit, and 180-grit surface textures. Users can match (40-grit and 180-grit) surface textures to micro-speaker vibrations for (40-grit and 180-grit) surface textures (99.3 %) of the time.
Overall user test results also show that the device can create realistic surface texture feedback for 40-80 grit surface textures. However, more work is needed to create realistic surface texture feedback, for 80-180 grit surface textures. More work is needed to develop fixtures for attaching the device to a user’s finger. More work is also needed to combine vibrations and friction forces into the device.
References
-
Osgouei R., Lee H., Choi S. Haptic-enabled driving training system. Proceedings of the IEEE International Workshop on Robot and Human Interactive Communication, 2013, p. 302-303.
-
Viciana-Abad R., Reyes-Lecuona A., Rosa-Pujazón A., Pérez-Lorenzo J. The influence of different sensory cues as selection feedback and co-location in presence and task performance. Multimedia Tools and Applications, Vol. 68, Issue 3, 2014, p. 623-639.
-
Kammermeier P., Kron A., Hoogen J., Schmidt G. Display of holistic haptic sensations by combined tactile and kinesthetic feedback. Presence: Teleoperators and Virtual Environments, Vol. 13, Issue 1, 2004, p. 1-15.
-
Massie T. H., Salisbury J. K. The PHANTOM haptic interface: a device for probing virtual objects. Proceedings of the ASME Winter Annual Meeting, Symposium on Haptic Interfaces for Virtual Environment and Teleoperator Systems, Chicago, IL, 1994, p. 132-137.
-
Asamura N., Tomori N., Shinoda H. A tactile feeling display based on selective stimulation to skin receptors. Virtual Reality International Symposium, 1998, p. 36-42.
-
Hayward V., Cruz-Hernandez J. Tactile display device using distributed lateral skin stretch. International Mechanical Engineering Congress & Exposition, 2000, p. 1309-1314.
-
Makino Y., Asamura N., Shinoda H. A whole palm tactile display using suction pressure. IEEE International Conference on Robotics and Automation, 2004, p. 1124-1129.
-
Dosher J., Hannaford B. Human interaction with small haptic effects. Presence: Teleoperators and Virtual Environments, Vol. 14, Issue 3, 2005, p. 329-344.
-
Hashimoto Y., Nakata S., Kajimoto H. Novel tactile display for emotional tactile experience. International Conference on Advances in Computer Entertainment Technology, 2009, p. 124-131.
-
Murray A., Klatzky R., Khosia P. Psychophysical characterization and test bed validation of a wearable vibro-tactile glove for tele-manipulation. Presence: Teleoperators and Virtual Environments, Vol. 12, Issue 2, 2003, p. 156-182.
-
Pabon S., Sotgiu E., Leonardi R., Brancolini C., Portillo-Rodriguez O., Frisoli A., Bergamasco M. A data-glove with vibro-tactile stimulators for virtual social interaction and rehabilitation. The 10th Annual International Workshop on Presence, 2007, p. 345-388.
-
Romano J., Gray S., Jacobs N., Kuchenbecker K. Toward tactilely transparent gloves: collocated slip sensing and vibrotactile actuation. Proceedings of the 3rd Joint EuroHaptics Conference and Symposium on Haptic Interfaces for Virtual Environment and Teleoperator Systems, 2009, p. 279-284.
-
Ryu J., Jung J., Park G., Choi S. Psychophysical model for vibrotactile rendering in mobile devices. Presence: Teleoperators and Virtual Environments, Vol. 19, Issue 4, 2010, p. 364-387.
-
Hollins M., Bensma S., Roy E. Vibrotaction and texture perception. Behavioural Brain Research, Vol. 135, Issue 1-2, 2002, p. 51-56.
-
Smith A., Chapman C., Deslandes M., Langlais J., Thibodeau M. Role of friction and tangential force variation in the subjective scaling of tactile roughness. Experimental Brain Research, Vol. 144, Issue 2, 2002, p. 211-223.
-
Hwang J., Hwang, W. Vibration perception and excitatory direction for haptic devices. Journal of Intelligent Manufacturing, Vol. 22, Issue 1, 2010, p. 17-27.
-
Johansson R., Vallbo A. Tactile sensory coding in the glabrous skin of the human hand. Trends in Neurosciences, Vol. 6, 1983, p. 27-32.
-
Okamura A. M., Dennerlein J. T., Howe R. D. Vibration feedback models for virtual environments. IEEE International Conference on Robotics and Automation, Leuven, Belgium, Vol. 1, 1998, p. 674-679.
-
Tanaka Y., Tanaka M., Chonan S. Development of a sensor system for collecting tactile information. Microsystem Technologies, Vol. 13, Issues 8-10, 2007, p. 1005-1013.
-
Kyung K. U., Son S. W., Kwon D. S., Kim M. S. Design of an integrated tactile display system. IEEE International Conference on Robotics and Automation, Vol. 1, 2004, p. 776-778.
-
Ikei Y. Development of realistic haptic presentation media. Virtual and Mixed Reality. Lecture Notes in Computer Science, Vol. 5622, 2009, p. 318-325.
-
Garcia-Hernandez N., Tsagarakis N., Caldwell D. Feeling through tactile displays: A study on the effect of the array density and size on the discrimination of tactile patterns. IEEE Transactions on Haptics, Vol. 4, Issue 2, 2011, p. 100-110.
-
Hagan M. T., Demuth H. B., Jesus O. D. An introduction to the use of neural networks in control systems. International Journal of Robust and Nonlinear Control, Vol. 12, Issue 11, 2002, p. 959-985.
-
Akkila T., Lindblad T., Lund-Jensen B., Szekely G., Eide A. A hardware implementation of an analog neural network for Gaussian peak-fitting. Nuclear Instruments and Methods in Physics Research Section A: Accelerators, Spectrometers, Detectors and Associated Equipment, Vol. 327, Issues 2-3, 1993, p. 573-579.
About this article
The authors would like to thank the Ministry of Science and Technology of Taiwan for Grant number MOST 103-2221-E-002-159, which was used to complete this study.
