Abstract
The condition monitoring and fault diagnosis of rolling element bearings not only depend on fault type but also fault severity which is also essential for making proper maintenance decision. Aiming at fault severity assessment of rolling element bearings, a new indicator based on the bicoherence spectrum is proposed. The quadratic phase coupling (QPC) which is one of the most important nonlinear characteristics of fault-related signals can be detected by the bicoherence spectrum. The deepening fault severity usually results in more frequency components involving in coupling. In order to quantify the coupling degree which is closely related to fault severity, we choose the mean value of the bicoherence spectrum as an indicator. Experiments results showed that the quantitative trend prediction of different fault severities of bearing is realized.
1. Introduction
Rolling element bearings are key components of rotating machinery, and the faults related to the bearings are one of the major reasons that lead to machine breakdown [1, 2]. Hence, it is necessary to detect and diagnose these faults at an early stage.
Vibration signals collected from bearings carry the rich information on machine health conditions [3]. Vibration-based condition monitoring (VCM) is the most popular technique for the diagnosis of faults related to rotating machines because the machine vibration response is sensitive to any small structural or process parameter change [4]. Many vibration-based methods for faults diagnosis have been proposed in the past decades. Some success, indeed, have been achieved by these conventional techniques. However, most of them focus on fault identification, and limited work has been reported for fault severity assessment, which is also critical to make decision for maintenance actions [5, 6]. Therefore, it is very necessary to predict the trend of development of the bearing fault for the machine.
In recent years, thanks to the advantages that conventional methods can’t match, such as nonlinear system identification, phase information retention and Gussian noise elimination properties, Higher order spectrum (HOS) techniques have gained more and more attention. The bispectrum and the bicoherence spectrum are the two common HOS techniques. The bispectrum is complex and interpreted as measuring the amount of coupling between frequency components in signals. Hence the relationship between the different harmonic components of a signal can be observed in the bispectrum. Jyoti K. Sinha et al. did a lot research about the application of the bispectrum in rotating machinery [7, 8]. The bicoherence spectrum is the normalized forms of the bispectrum, and was also common used in machinery diagnostics [9, 10]. Fault-related signals usually show nonlinear terms. These terms cause nonlinear interactions between different spectral components of the signals. One of the most important nonlinear interaction is the quadratic phase coupling (QPC), i.e., the interaction between the original components (f1,φ1) and (f2,φ2) leads to the generation of the coupling components (f1-f2,φ1-φ2) and (f1+f2,φ1+φ2). While the bispectrum and the bicoherence spectrum are useful tool to detect the presence of QPC. In particular, the bicoherence spectrum may be used to discriminate between nonlinearly coupled components and spontaneously excited components, and to measure the fraction of energy due to QPC. Therefore, this paper attempts to assess the fault severity based on QPC by using the bicoherence spectrum.
2. Related work
2.1. Bispectrum
Considering a zero-mean stationary random signal x(t), its bispectrum can be defined as:
where X(f) is the discrete Fourier transform of x(t), X*(f) is the complex conjugate of X(f), and E[X(f)] denotes the statistical expectation value of X(f). If f1, f2 and f3 are independent, their phases will be independent relative to each other as well. So, the bispectrum will approach zero by performing averaging. However, if f1, f2 and f3 are related through coupling, their phases will be dependent relative to each other, therefore averaging will produce a non-zero result. This property can be used to determine if f1, f2 and f3 are nonlinearly coupled [11]. It can be seen from Eq. (1) that the value of the bispectrum at (f1,f2) depends on the coupling between f1, f2 and f3 and the Fourier amplitudes of f1, f2 and f3. But sometimes it is difficult to describe the degree of phase coupling which is the dominate nonlinear characteristic related to the fault, because the bispectrum is also associated with the Fourier amplitudes at frequencies f1, f2 and f3. To eliminate the negative effects of the amplitude, one may use the bicoherence spectrum.
2.2. Bicoherence spectrum
The bicoherence spectrum, a normalized bispectrum, is given as follows:
where b2c(f1,f2) is called the squared bicoherence spectrum, and the operator |∙| denotes the absolute value. E{∙} represents the expectation. The bicoherence coefficient bc is bounded between 0 and 1, and is amplitude independent. We can also conclude that the degree of nonlinear coupling increases where the value of bc is close to one, whilst it decreases if the value of bc approach zero. So, the bicoherence spectrum is an useful tool to detect the degree of nonlinear coupling between the interacting frequencies, f1, f2 and f3, and then indicating the nonlinearity in signals. Moreover, b2c(f1,f2) measures the percentage of energy at frequency f3 due to coupling from f1 and f2, therefore the squared bicoherence spectrum provides the ability to make a quantitative determination of nonlinearly coupled signals.
3. Fault severity assessment based on bicoherence spectrum
In this paper, we attempt to make a quantitative analysis of different fault severities based on the bicoherence spectrum.
The steps of fault severity assessment are actually the procedures for computing the bicoherence spectrum. For an arbitrary input signal x(t), with a record length T=L∆, where is the number of samples and is the time between samples, its bicoherence spectrum estimation is given as the follow [11]:
(1) Divide the original data record into segments with the length of where . , 1,…, and 1,…, .
(2) Remove the mean value from each segment.
(3) Multiply with a window for each segment to reduce leakage.
(4) Calculate the Fourier amplitudes, using the FFT by:
(5) Estimate the squared bicoherence spectrum by:
(6) Gain the QPC features according to the squared bicoherence spectrum.
(7) Repeat the steps (1)-(6) for different fault severities and complete the fault severity assessment.
Note that one can reduce the number of calculations needed to compute the bicoherence spectrum by taking advantage of some symmetry properties of the bispectrum as well as physical limitations due to sampling [11]. The actual computation region can be confined to and where and are frequencies involving in coupling, and is the sampling frequency. The region forms a distinctive “triangle shape”, that can clearly be seen in Fig. 1.
4. Experimental validation and results
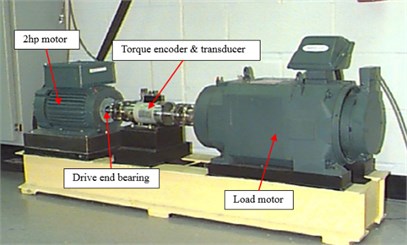
The vibration data analyzed in this paper were downloaded from the Case Western Reserve University Bearing Data Central [12]. As shown in Fig. 2, the rigs consist of a 2hp motor driving a shaft on which a torque transducer and encoder are mounted, and a dynamometer-load. The test bearings supporting the motor shaft at the drive end are 6205-2RS JEM SKF deep groove ball bearings. Single point faults with fault diameters 0.1778 mm, 0.3556 mm, 0.5332 mm were introduced to the ball, inner raceway and outer raceway of the test bearing using electro-discharge machining (EDM). Vibration data measured in the vertical direction on the housing of the drive-end bearing were collected using an acquisition system at a sampling frequency of 12 kHz for different bearing conditions.
Fig. 1The computation region of the bicoherence spectrum
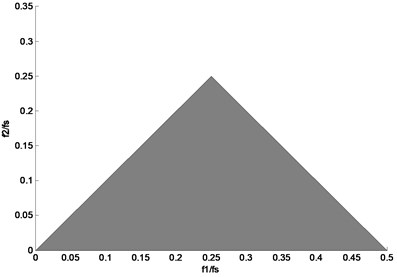
Fig. 2The experimental rig
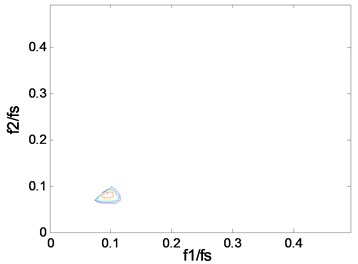
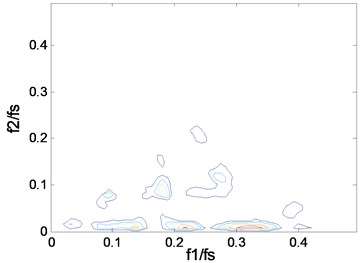
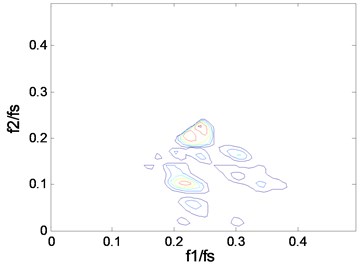
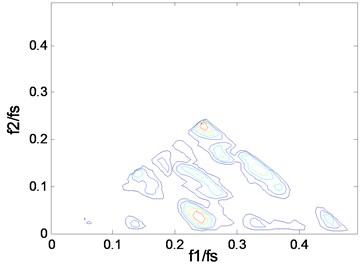
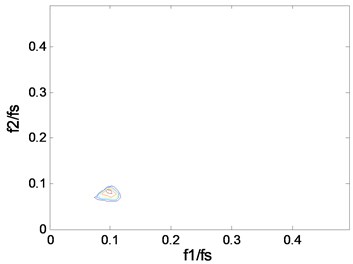
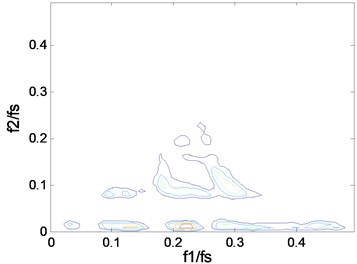
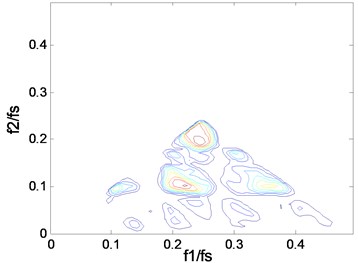
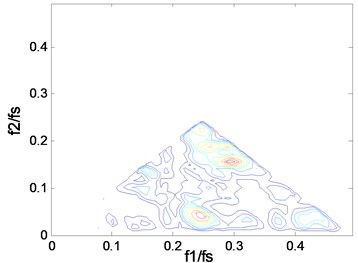
The vibration signals of inner raceway fault (IRF) with three severity cases (case_1: 0.1778 mm, case_2: 0.3556 mm, and case_3: 0.5332 mm) and the normal case (case_0: Normal) at four rotating speeds (1730, 1750, 1772, 1797 rpm) are considered. The sampling frequency is 12 kHz. The contours of the squared bicoherence spectrum for four cases at two rotating speeds (1750, 1797 rpm) are shown in Fig. 3 and Fig. 4 respectively.
Fig. 3The contours of bc2f1,f2 at 1750 rpm: a) case_0, b) case_1, c) case_2, d) case_3
a)
b)
c)
d)
Fig. 4The contours of bc2f1,f2 at 1797 rpm: a) case_0, b) case_1, c) case_2, d) case_3
a)
b)
c)
d)
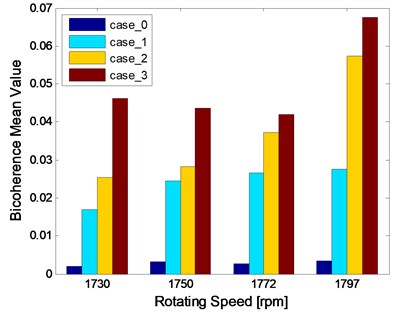
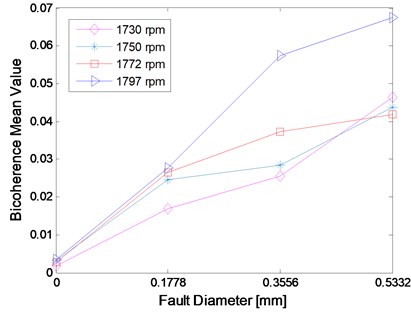
We know that measures the percentage of energy at frequency due to coupling from and . The contours show clearly what frequencies take part in the coupling. The “triangle shape” region is becoming more and more distinct when the fault severity increases, which indicates that the deepening fault severity results in more frequency pairs involving in coupling. In particular, there is only one frequency pair that takes part in coupling in the normal case and more peaks will appear in the fault cases, which can be used to separate the normal from the fault. A peak in can be explained in a sum interaction between two frequencies to give a peak at . Based on the description above, we know that the peak, namely the value of , is an important parameter that can reflect the fault severity. But one or other of the peaks can’t reflect the whole trend, the mean may be a good indicator. The mean value of the squared bicoherence in four cases at four rotating speeds are shown in Table 1. The corresponding bar chart and the trend curve are shown in Fig. 5. It can be clearly seen from Fig. 5 that the mean of increases with the fault severity, meaning the fault is becoming more and more serious when the mean value increases. The change is relatively smooth from a light severity to a heavy one, but it changes sharply from the normal to the fault, such as, at 1772 rpm, the mean value is just 0.0027 in case_0, while it becomes 0.0266 in case_1 which is almost ten times of the former. This can be explained by the fact that the fault leads to more frequency pairs taking part in coupling, which results in more energy due to coupling. Therefore, the mean value of the squared bicoherence may be a strong indicator of the fault trend prediction.
Table 1The mean of the squared bicoherence in different conditions
cases | 1730 rpm | 1750 rpm | 1772 rpm | 1797 rpm |
case_0 | 0.0019 | 0.0033 | 0.0027 | 0.0035 |
case_1 | 0.0168 | 0.0245 | 0.0266 | 0.0276 |
case_2 | 0.0255 | 0.0283 | 0.0373 | 0.0574 |
case_3 | 0.0463 | 0.0437 | 0.0419 | 0.0676 |
Fig. 5The mean of bc2f1,f2 in different conditions: a) the bar chart, b) the trend curve
a)
b)
5. Conclusions
The fault severity assessment is very important for condition monitoring of rotating machinery at an early stage. The bicoherence spectrum is a useful signal processing technique and has excellent ability to detect nonlinearity, especially QPC. In this paper, we attempt to realize the quantitative detection of the fault on rolling element bearings and the assessment indicator based on the bicoherence spectrum is proposed. The experimental results show that the bicoherence spectrum is sensitive to different severities of fault. The mean value of the bicoherence spectrum may be a good indicator of fault severity assessment.
References
-
Liu X. F., Bo L., He X. X., Veidt M. Application of correlation matching for automatic bearings fault diagnosis. Journal of Sound and Vibration, Vol. 331, Issue 26, 2012, p. 5838-5852.
-
Jalan K., Mohanty A. R. Model based fault diagnosis of a rotor-bearing system form is alignment and unbalance under steady-state condition. Journal of Sound and Vibration, Vol. 327, Issues 3-5, 2009, p. 604-622.
-
Jiang X. X., Li S. M., Cheng C. A novel method for adaptive multi-resonance bands detection based on VMD and using MTEO to enhance rolling element bearing fault diagnosis. Shock and Vibration, https://doi.org/10.1155/2016/8361289, Vol. 2016, 2016.
-
Sinha J. K. Health Monitoring Techniques for Rotating Machinery. Ph.D. Thesis, University of Wales, UK, 2002.
-
Hong H. B., Liang M. Fault severity assessment for rolling element bearings using the Lempel-Ziv complexity and continuous wavelet transform. Journal of Sound and Vibration, Vol. 320, 2009, p. 452-468.
-
Zhao S. F., Liang L., Xu G. H. Quantitative diagnosis of a spall-like fault of a rolling element bearing by empirical mode decomposition and the approximate entropy method. Mechanical Systems and Signal Processing, Vol. 40, Issue 26, 2013, p. 154-177.
-
Sinha J. K., Elbhbah K. A future possibility of vibration based condition monitoring of rotating machines. Mechanical Systems and Signal Processing, Vol. 36, Issues 1-2, 2013, p. 231-240.
-
Yunusa-Kaltungo A., Sinha J. K. Combined bispectrum and trispectrum for faults diagnosis in rotating machines. Proceedings of IMechE Part O: Journal of Risk and Reliability, Vol. 228, Issue 4, 2014, p. 419-428.
-
Li Y., Lin J., Wang X. F., Lei Y. G. Biphase randomization wavelet bicoherence for mechanical fault diagnosis. Measurement, Vol. 49, 2014, p. 407-420.
-
Li Y., Wang X. F., Lin J., Shi S. Y. A wavelet bicoherence-based quadratic nonlinearity feature for translational axis condition monitoring. Sensors, Vol. 14, Issue 2, 2014, p. 2071-2088.
-
Gillespie B. W. Spectral Analysis of Meteor Wind Data. Ph.D. Thesis, University of New Hampshire, 1994.
-
Case Western Reserve University Bearings Data Central. https://csegroups.case.edu/bearingsdatacenter/pages/12k-drive-end-bearings-fault-data, 2016.
About this article
This work is supported from the National Science and Technology Major Project of China (Grant No. 2010ZX04007-051) and International Program for graduate students of Beijing University of Technology. The authors would like to thank the Case Western Reserve University Bearings Data Center for kindly providing the experimental data.
